
Solana (SOL) price has struggled to hold momentum even as excitement around its ETF launch builds. The token is down 2.2% in the past 24 hours and roughly 1% over the month, hinting that traders remain cautious.
Despite being up more than 11% year-on-year, the short-term setup is getting tense, and the next 10% move could decide if the coin price heads for a long winter.
Hodlers And Mid-Term Holders Start To Cash Out
Solana’s price weakness is starting to show up on-chain. The hodler net position change, which measures whether long-term holders are adding or reducing holdings, has been negative for the past three days.
On October 25, the metric stood at –3.82 million SOL. By October 27, it had climbed slightly to –3.90 million SOL, indicating that more tokens are flowing out of long-term wallets.
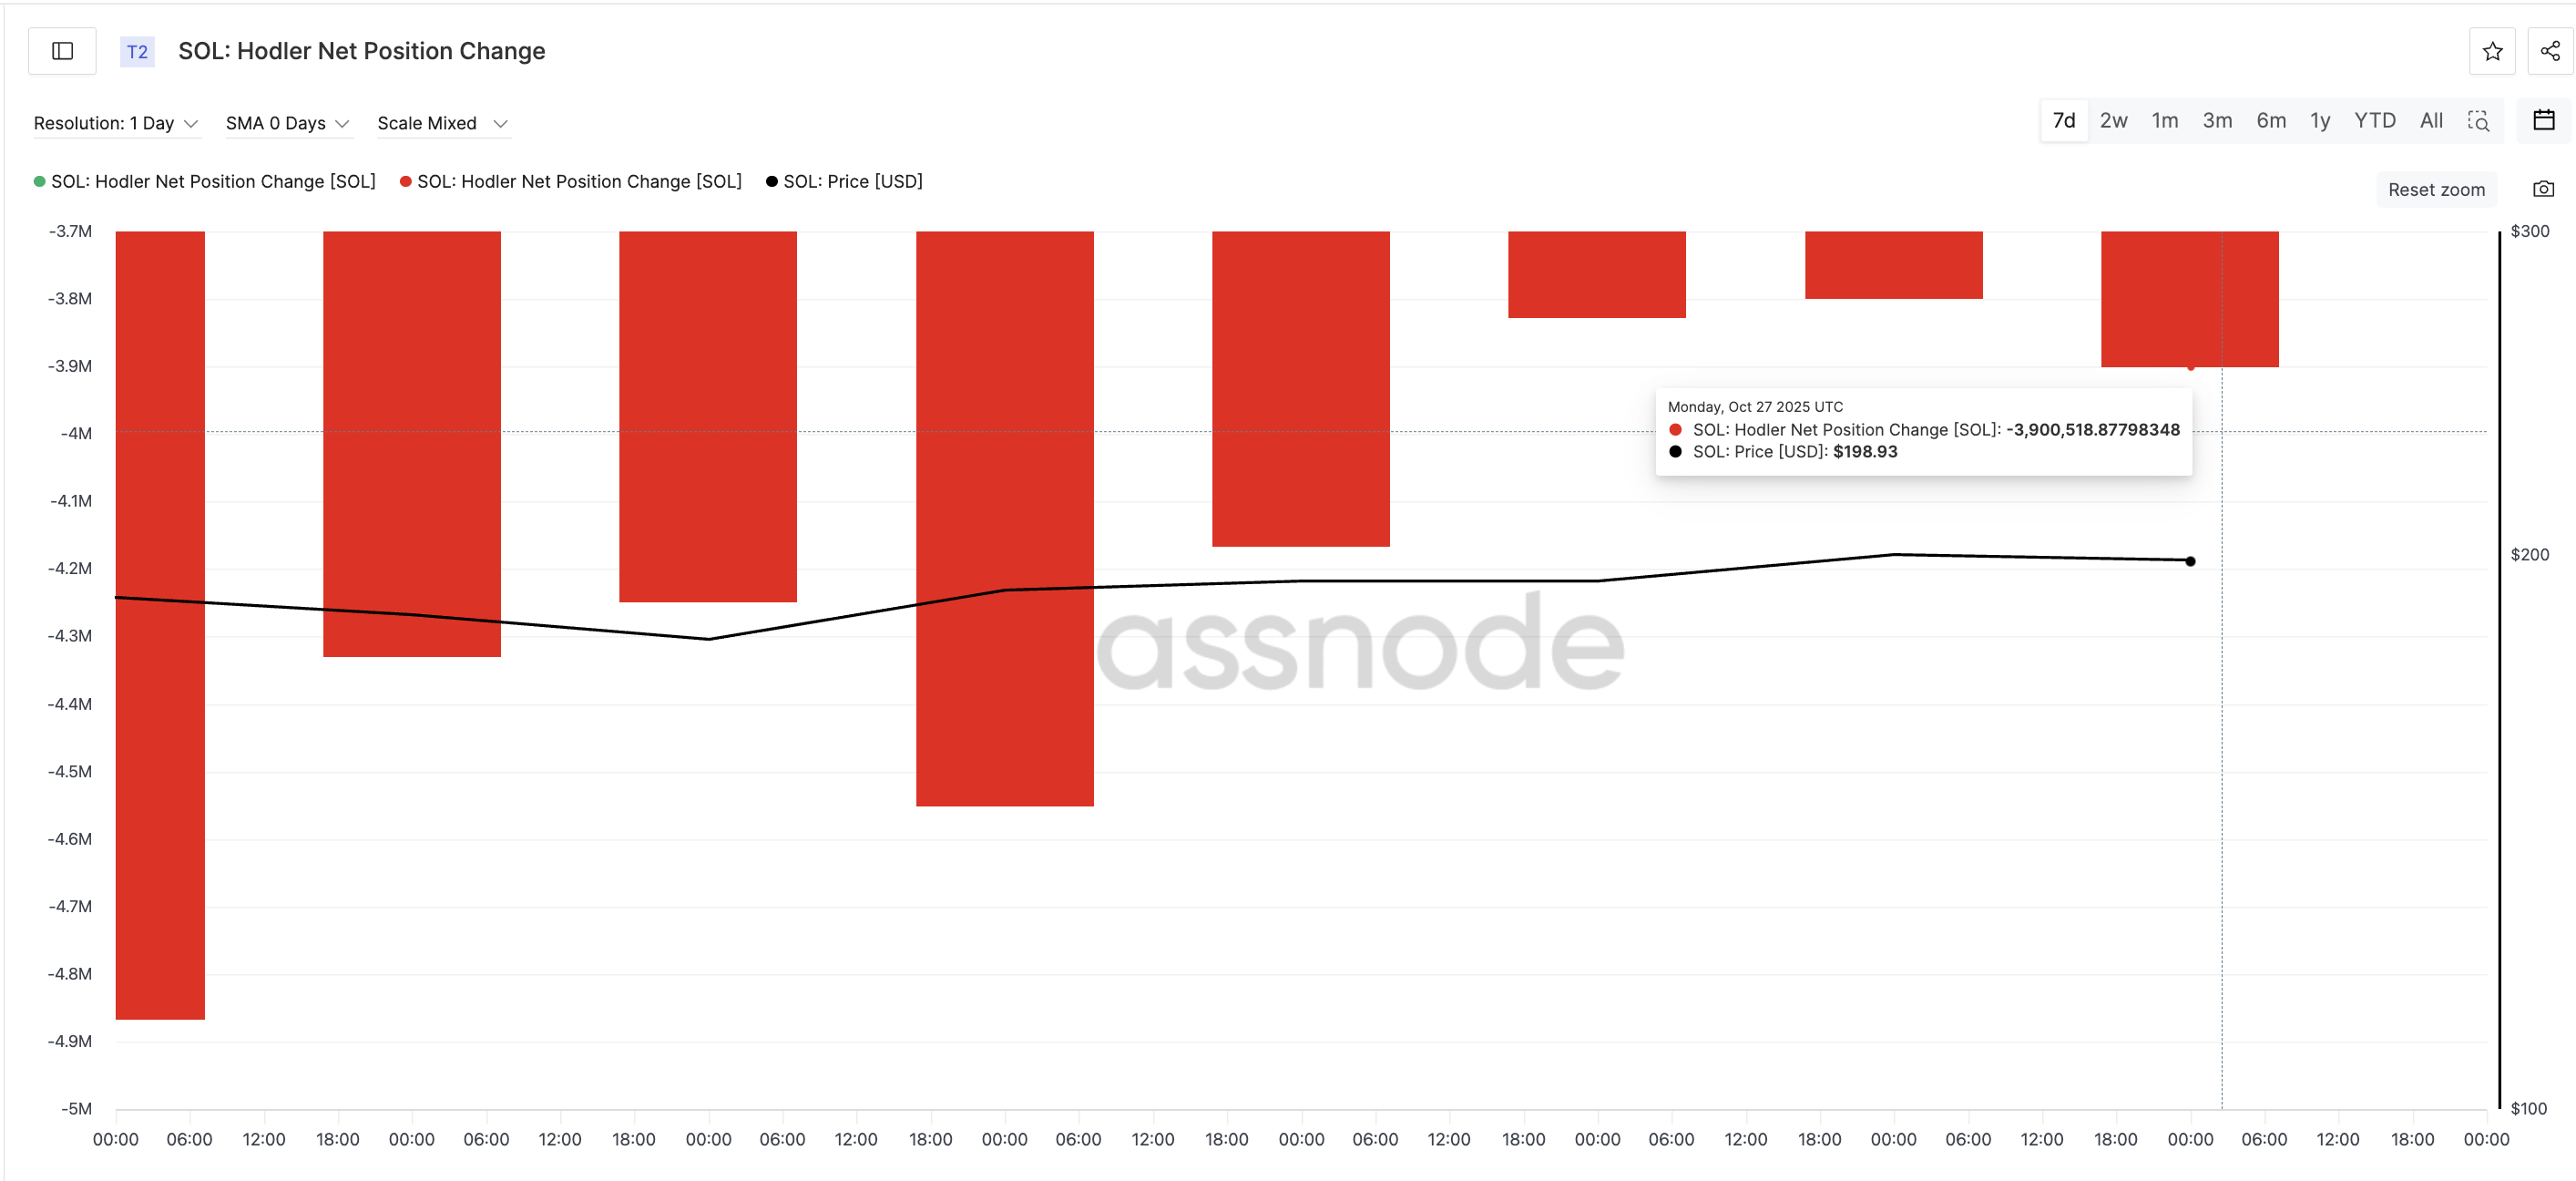
While this isn’t as severe as the –4.86 million SOL reading on October 20, it still shows growing sell pressure from long-term investors who are likely taking profits or reducing exposure ahead of volatility.
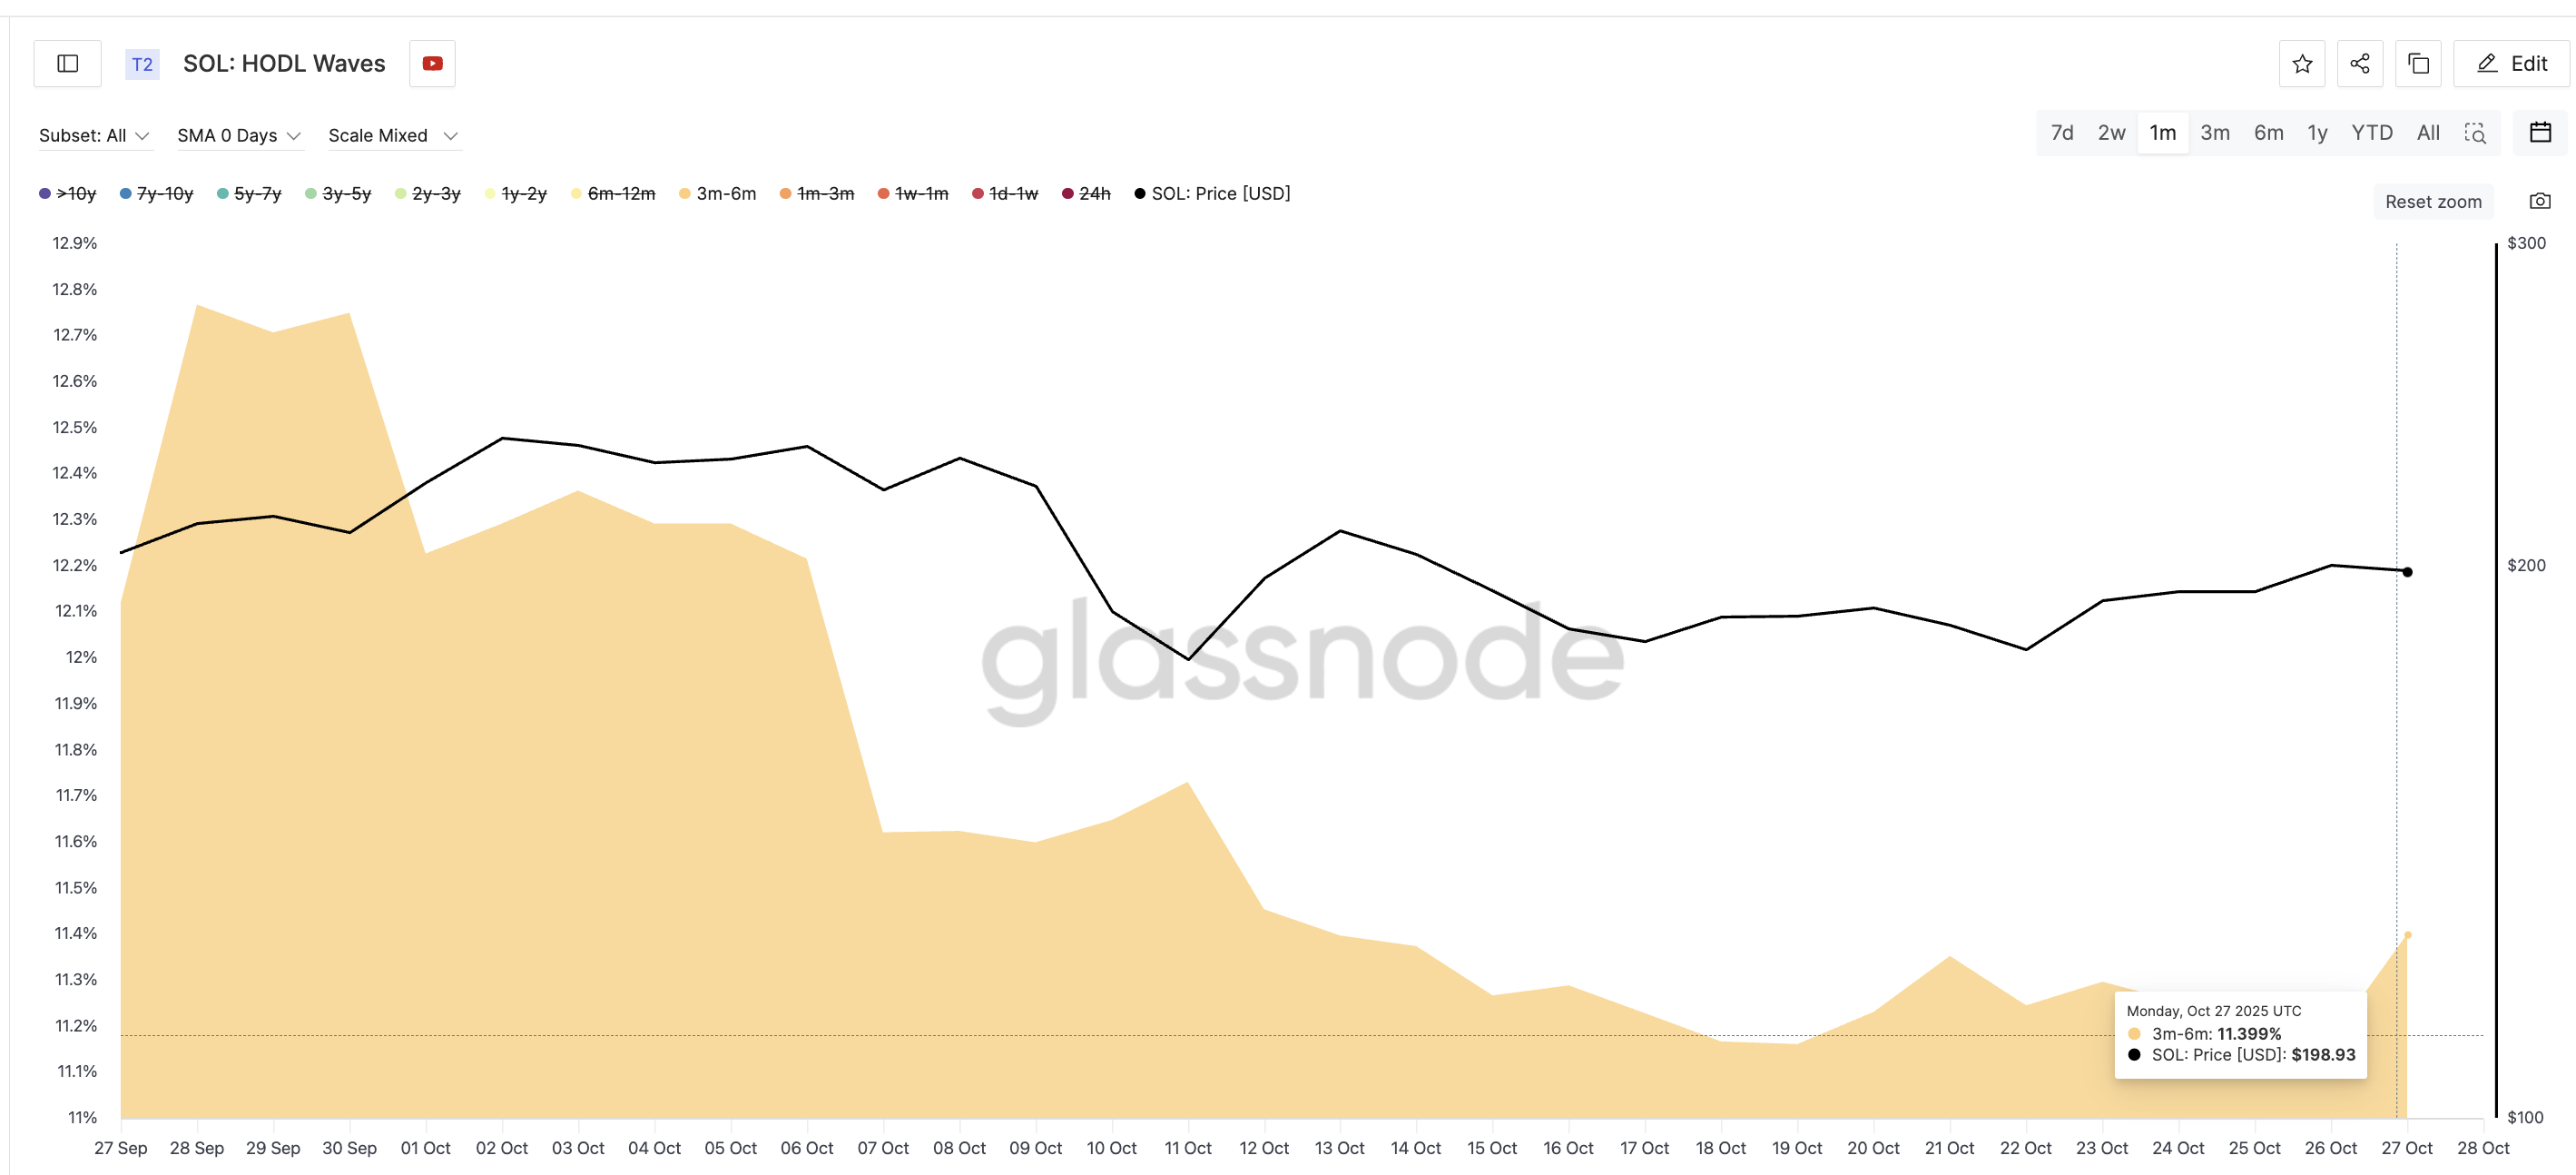
The same pattern appears in Solana’s HODL waves. It is a metric that tracks what share of the total supply is held by which wallet cohort (time-based).
Mid-term holders (3–6 months) have reduced their share from 12.76% of total supply on September 28 to 11.39% as of October 27. That’s a 10.7% decline in their ownership share over one month. This shows that this group is gradually exiting while the market remains flat.
Together, these metrics suggest that Solana’s long-term conviction is cooling despite the ETF buzz. The wallets that helped stabilize earlier dips are now easing out, leaving the price more exposed to short-term sentiment swings.
Leverage Builds Despite Bearish Signs
The derivatives market is sending a louder warning. It seems that traders are ignoring the bearish on-chain signs.
On Bybit alone, the long–short ratio shows that over 80% of positions are long, with about $884.15 million in long leverage compared to $288.42 million in short exposure.
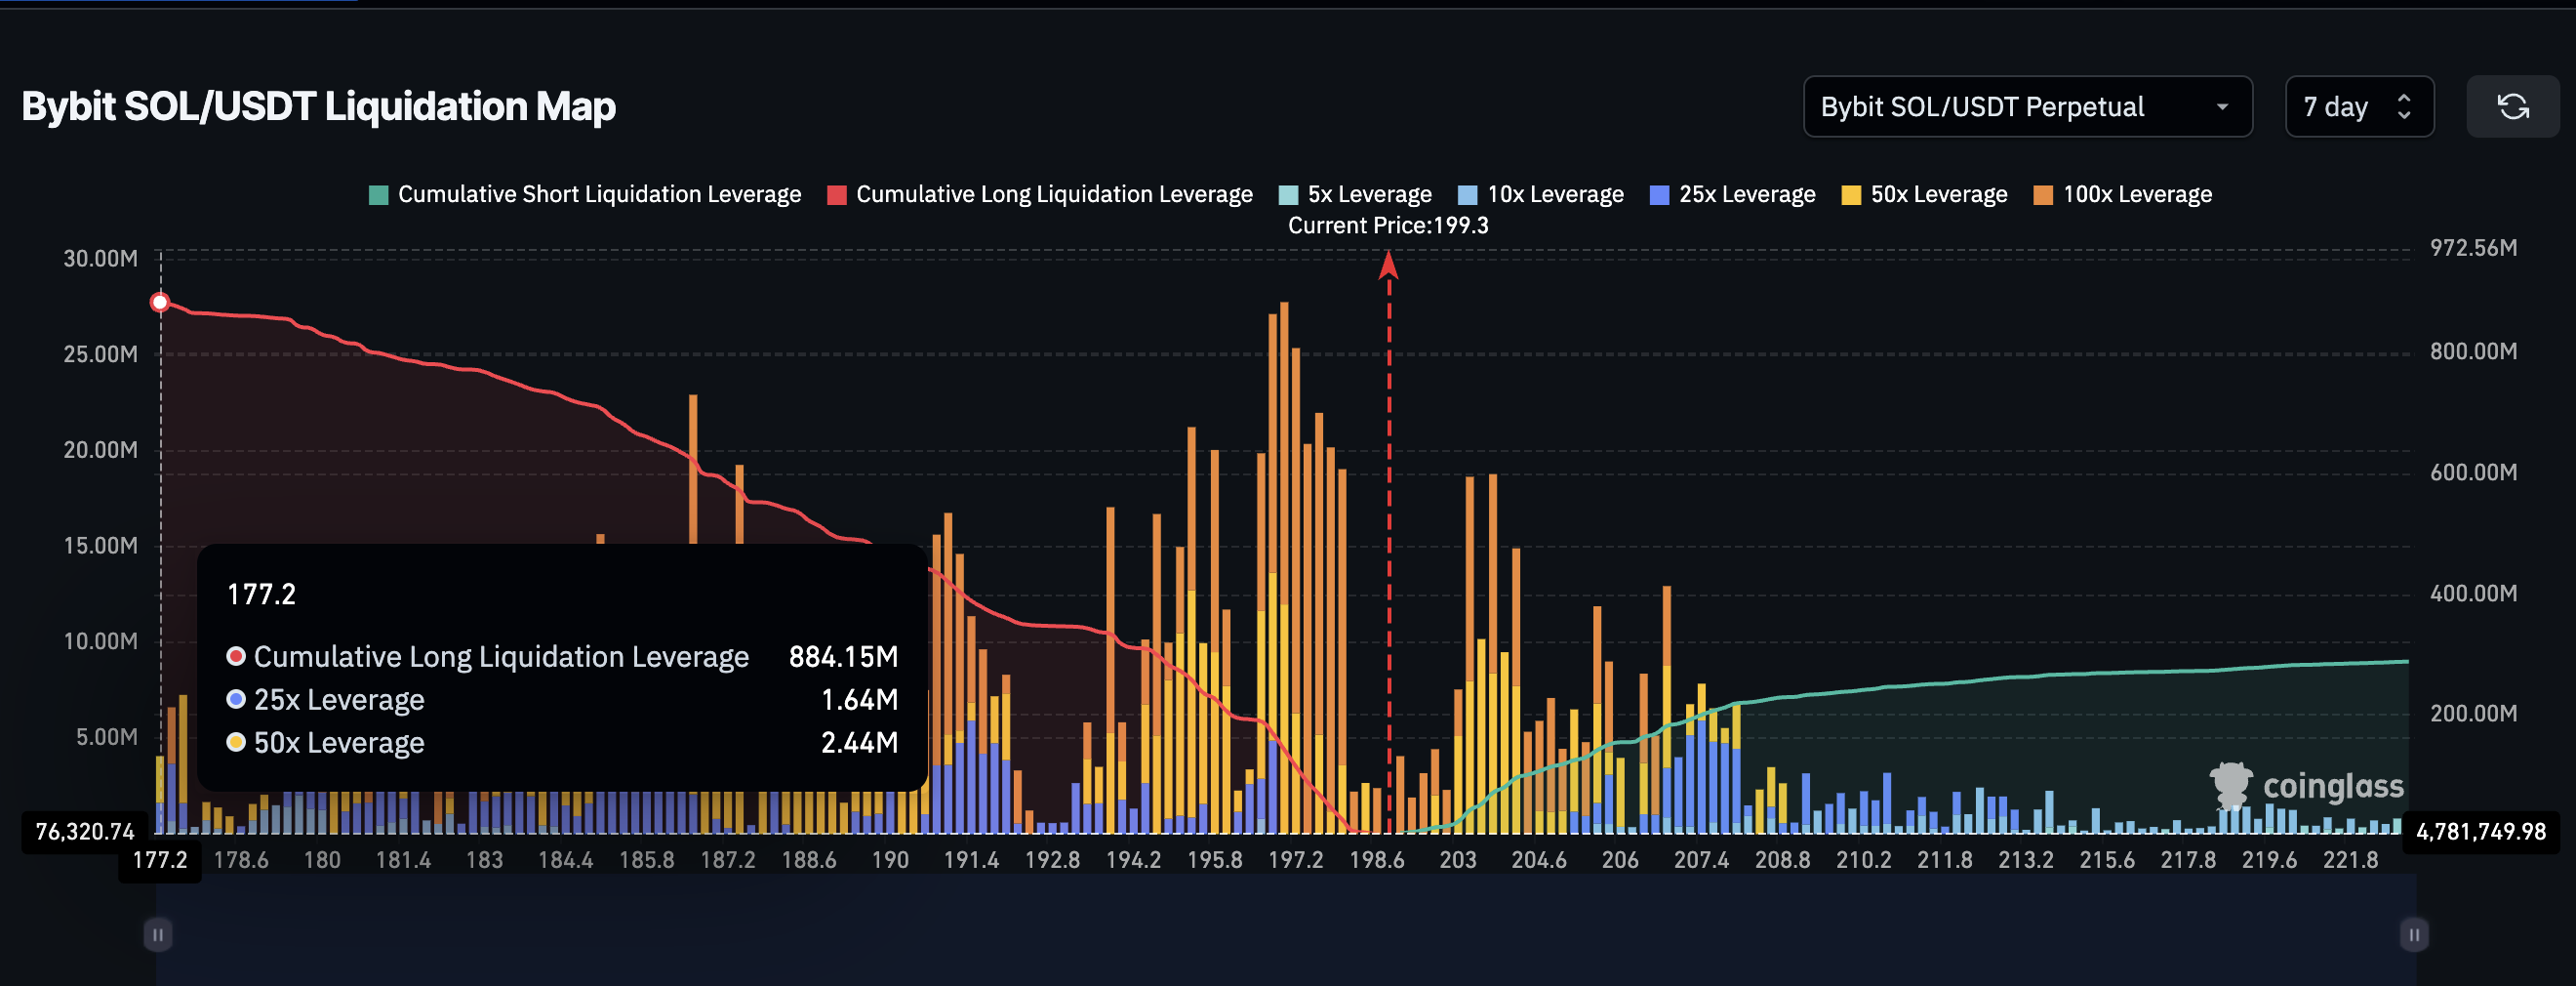
This imbalance is risky because if SOL prices fall, leveraged longs are forced to sell to cover losses — a “long squeeze.”
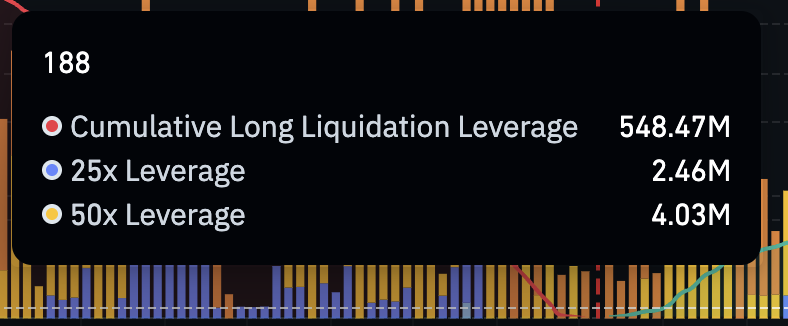
The danger zone sits around $188, where a cascade could erase up to $548 million in leveraged positions. That line overlaps with Solana’s key support level. Probably the most important one between a bounce and a crash.
So even though traders are betting on a rebound, this excessive optimism could quickly flip against them if the bearish chart setup plays out.
Pattern And Divergence Signal Trouble For The Solana Price
Solana’s daily chart shows a rising broadening wedge, a bearish pattern that widens as volatility expands. Since October 26, the price has struggled to stay above $201, facing repeated rejections.
At the same time, the Relative Strength Index (RSI), which measures buying versus selling strength, has made higher highs. This happened when the SOL price made lower highs between October 13 and 26. This is a hidden bearish divergence, suggesting that momentum is fading even as traders try to push the price higher.
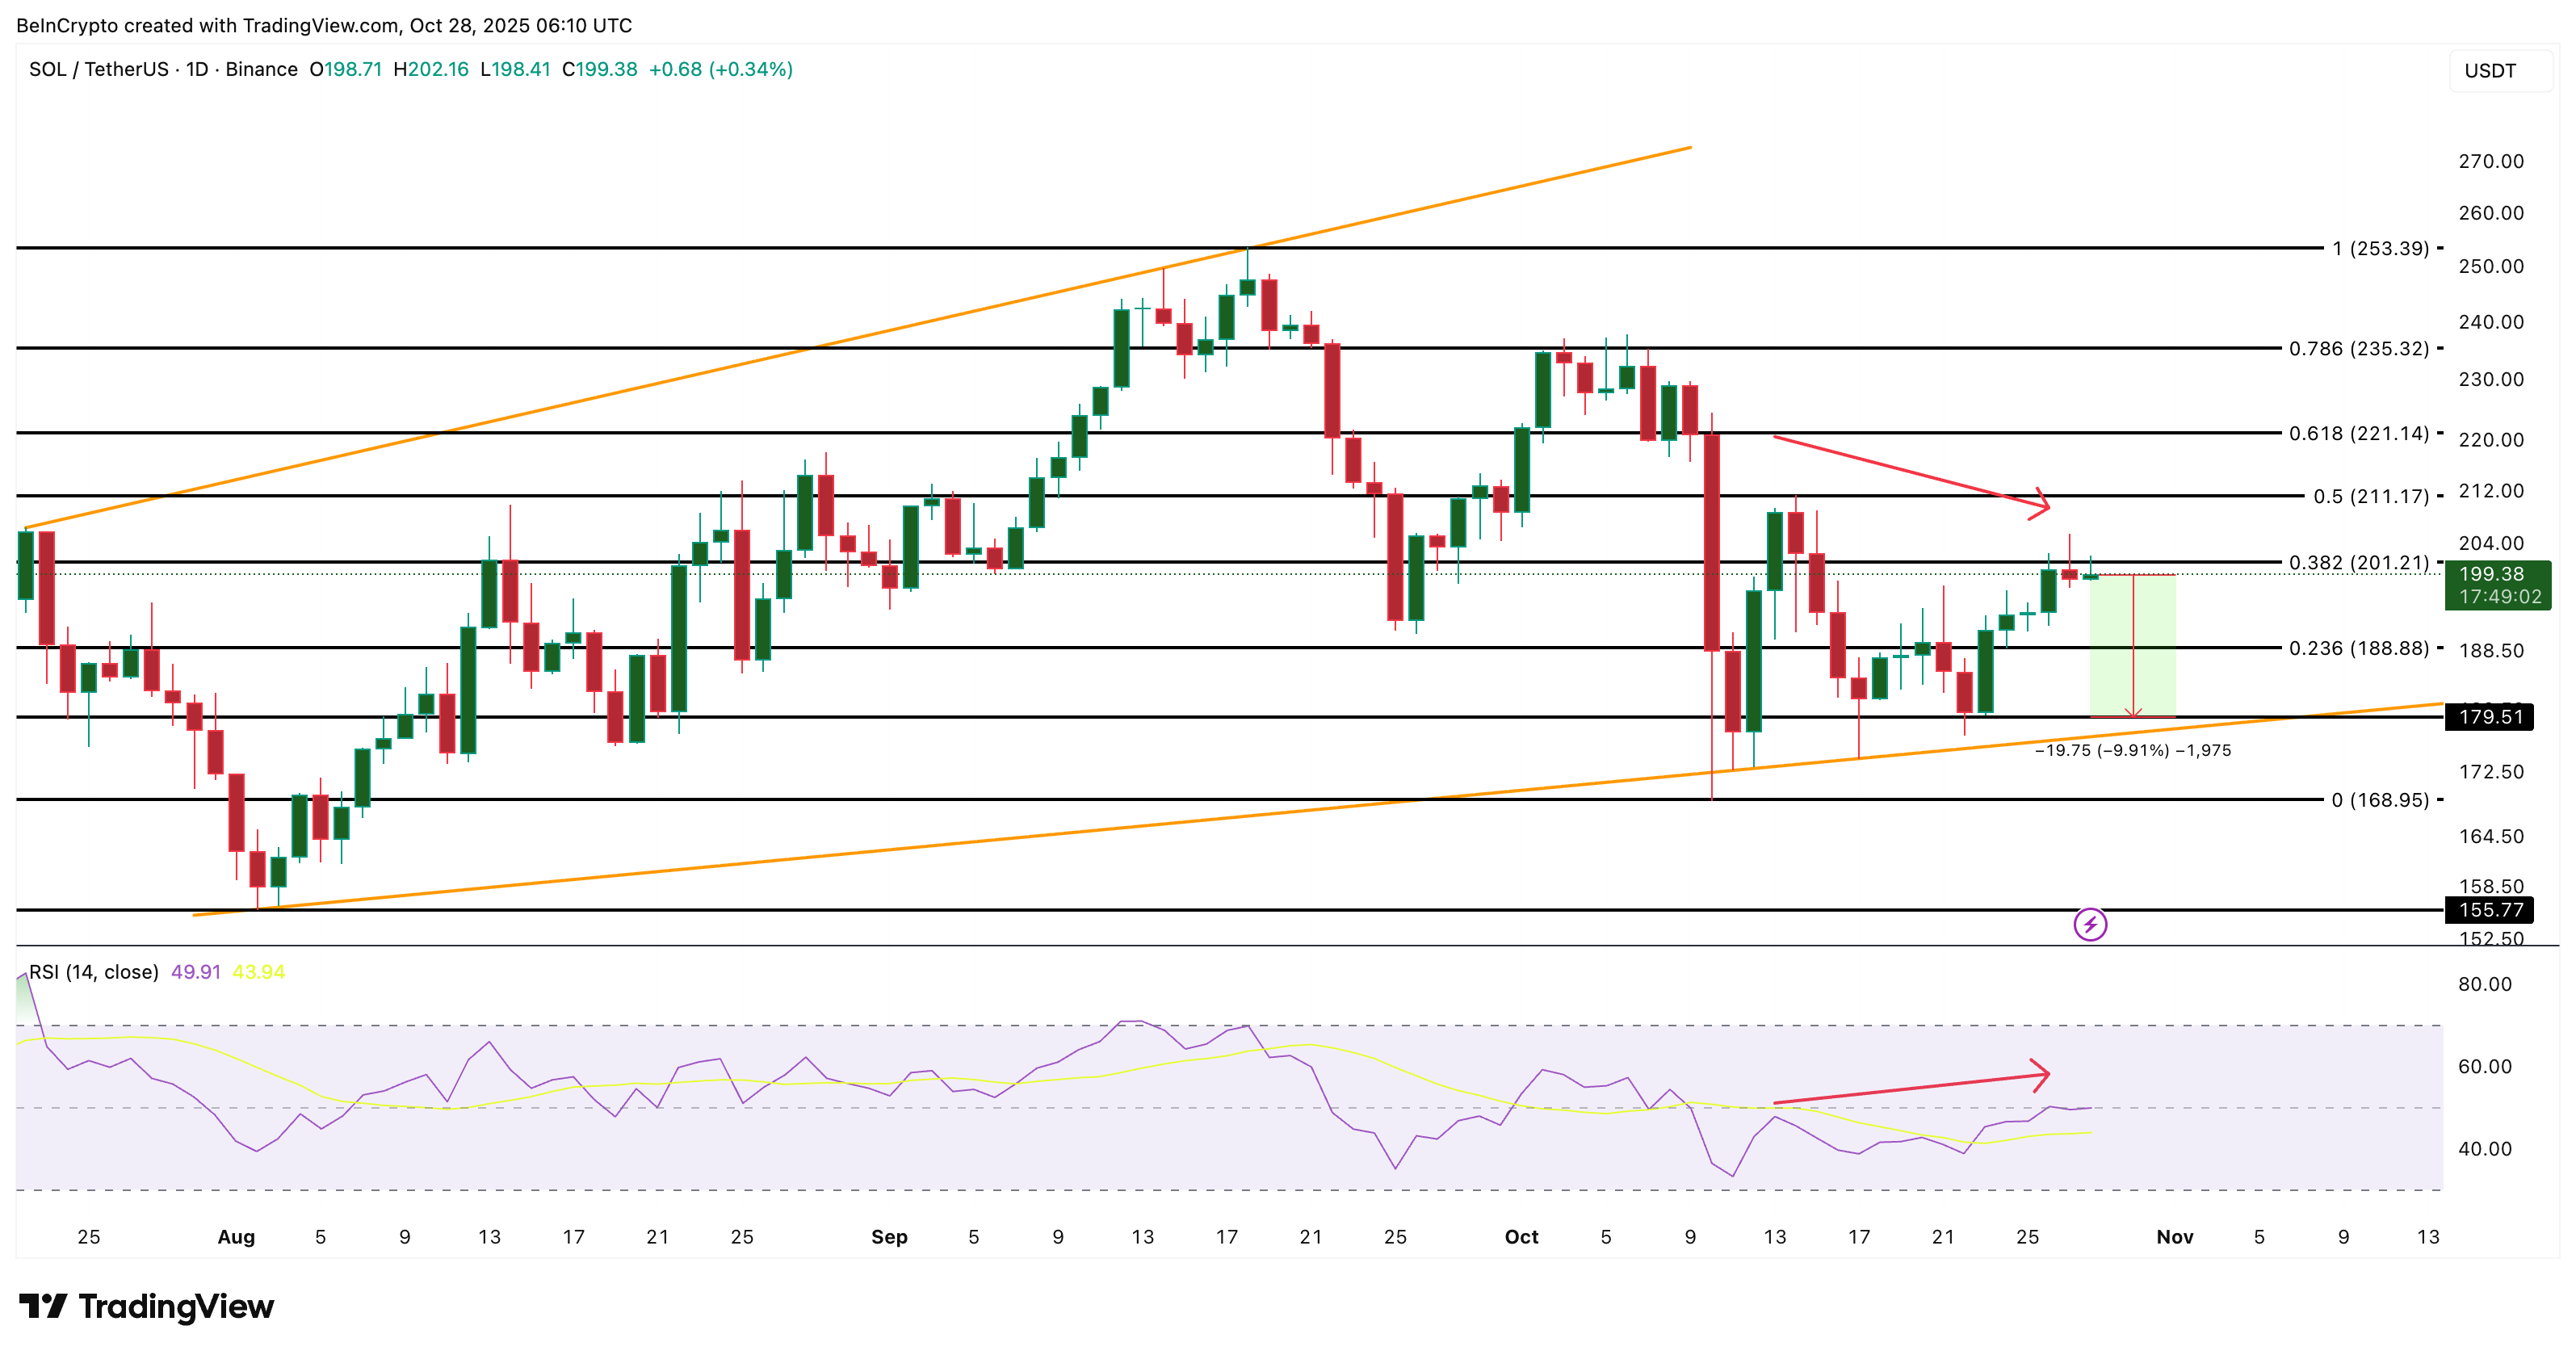
If Solana loses its $179 support (almost 10% from the current level), a daily close below this level could send it toward $168. That would possibly trigger virtually all the longs, as mentioned earlier. However, the first key level here is $188, as even that would liquidate almost 548 million worth of longs.
If panic sets in, a deeper decline could test $155. On the other hand, only a daily close above $235 would invalidate the bearish structure and restore bullish confidence.
