
A few days ago, the buzz around a Solana (SOL) ETF application filed by VanEck caused the price to increase by 10% within a short period. Later on, investment firm 21Shares joined the race, but the token could not hold on to the initial hike.
However, some analysts stuck to their bullish predictions. But Solana’s short-term outlook may not bring out those forecasts.
Bullish Momentum Folds
At press time, SOL remains range-bound between $132 and $143. In the last 24 hours, the price has decreased by 7.46% due to widespread sell-offs in the market.
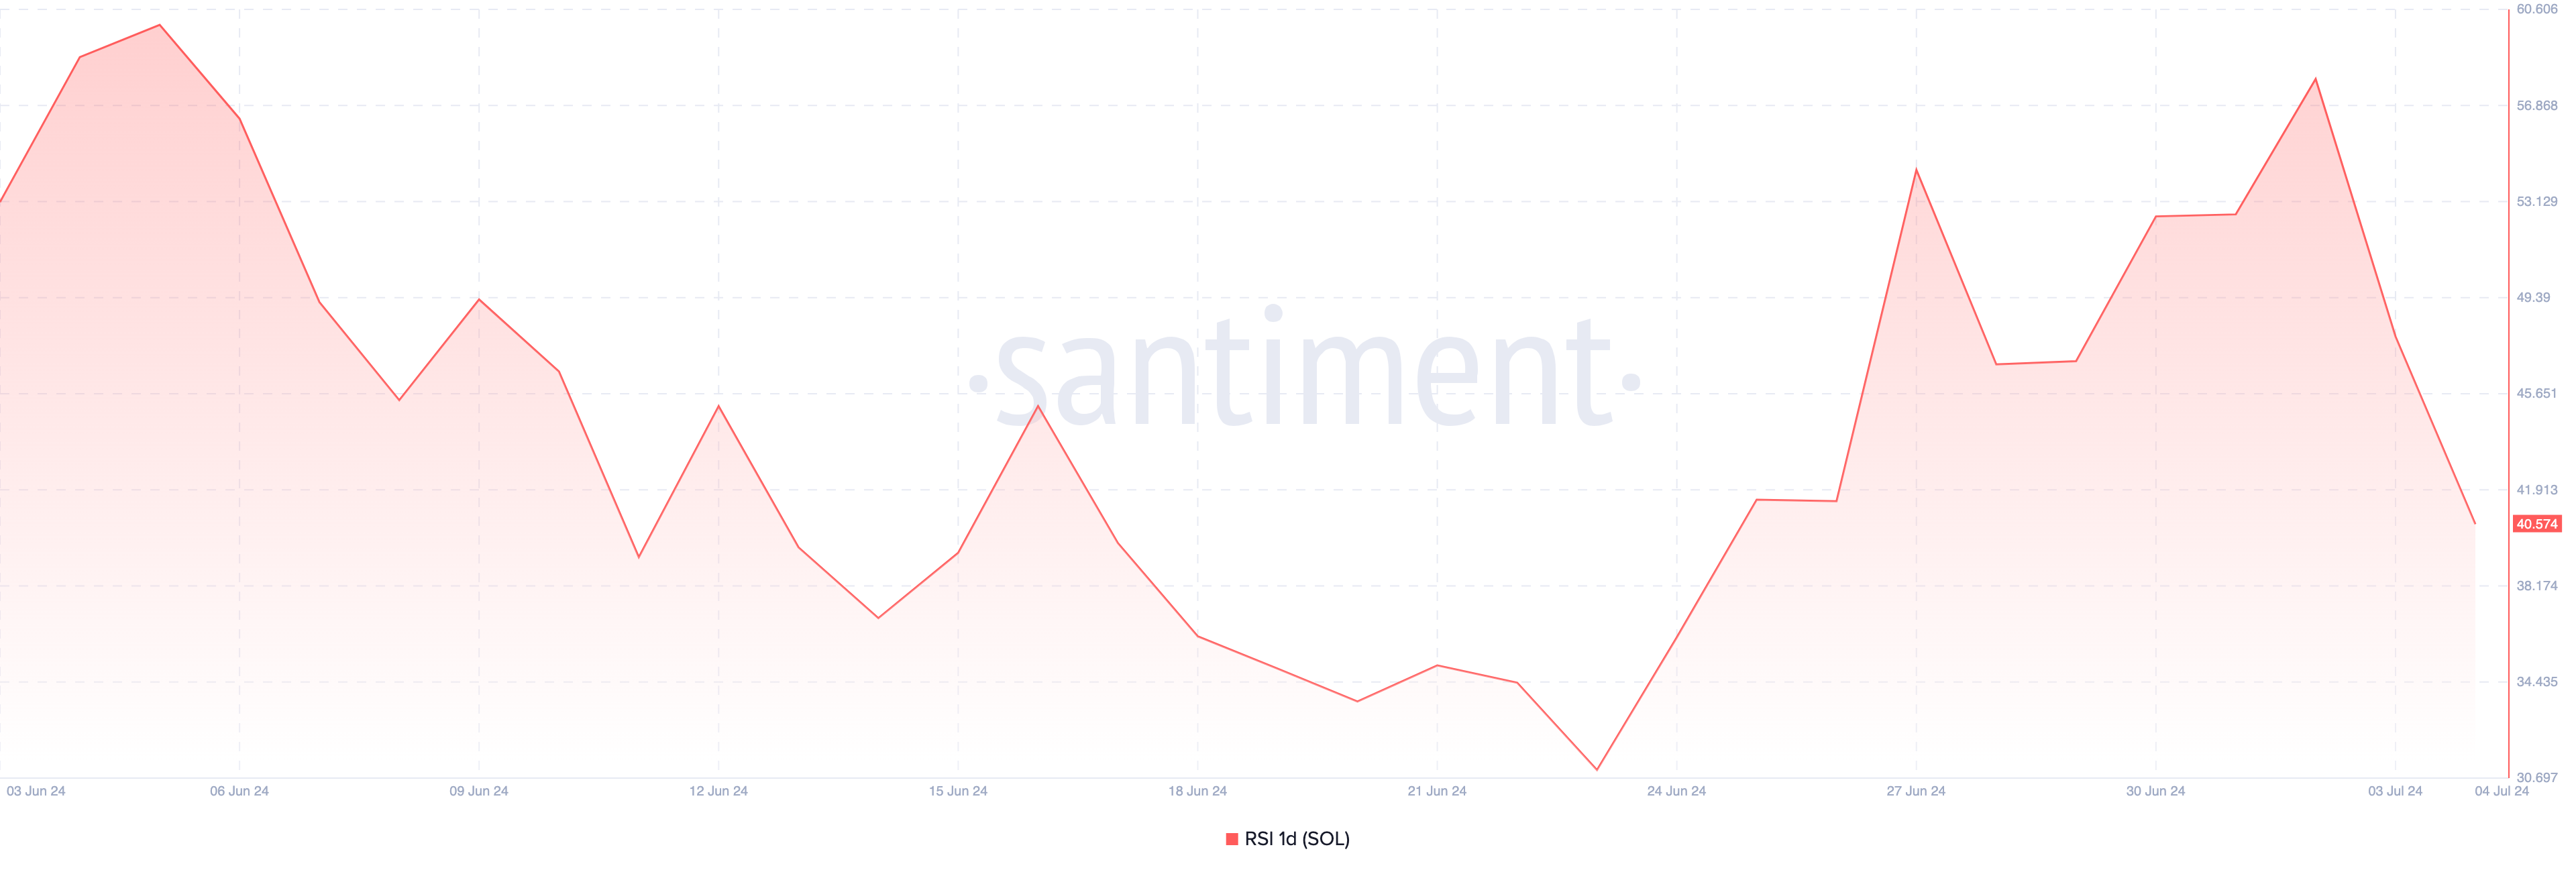
According to the daily chart, the Relative Strength Index (RSI) stands at 40.57. The RSI measures momentum using the extent of price changes and indicates whether an asset is overbought or oversold.
When the value drops below the 50.00 neutral region, momentum is bearish. A rise above the midpoint indicates bullish momentum. Therefore, SOL is in a bearish phase. If unchecked, the momentum may weaken, leading to a lower price.
Read More: Solana vs. Ethereum: An Ultimate Comparison
However, on June 28, crypto trading firm GSR shared its prediction for the token if the Solana ETF gets approved.
In analyzing the potential, GSR considered the bear, baseline, and bullish phases. It also added that a spot Solana ETF could record 2%, 5%, and 14% of Bitcoin inflows for each phase above.
Based on this prediction, the price of SOL may reach $1,192 in the long term. Previously, BeInCrypto reported that the development led to increased buying pressure on the spot market.
SOL Price Prediction: Token Stuck in Wait-and-See Mode
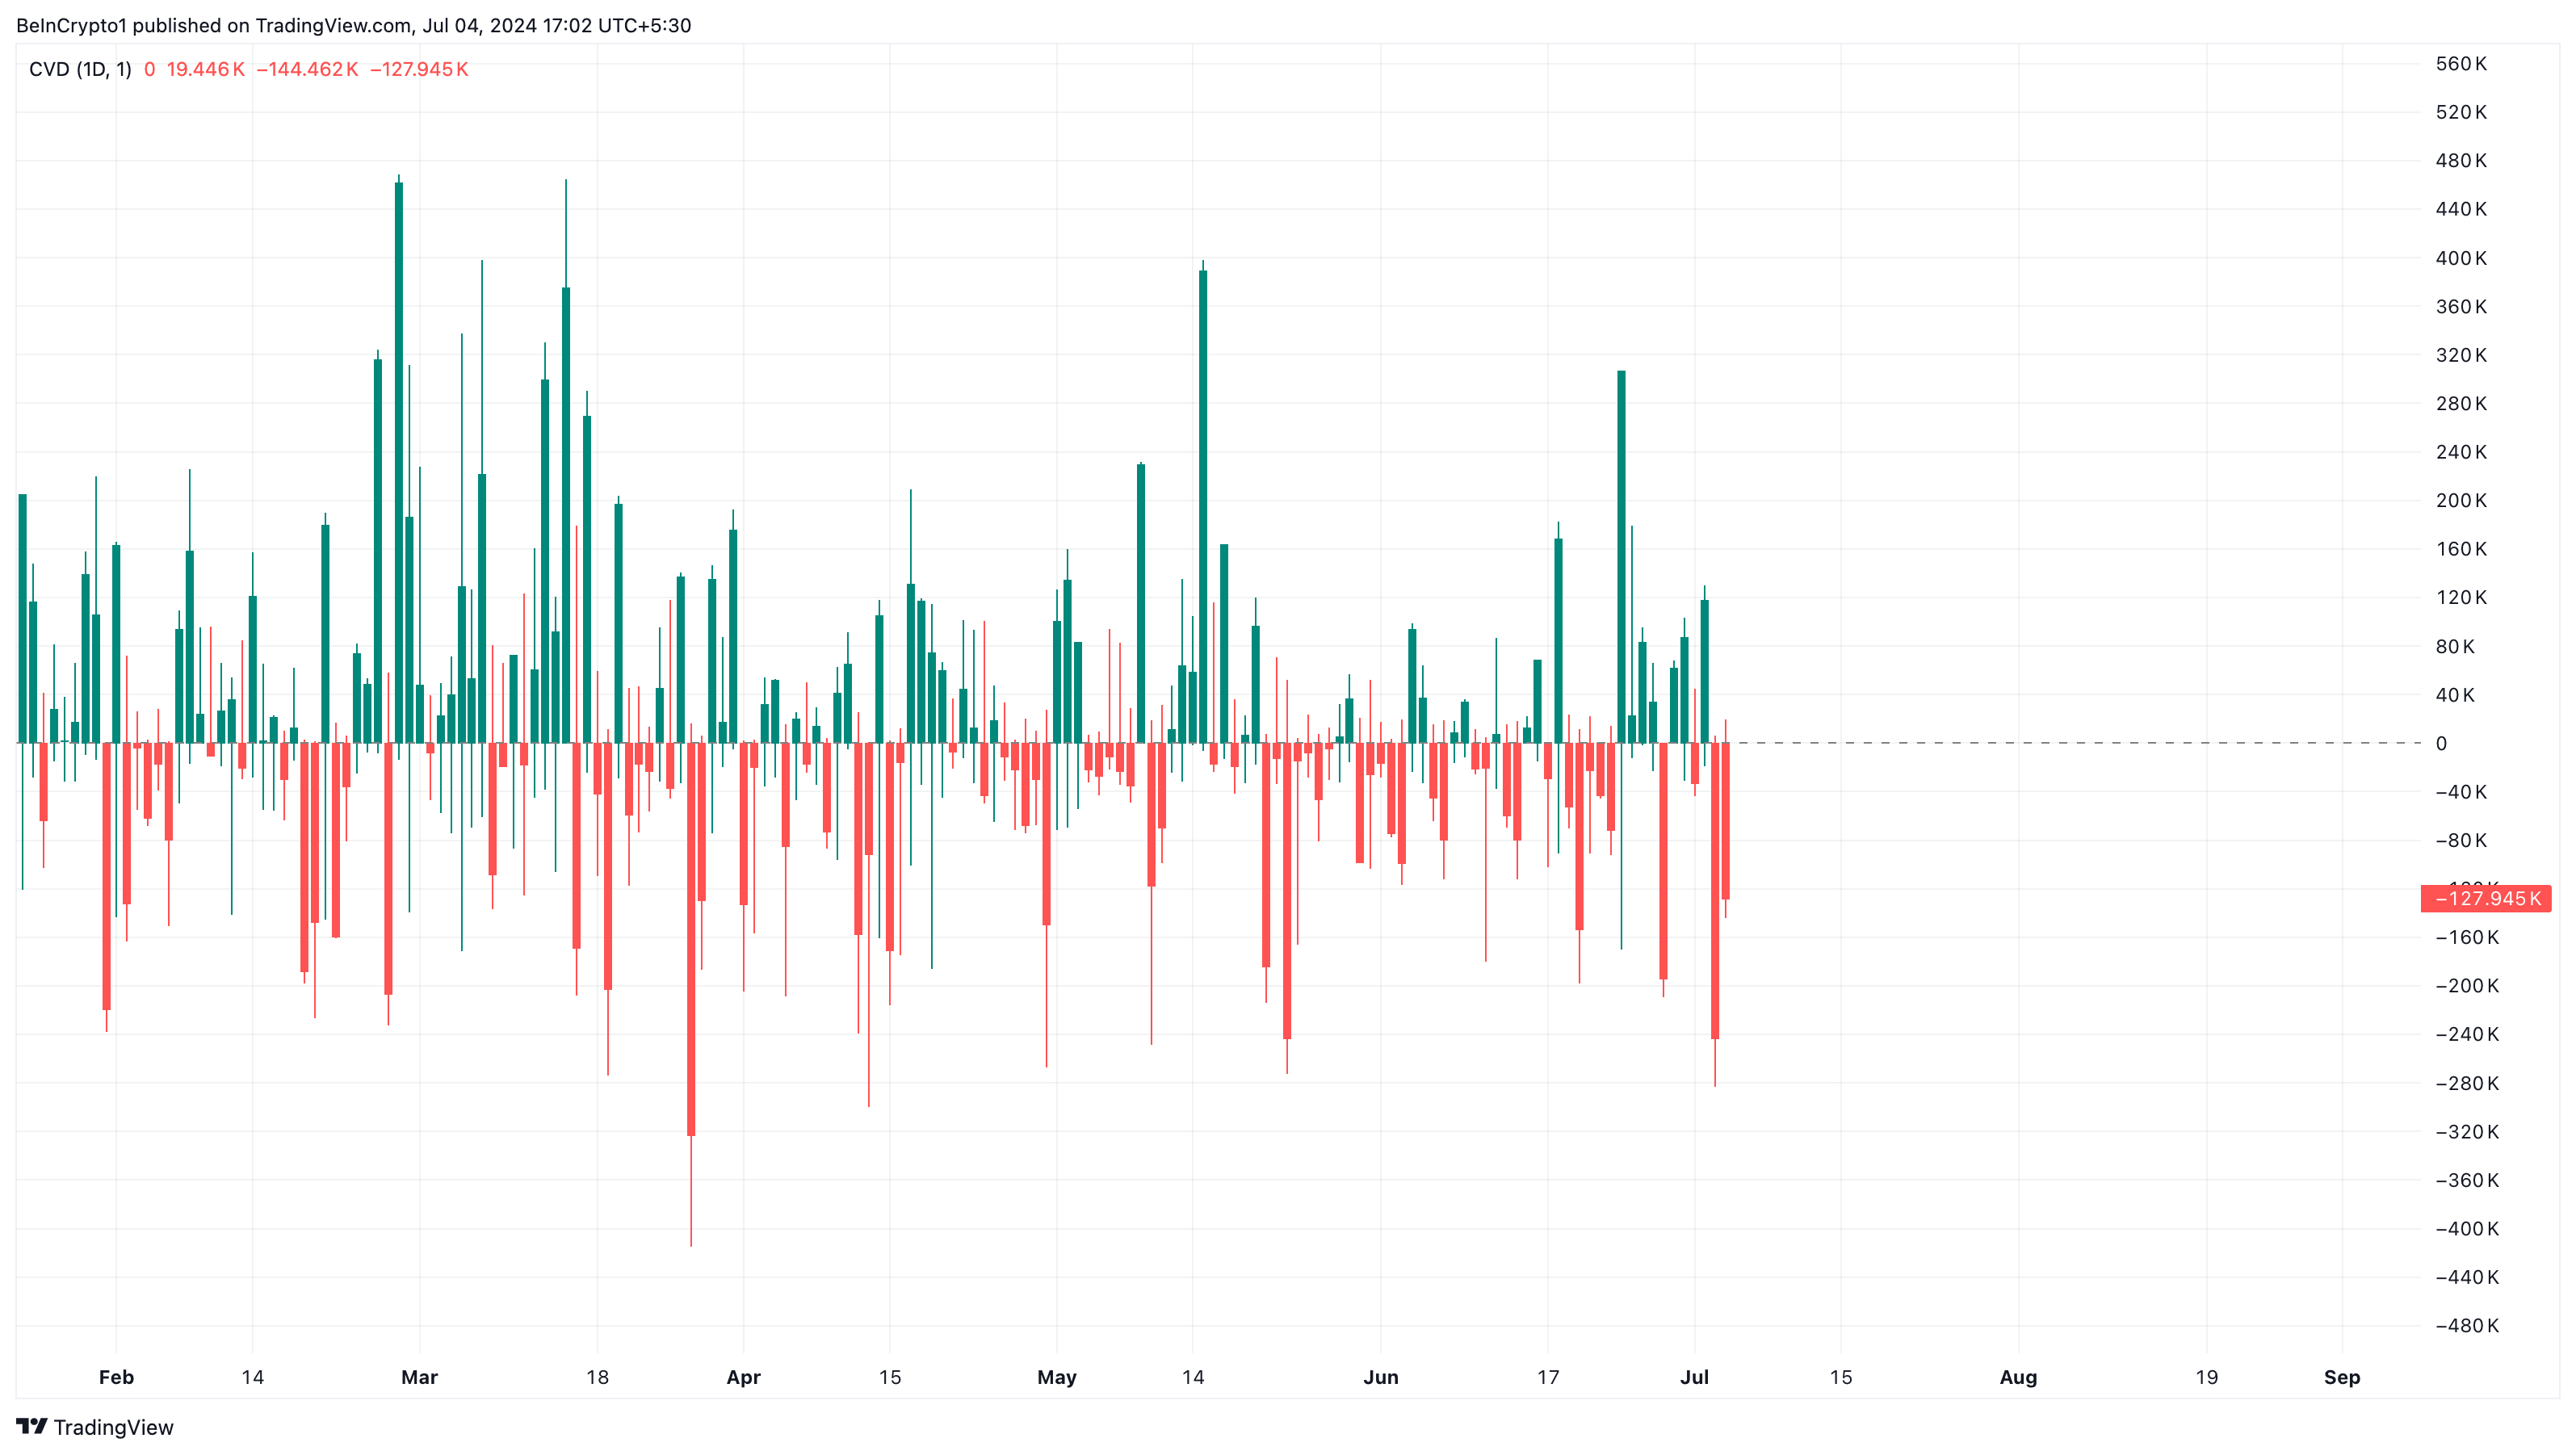
As of this writing, the Cumulative Volume Delta (CVD) shows otherwise. The CVD shows the difference between buying and selling volume in the market.
If the net difference is positive, it indicates more buying than selling. However, a net negative suggests market participants sell more than they accumulate.
According to Solana’s daily chart, the CVD is -127.945, indicating that more than 127,000 tokens have been sold compared to those that have been bought.
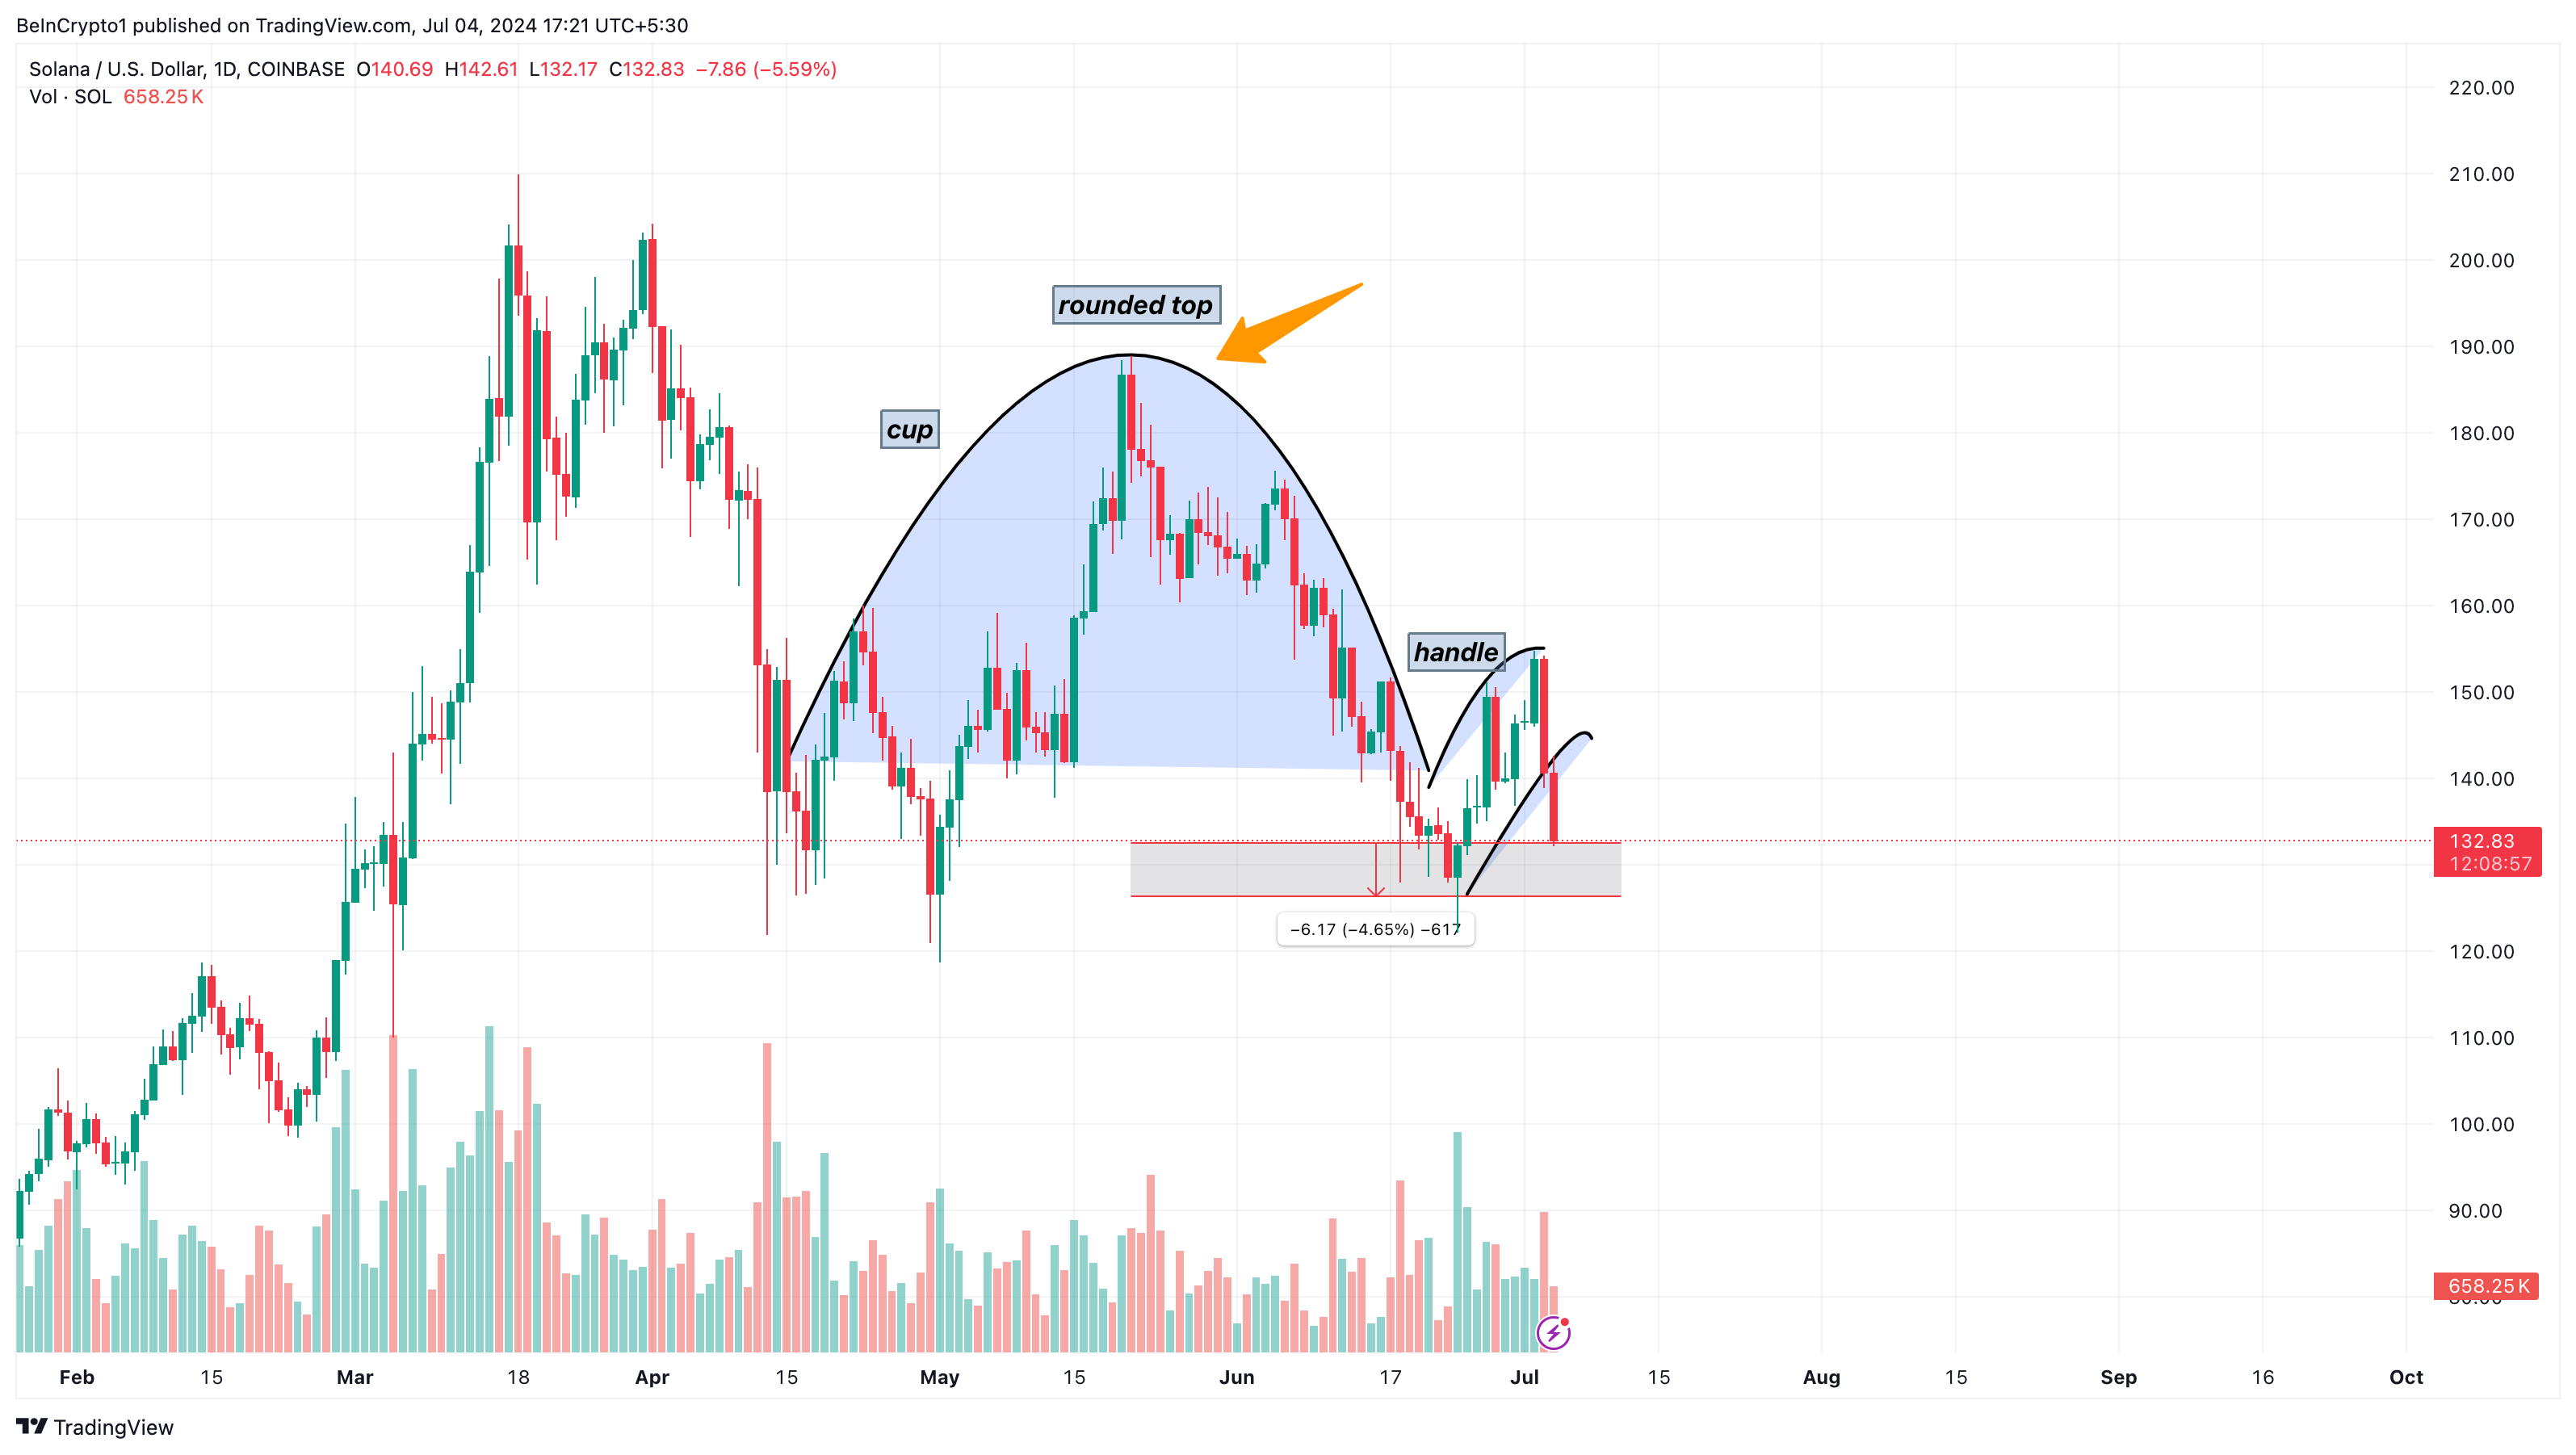
Furthermore, on the same chart, we observed that SOL formed a rounding top combined with an inverted cup and handle. This rounding top pattern appears when the price has hit a high point and is now pronounced toward the downtrend.
The inverted cup and handle signal a bearish continuation. Based on the formation of this pattern, the price of SOL may face a 4.65% decline, which would take it to $126.94.
Read More: Solana (SOL) Price Prediction 2024/2025/2030
However, this prediction will be invalidated if buying pressure increases or if the token gets oversold. Should this be the case, SOL may reverse and attempt to revisit $145.25.
Meanwhile, a recent paper published by Galaxy Research mentioned that the U.S. SEC may not approve the Solana ETFs.
Authored by Alex Thorn, Charles Yu, and Christine Kim, the digital assets research institution mentioned the absence of a futures Solana ETF and past labeling of the token as security as hindrances.
