
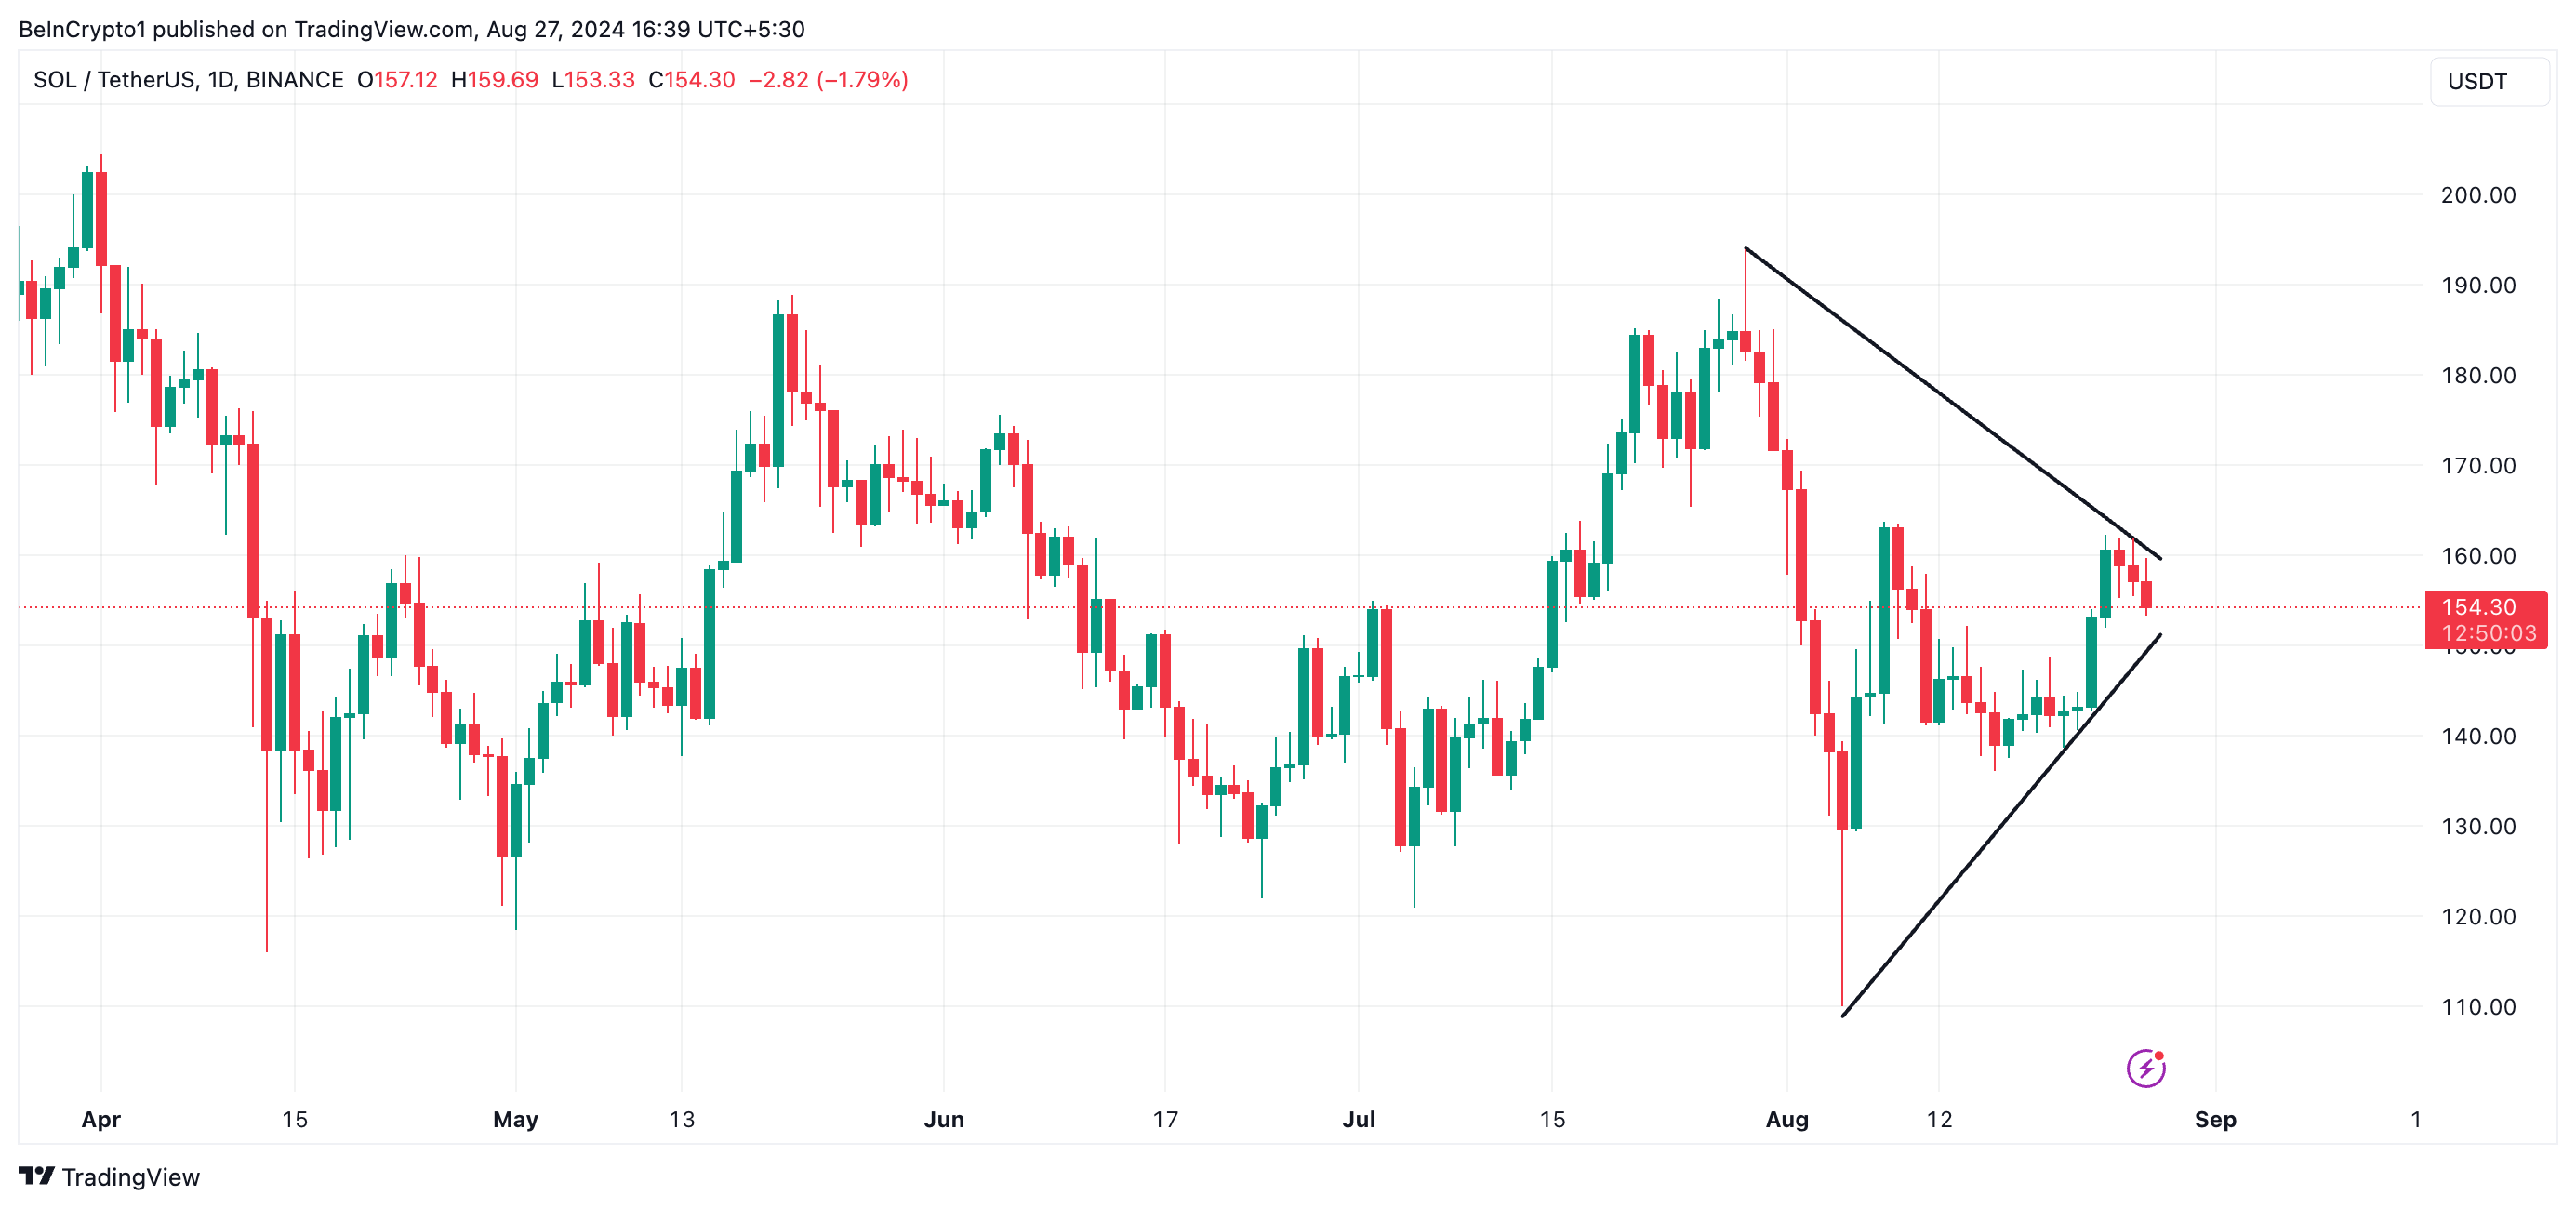
Solana’s (SOL) price has climbed 5% over the past week, moving closer to the upper line of its symmetrical triangle. A successful breakout above this line could signal the start of a bullish trend.
The technical setup on the one-day chart suggests this scenario is possible.
Solana Attempts to Initiate a Bullish Trend
SOL began trading within the symmetrical triangle pattern on July 29. This pattern forms when an asset’s price moves between two converging lines, indicating a period of market consolidation where buyers and sellers compete for control.
A breakout above the triangle’s upper line signals that buyers have taken the lead. As buying pressure increases, the asset’s price typically continues to rise, extending the uptrend.
Readings from SOL’s technical indicators suggest a potential upward breakout in the near term. For instance, the Moving Average Convergence Divergence (MACD) indicator shows the MACD line (blue) positioned above the signal line (orange) and approaching the zero line.
The MACD tracks an asset’s price trend, direction, and momentum shifts. When the MACD line is above the signal line, it indicates that buying pressure is outpacing selling, signaling strengthening bullish momentum. A rally above the zero line confirms the bullish trend, prompting traders to exit short positions and go long.
Read more: 11 Top Solana Meme Coins to Watch in August 2024
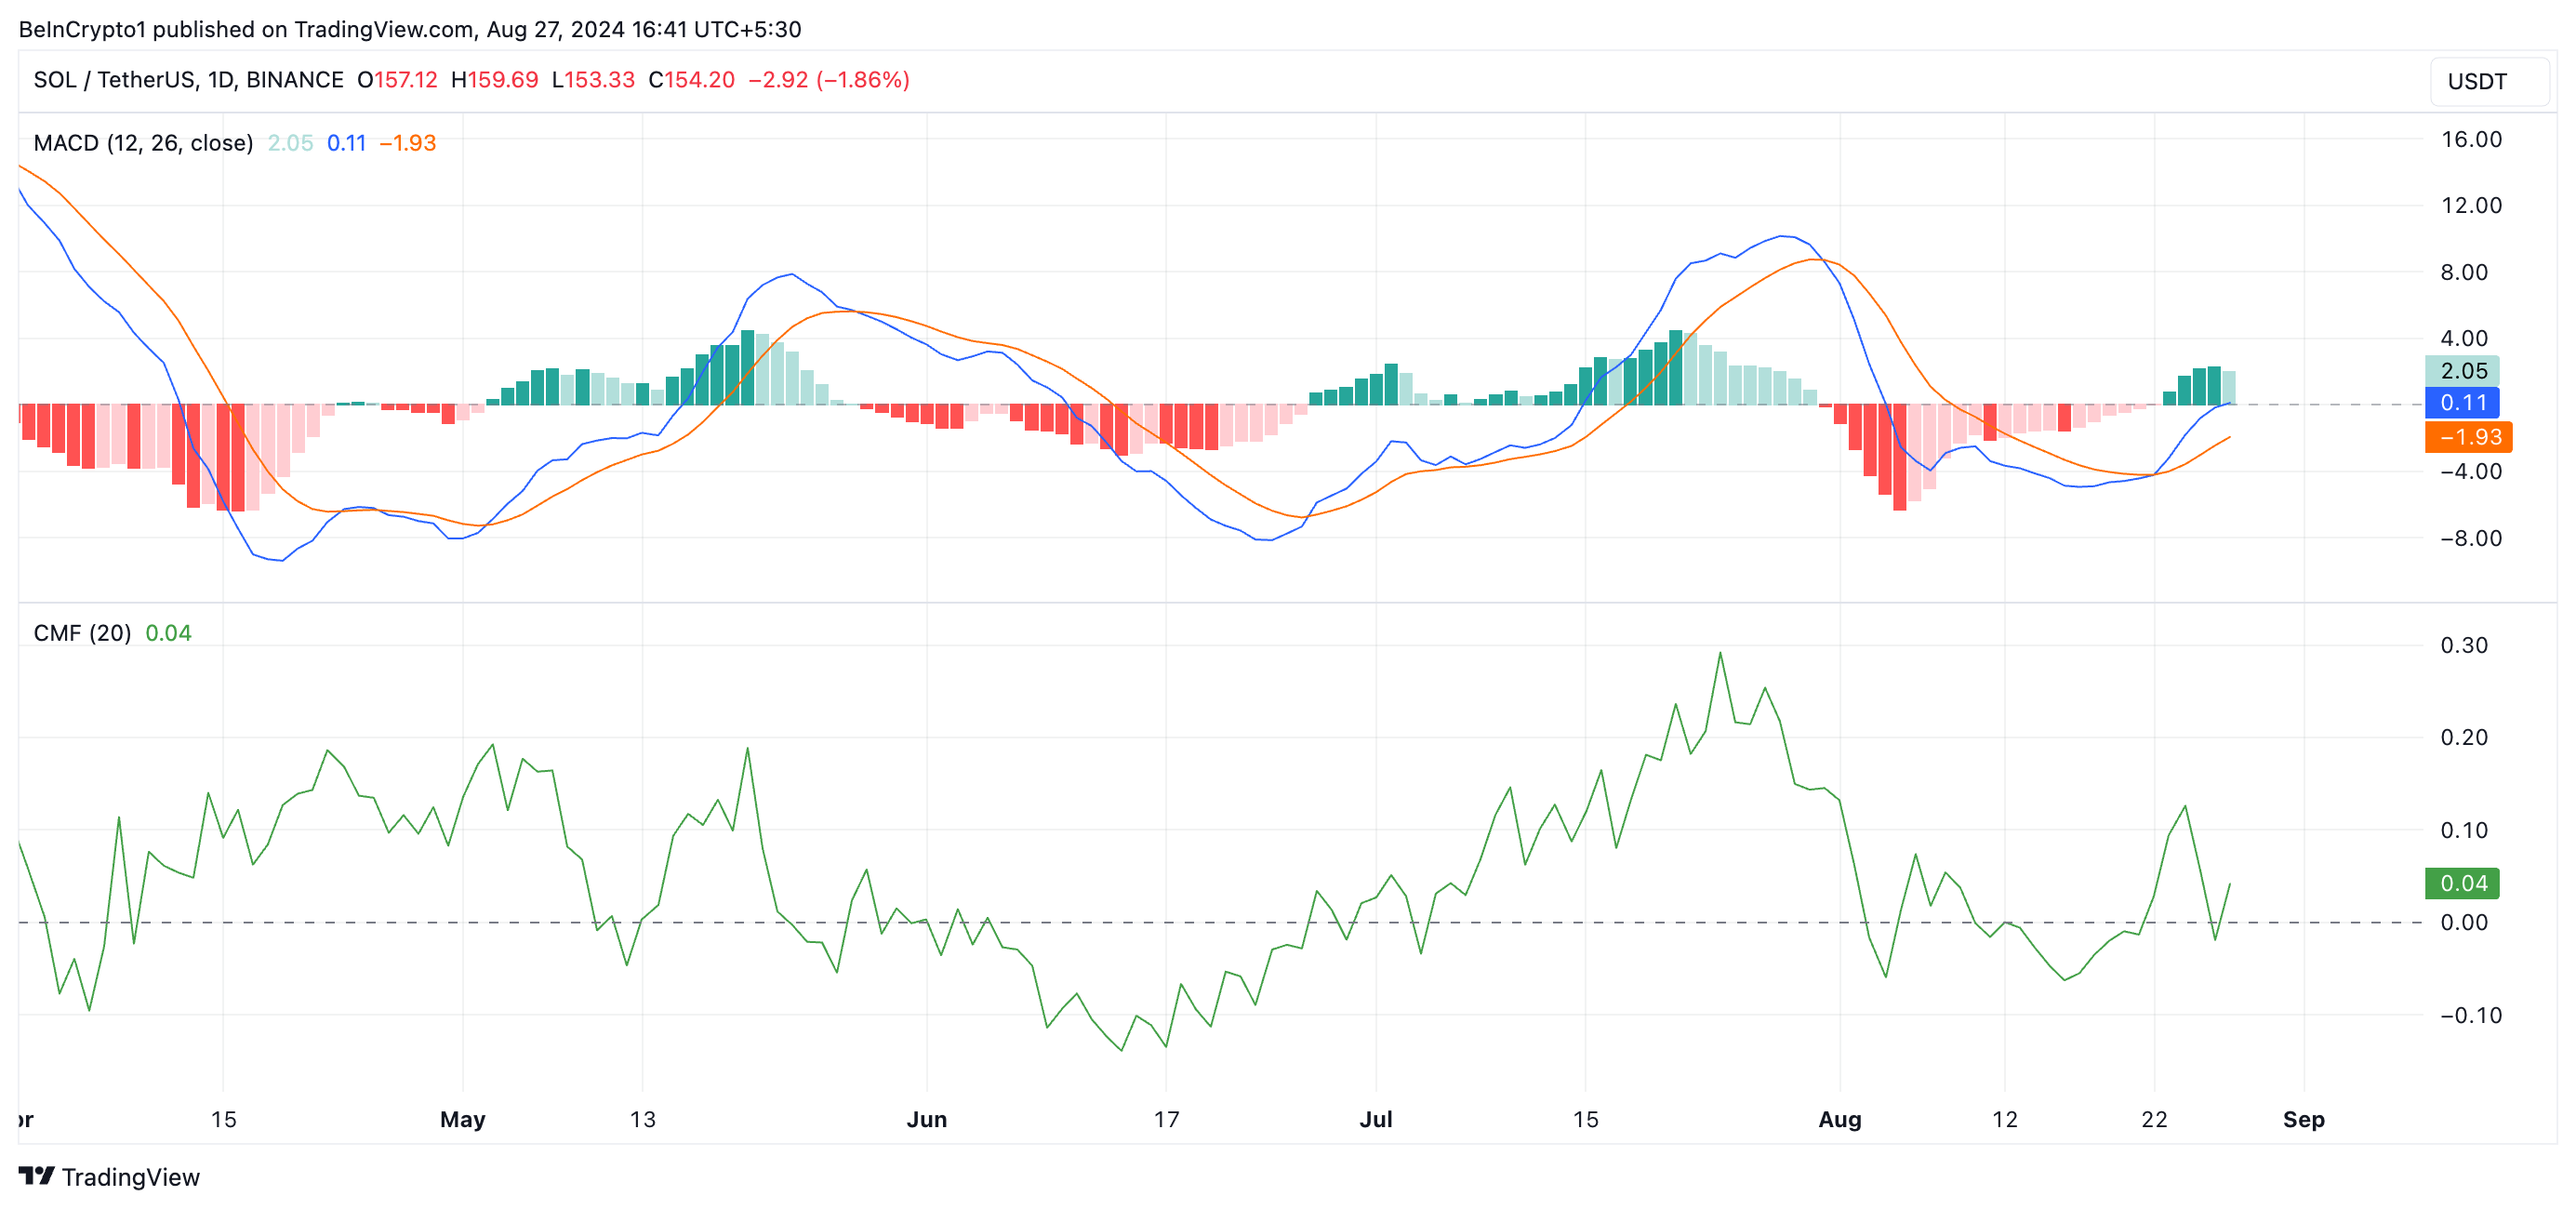
Additionally, SOL’s positive Chaikin Money Flow (CMF) reading reinforces this outlook. At press time, the CMF is above the zero line at 0.04.
The CMF measures the flow of capital into and out of an asset. A value above zero indicates strong market demand and positive liquidity inflows, both of which are crucial for sustaining a price rally.
SOL Price Prediction: 12% Price Surge Anticipated
SOL’s funding rate across cryptocurrency exchanges remains positive, indicating stronger demand for long positions in its futures market. In perpetual futures contracts, funding rates are payments exchanged between traders based on the difference between the perpetual contract price and the spot price.
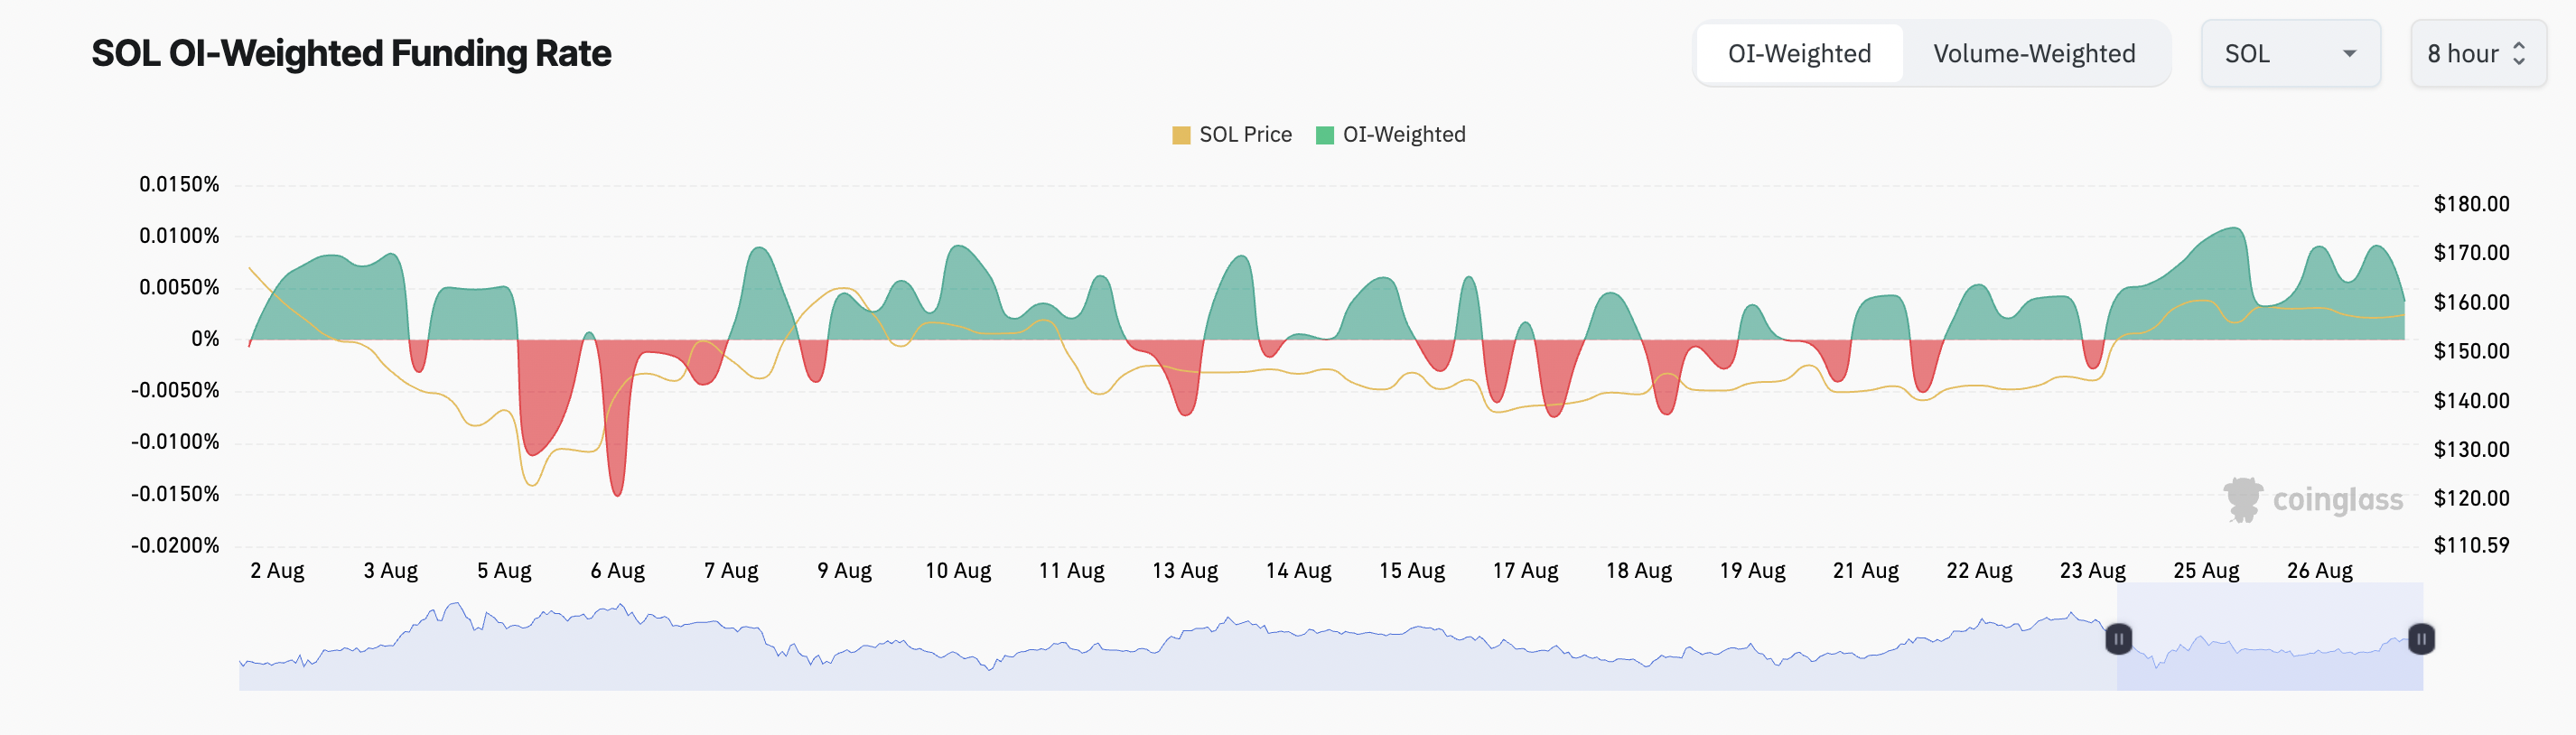
When the funding rate is positive, traders with long positions pay a fee to those holding short positions. This dynamic suggests that more traders are optimistic about SOL’s price movement, anticipating further gains and willing to maintain long positions.
If SOL successfully breaks above the upper line of the symmetrical triangle, its price could rally to $171.91, marking a 12% increase from its current value. This breakout would signal the continuation of a bullish trend, driven by increased buying pressure and positive market sentiment.
Read more: 11 Top Solana Meme Coins to Watch in August 2024
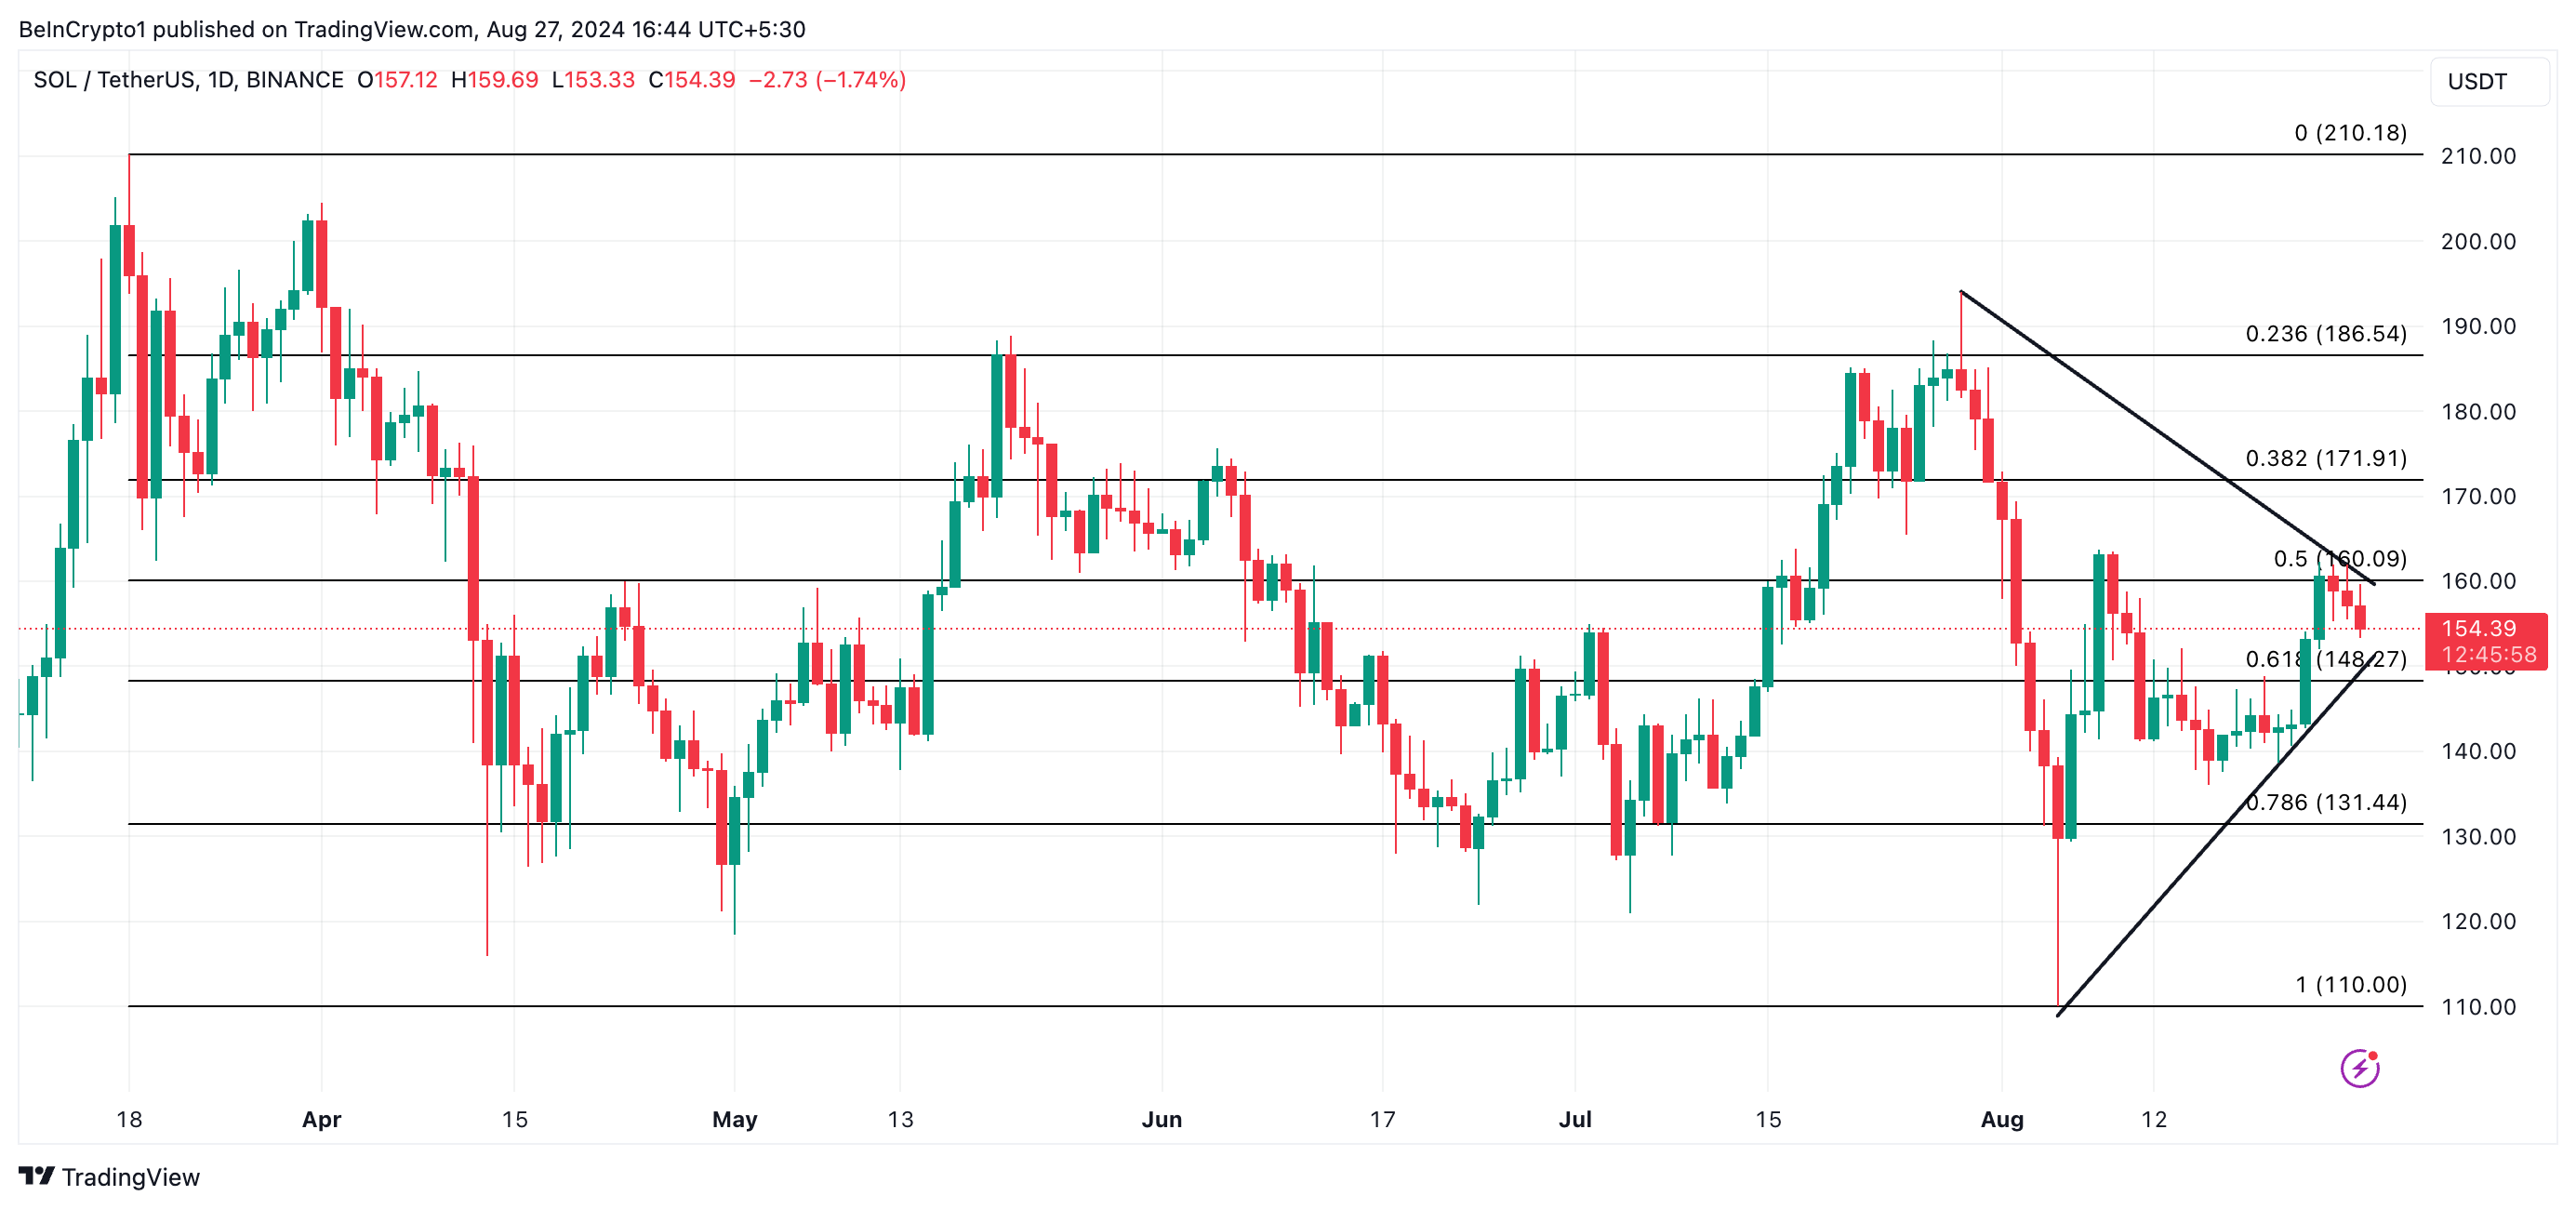
However, if the market trend turns bearish, SOL’s price could fall to the lower line of the symmetrical triangle at $148.27.
