


Despite failing to move above a crucial long-term resistance level, the Solana (SOL) price is trading inside a bullish short-term pattern.
While a breakdown from this pattern seems likely, it is uncertain how this will affect the long-term trend.
SOL Creates Lower High at Resistance
The SOL price has fallen under a long-term descending resistance line since reaching an all-time high price in November 2021. Since the line has been in place for such a long period of time, the trend can be considered bearish as long as SOL trades below it.
Currently, the line also coincides with the long-term $26 resistance level. So, its importance is solidified. More recently, the SOL price was rejected by the confluence of these levels in April (red circle).
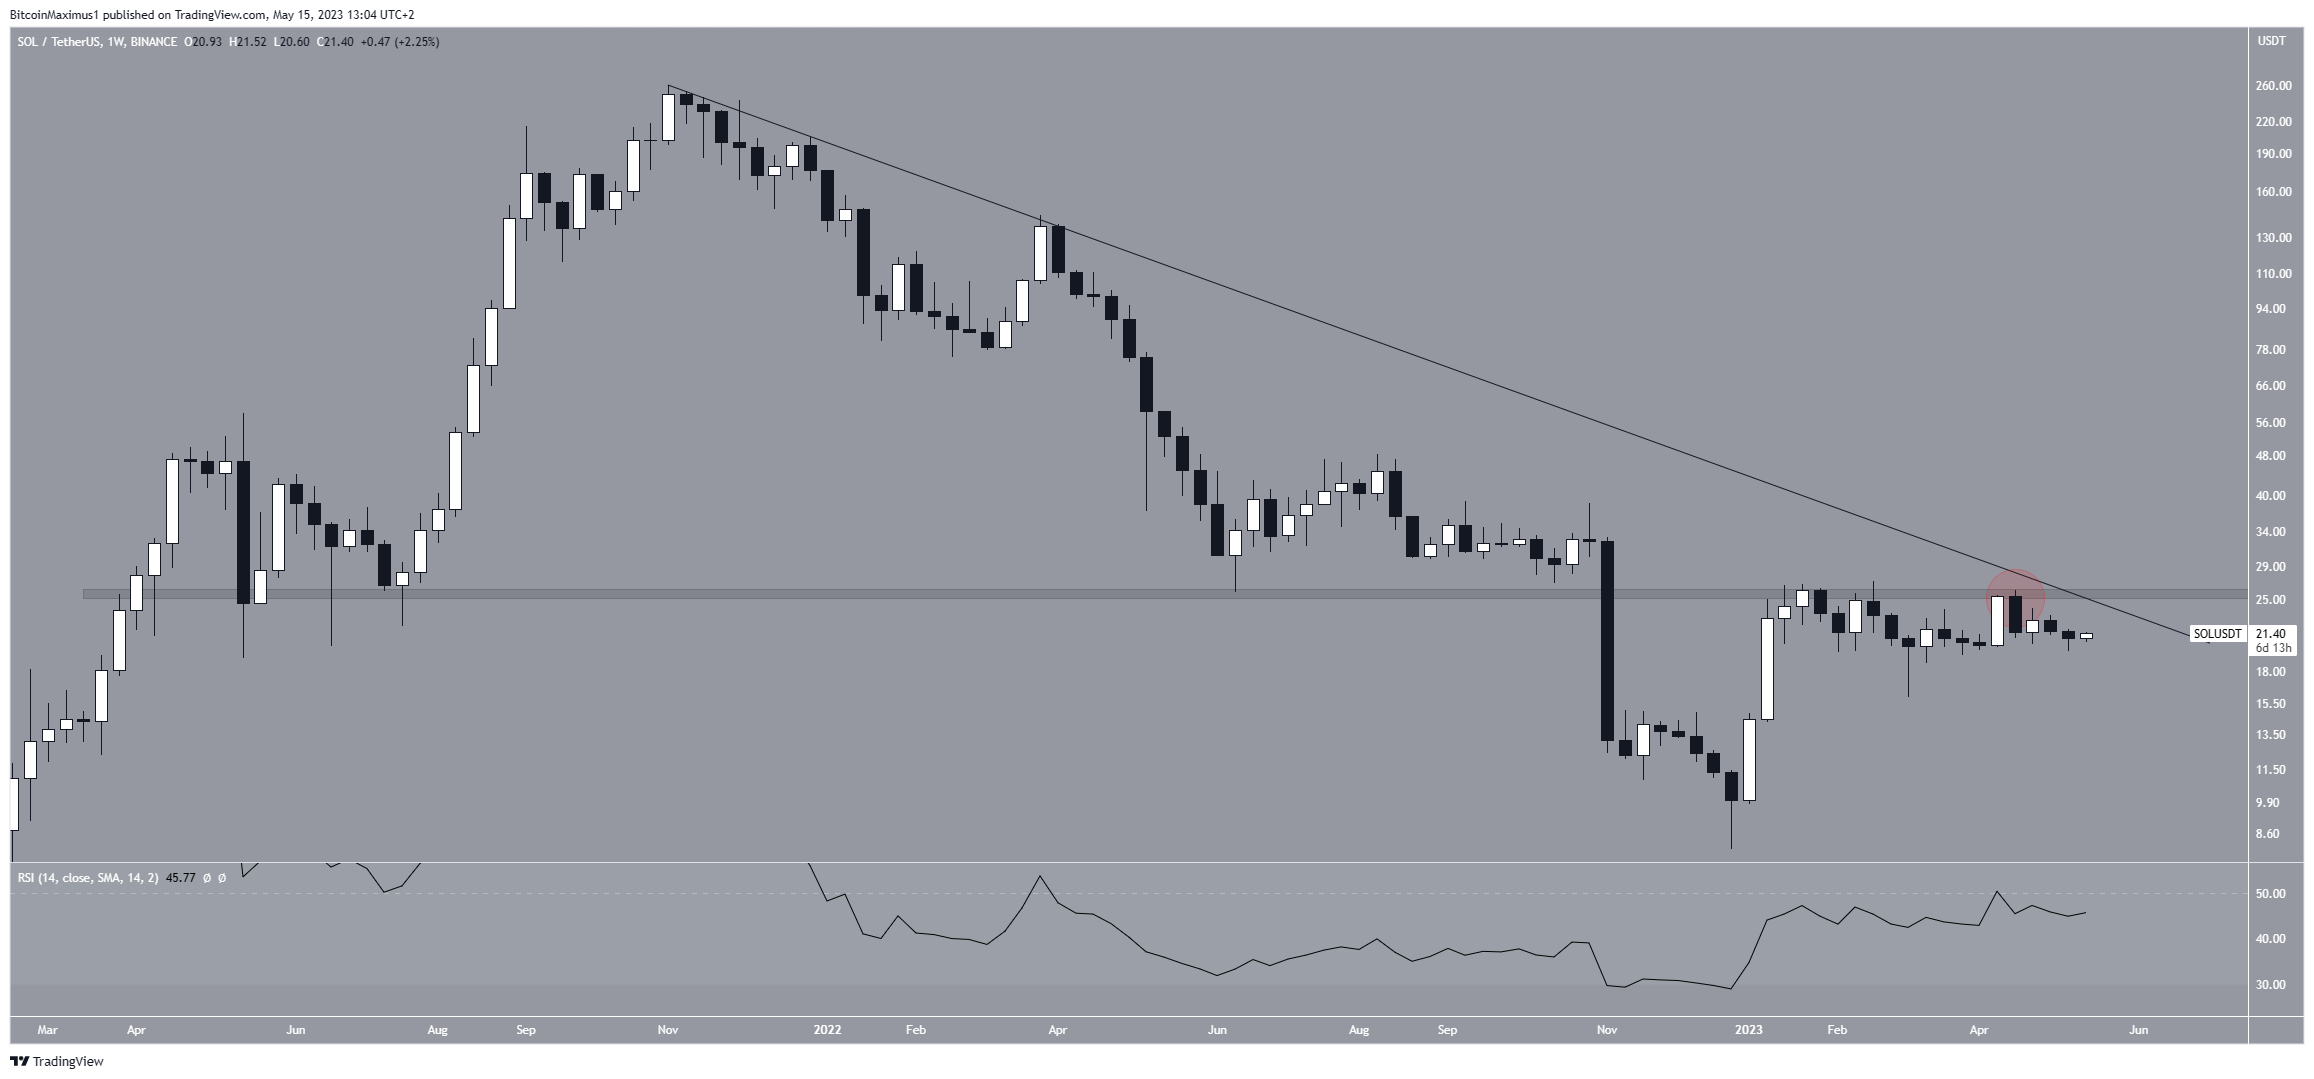
The weekly Relative Strength Index (RSI) gives mixed readings. The RSI is a momentum indicator traders use to evaluate whether a market is overbought or oversold and to determine whether to accumulate or sell an asset.
Readings above 50 and an upward trend suggest that bulls still have an advantage, while readings below 50 indicate the opposite. While the indicator is below 50, it has been increasing since the beginning of the year.
Solana Price Prediction: Breakout Imminent?
The technical analysis and price action on the six-hour time frame show that the SOL price has decreased inside a descending wedge since April 16. The descending wedge is considered a bullish pattern, meaning that it leads to a breakout most of the time.
On May 11, the price bounced at a confluence of support levels created by the wedge’s support line, $20 horizontal support area, and the 0.618 Fib retracement support level.
Whenever numerous support methods align at the same level, the significance of the level increases. The strong bounce confirmed the validity of the level.
As a result, the trend can be considered bullish as long as the price trades above it and bearish while it is below.
The six-hour RSI supports the possibility of a breakout. The RSI just moved above 50, and, more importantly, broke out from its previous resistance line (green).
Therefore, it suggests that the SOL token will break out from the wedge. If so, an increase to the $23.50 resistance area is expected.
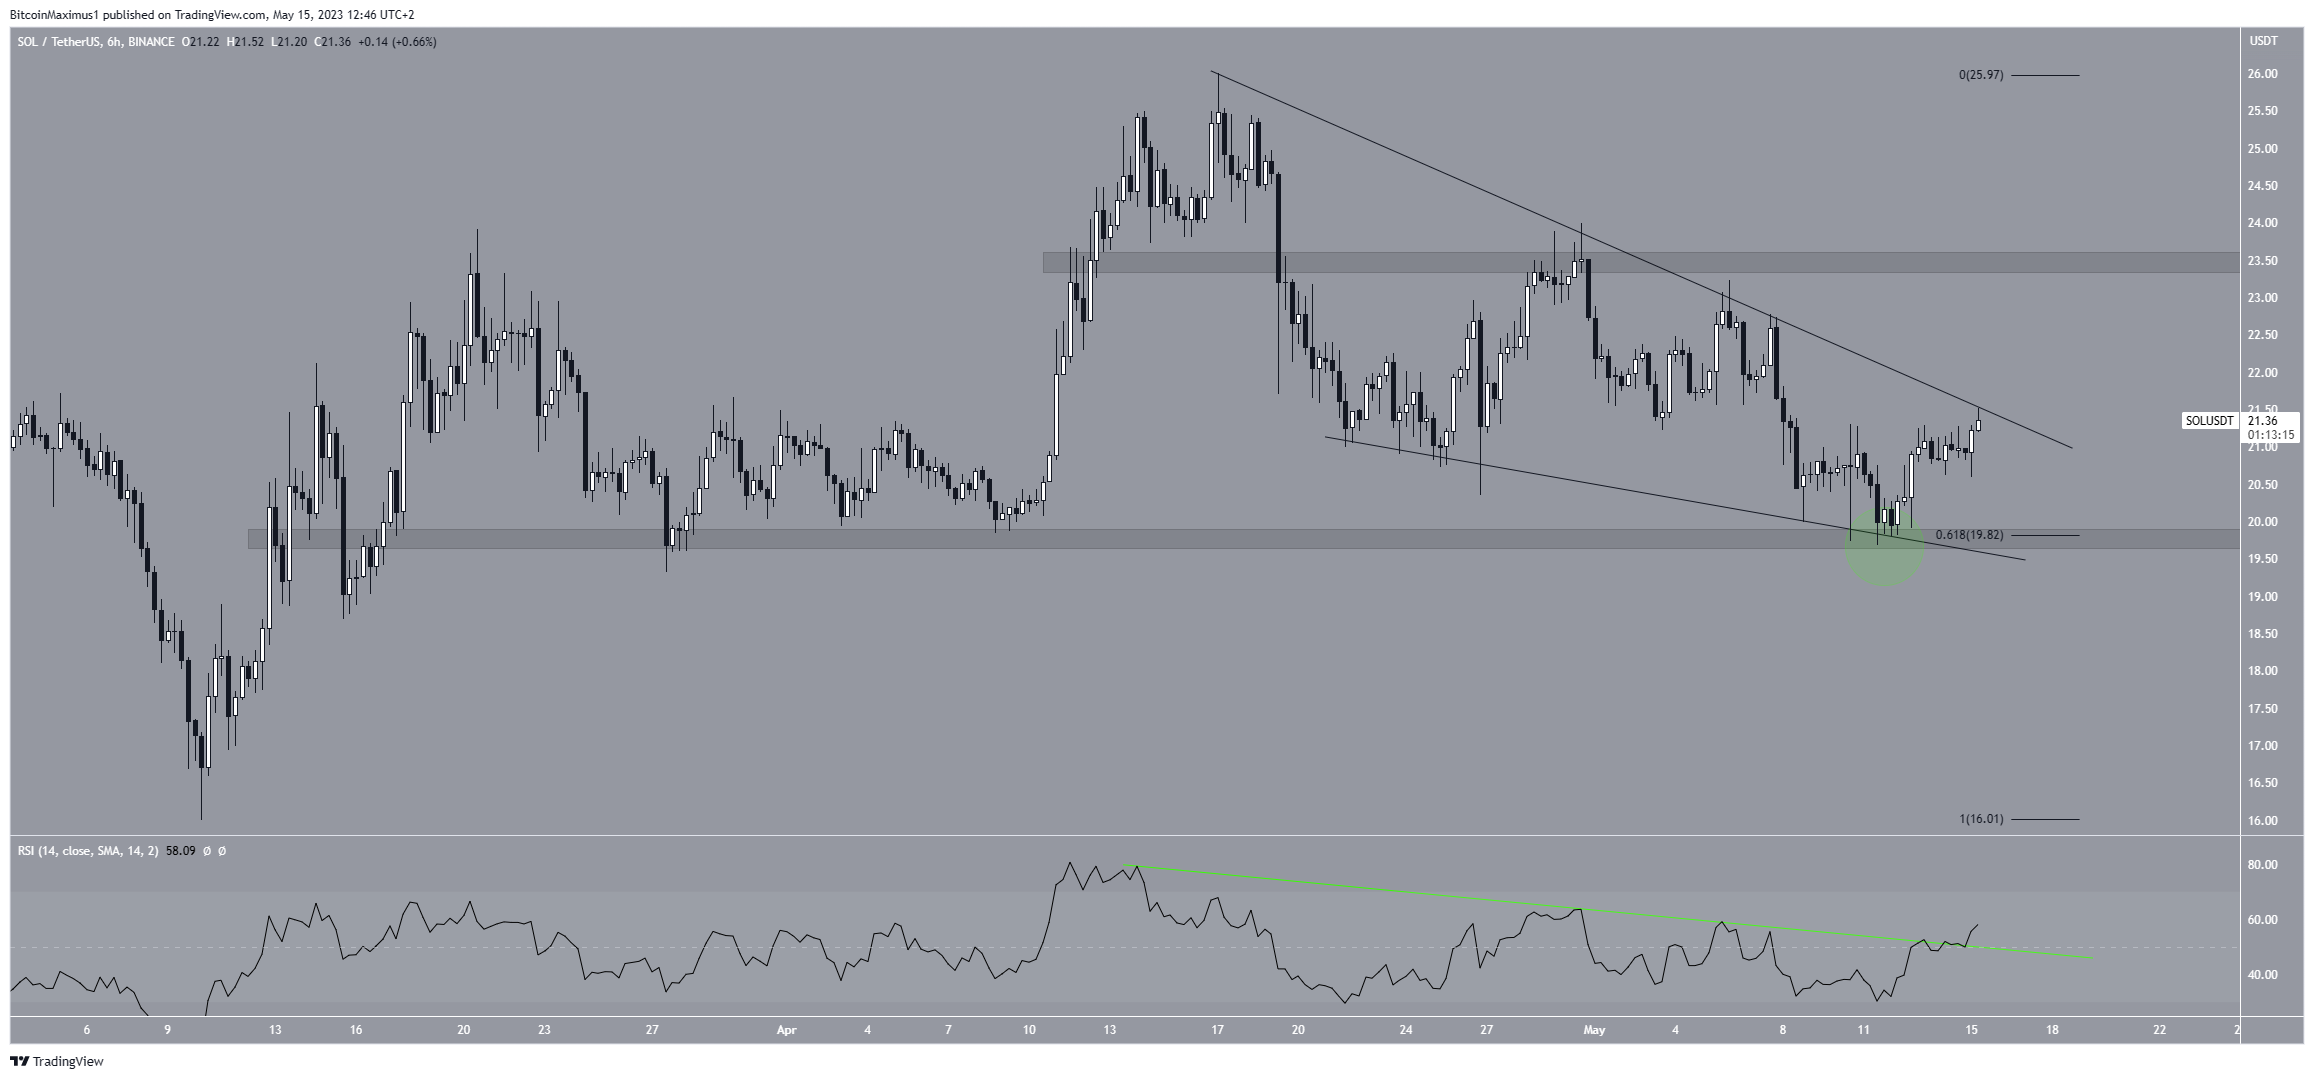
However, if the SOL price breaks down below $19.80, this bullish SOL price prediction will be invalid. In that case, a drop to $16 will be on the cards.
For BeInCrypto’s latest crypto market analysis, click here.


