


Shiba Inu (SHIB) price predictions suggest that a short-term breakout is expected to occur, taking the price to between $0.00001260 and $0.00001365.
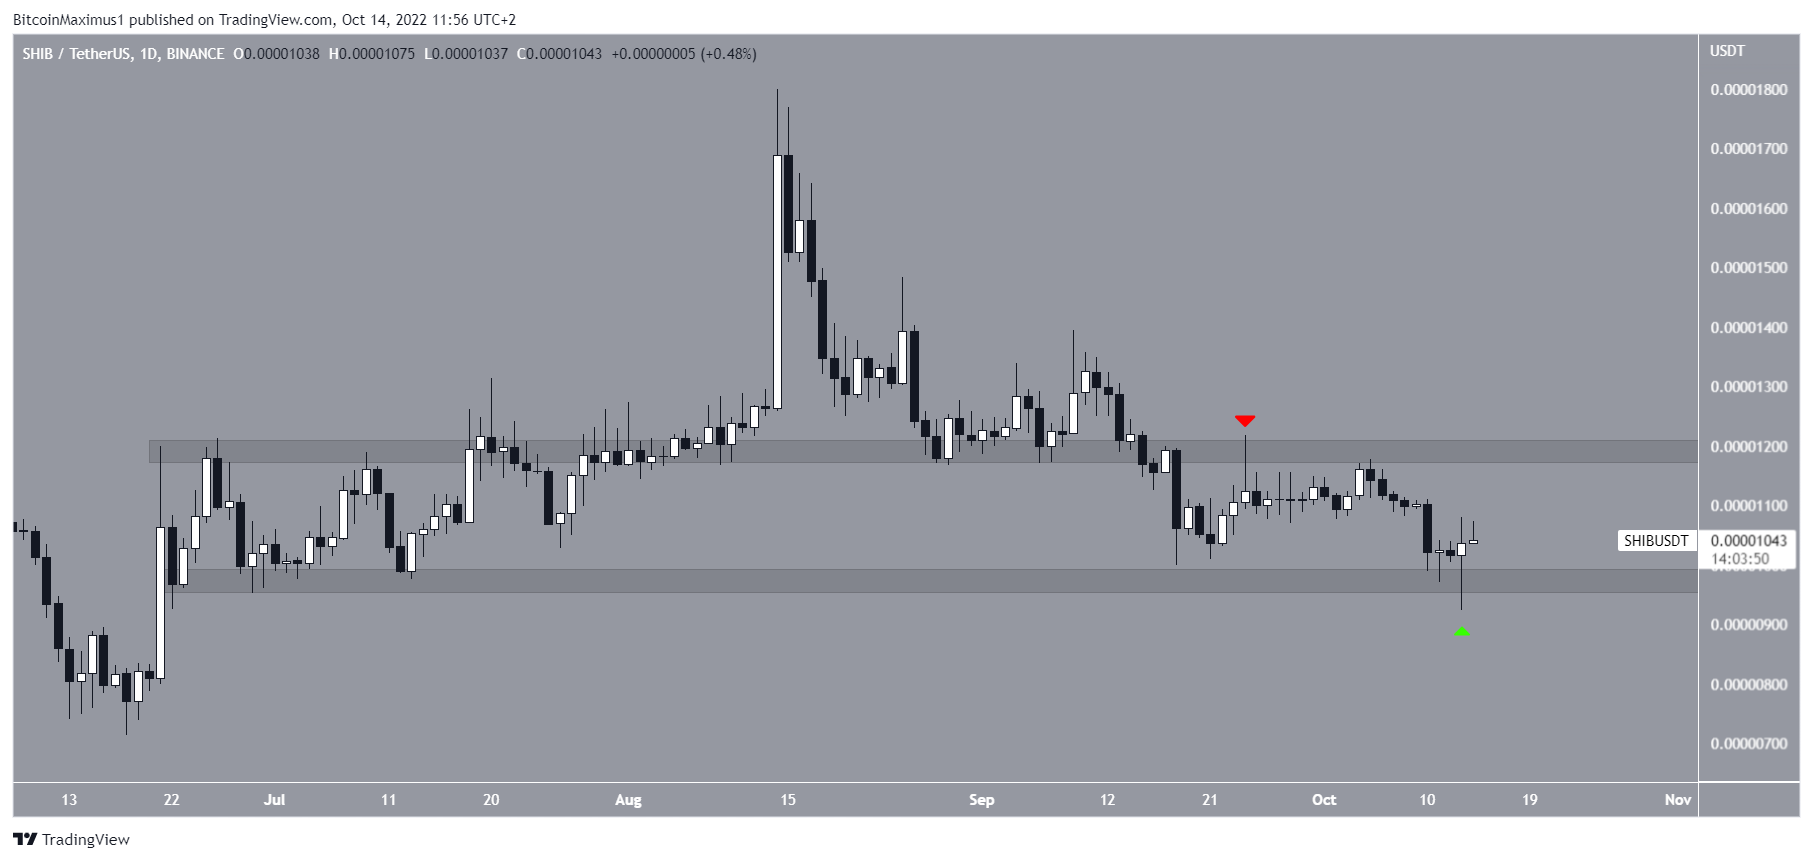
SHIB has been falling since reaching a high of $0.00001800 on Aug. 14. The downward movement so far led to a low of $0.00000924 on Oct. 14.
The price bounced afterward and created a bullish hammer candlestick (green icon).
Over the past 30 days, the price action has been contained in a range between $0.00000980 and $0.00001190. Thursday’s bounce validated the bottom of the range and could be the catalyst for an upward movement towards the range high.
Can Shib Price Break Out Above Resistance?
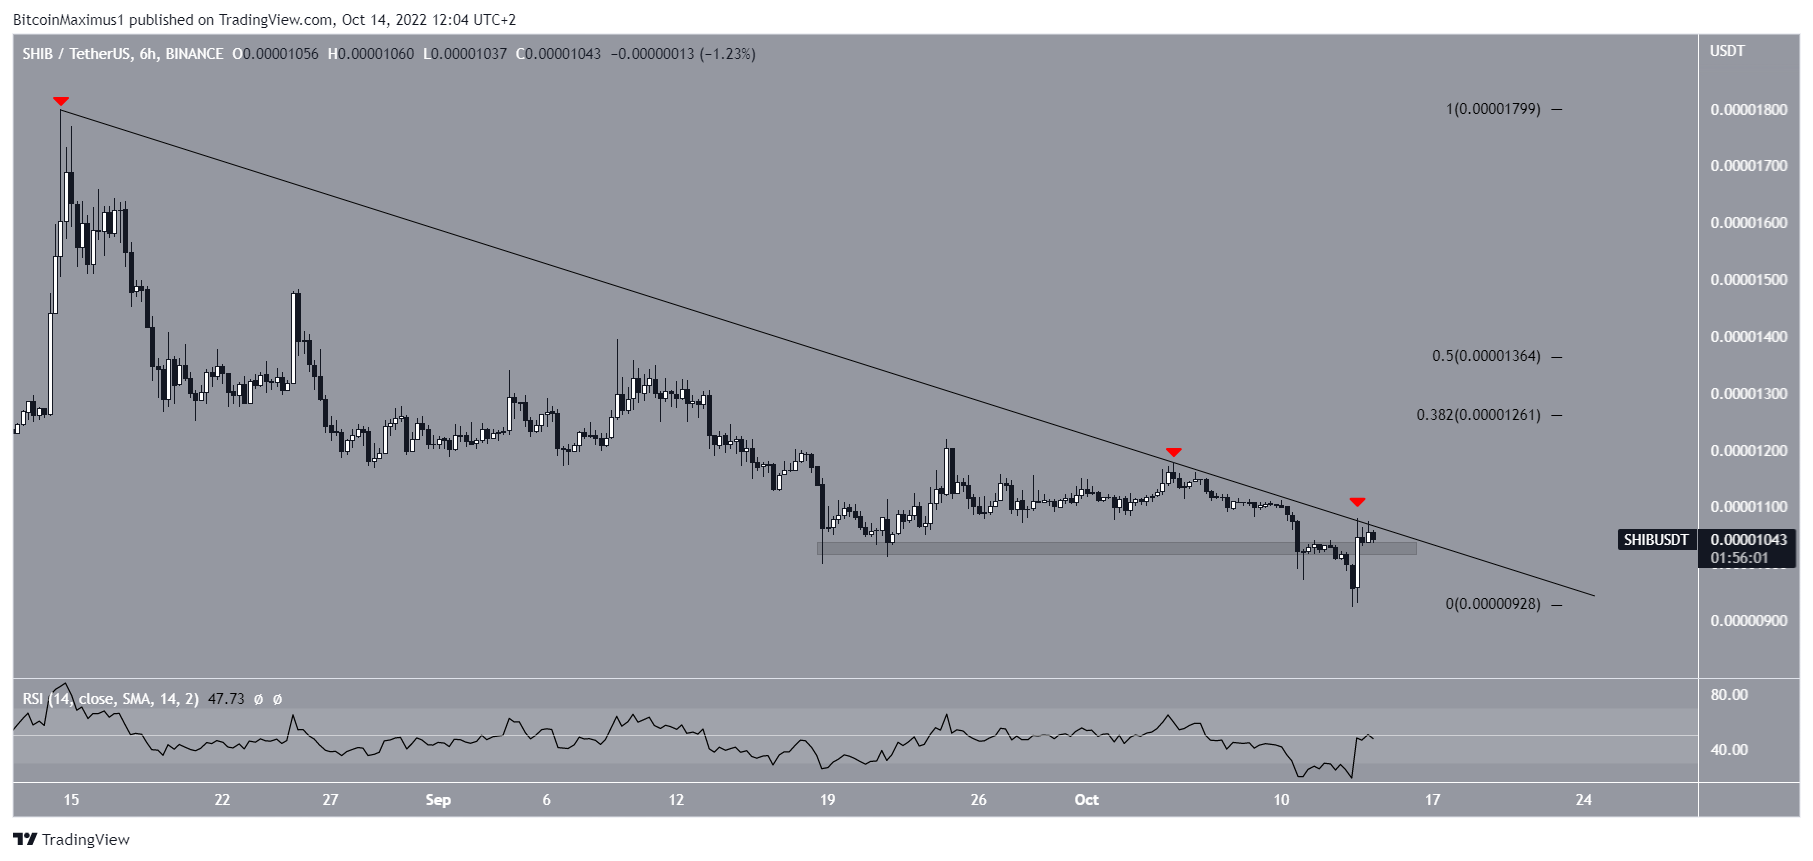
The six-hour chart shows that the SHIB price has been falling underneath a descending resistance line since Aug. 14. So far, the line has been validated three times (red icon). The final attempt at breaking out was made yesterday.
The six-hour RSI does not yet confirm the breakout, since it is still below 50. However, the price has moved above the $0.00001035 horizontal area and validated it as support.
If a breakout from the line occurs, the most likely price prediction would be an expected increase to between $0.00001260 and $0.00001365.
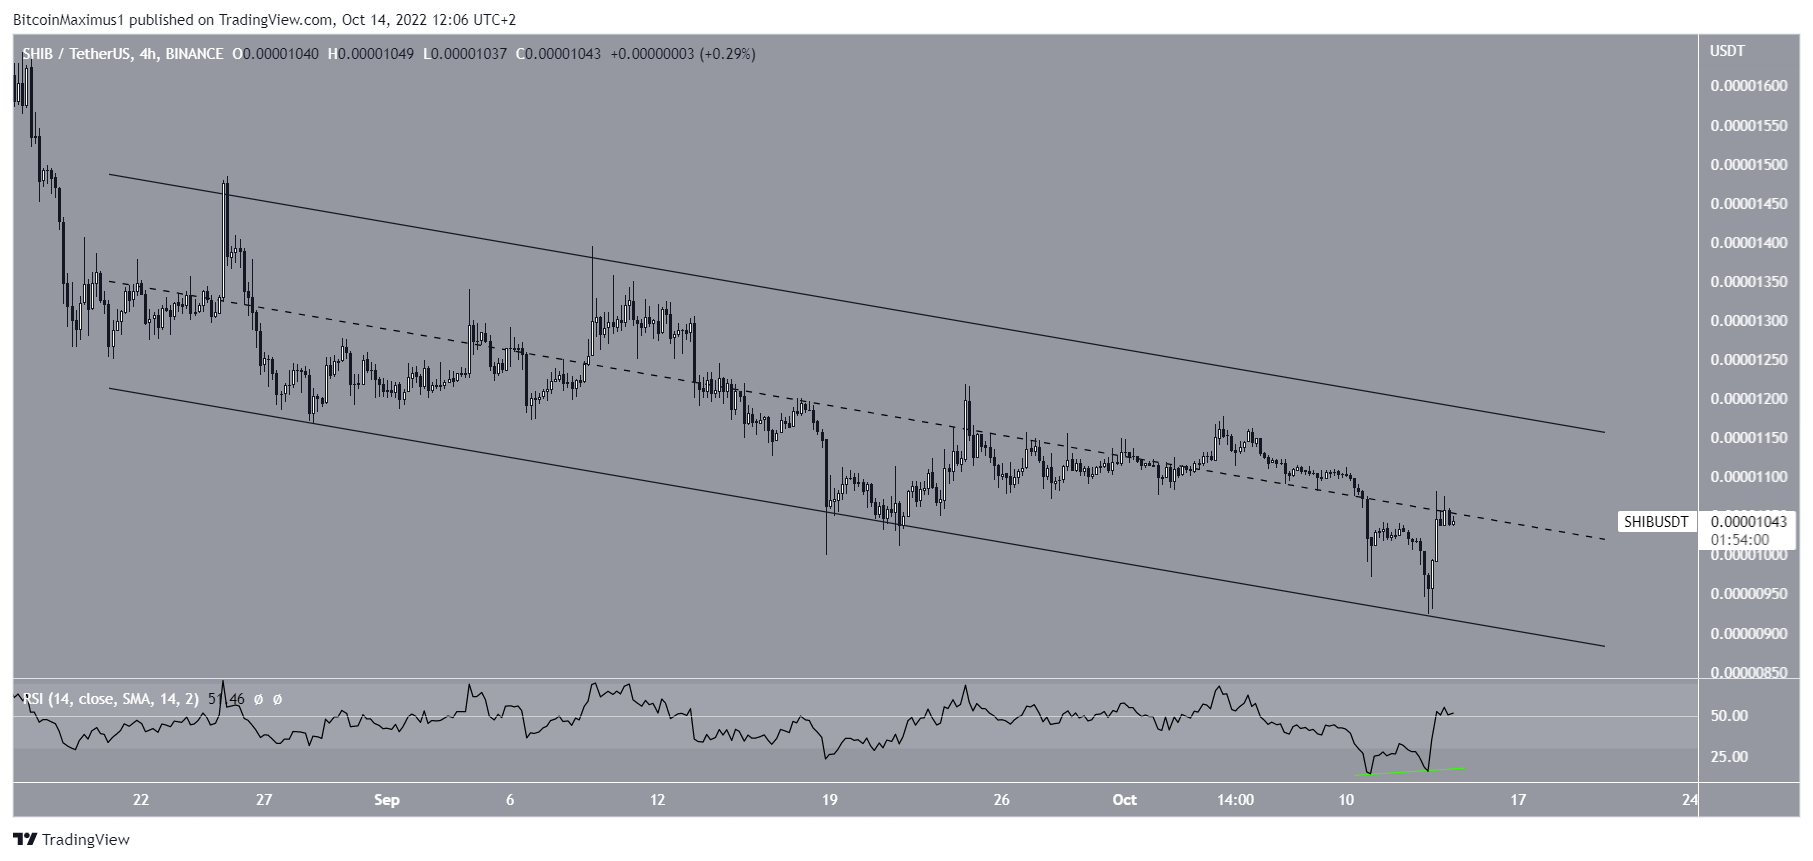
The four-hour chart supports the possibility of a price breakout. There are two reasons for this.
Firstly, the four-hour RSI has generated bullish divergence (green line) inside oversold territory. This was the catalyst for the short-term bounce in price.
Secondly, the price is trading in a descending parallel channel. Such channels usually contain correction movements. Meaning that an eventual breakout is expected. A movement above the middle of the channel would make this possibility even more likely.
A breakout from the channel would also constitute a SHIB price breakout from the resistance line and the top of the range. Therefore, it could greatly accelerate the rate of increase towards the area from the previous price prediction.
Short-term Relief Is on the Way
To conclude, the direction of the long-term trend is still unclear, mainly due to the fact that the SHIB is still trading in a range. However, the short-term price prediction for Shiba Inu suggests that a breakout is expected from both the descending channel and the descending resistance line.
If one occurs, the price could increase to between $0.00001260 and $0.00001365. Conversely, a fall below the $0.00001035 horizontal area would mean that lower prices are in store.
For BeInCrypto’s latest Bitcoin (BTC) analysis, click here
Disclaimer: BeInCrypto strives to provide accurate and up-to-date information, but it will not be responsible for any missing facts or inaccurate information. You comply and understand that you should use any of this information at your own risk. Cryptocurrencies are highly volatile financial assets, so research and make your own financial decisions.


