
The Shiba Inu (SHIB) price is consolidating inside a symmetrical triangle, from which a breakout is expected. This could take the price to $0.0000135.
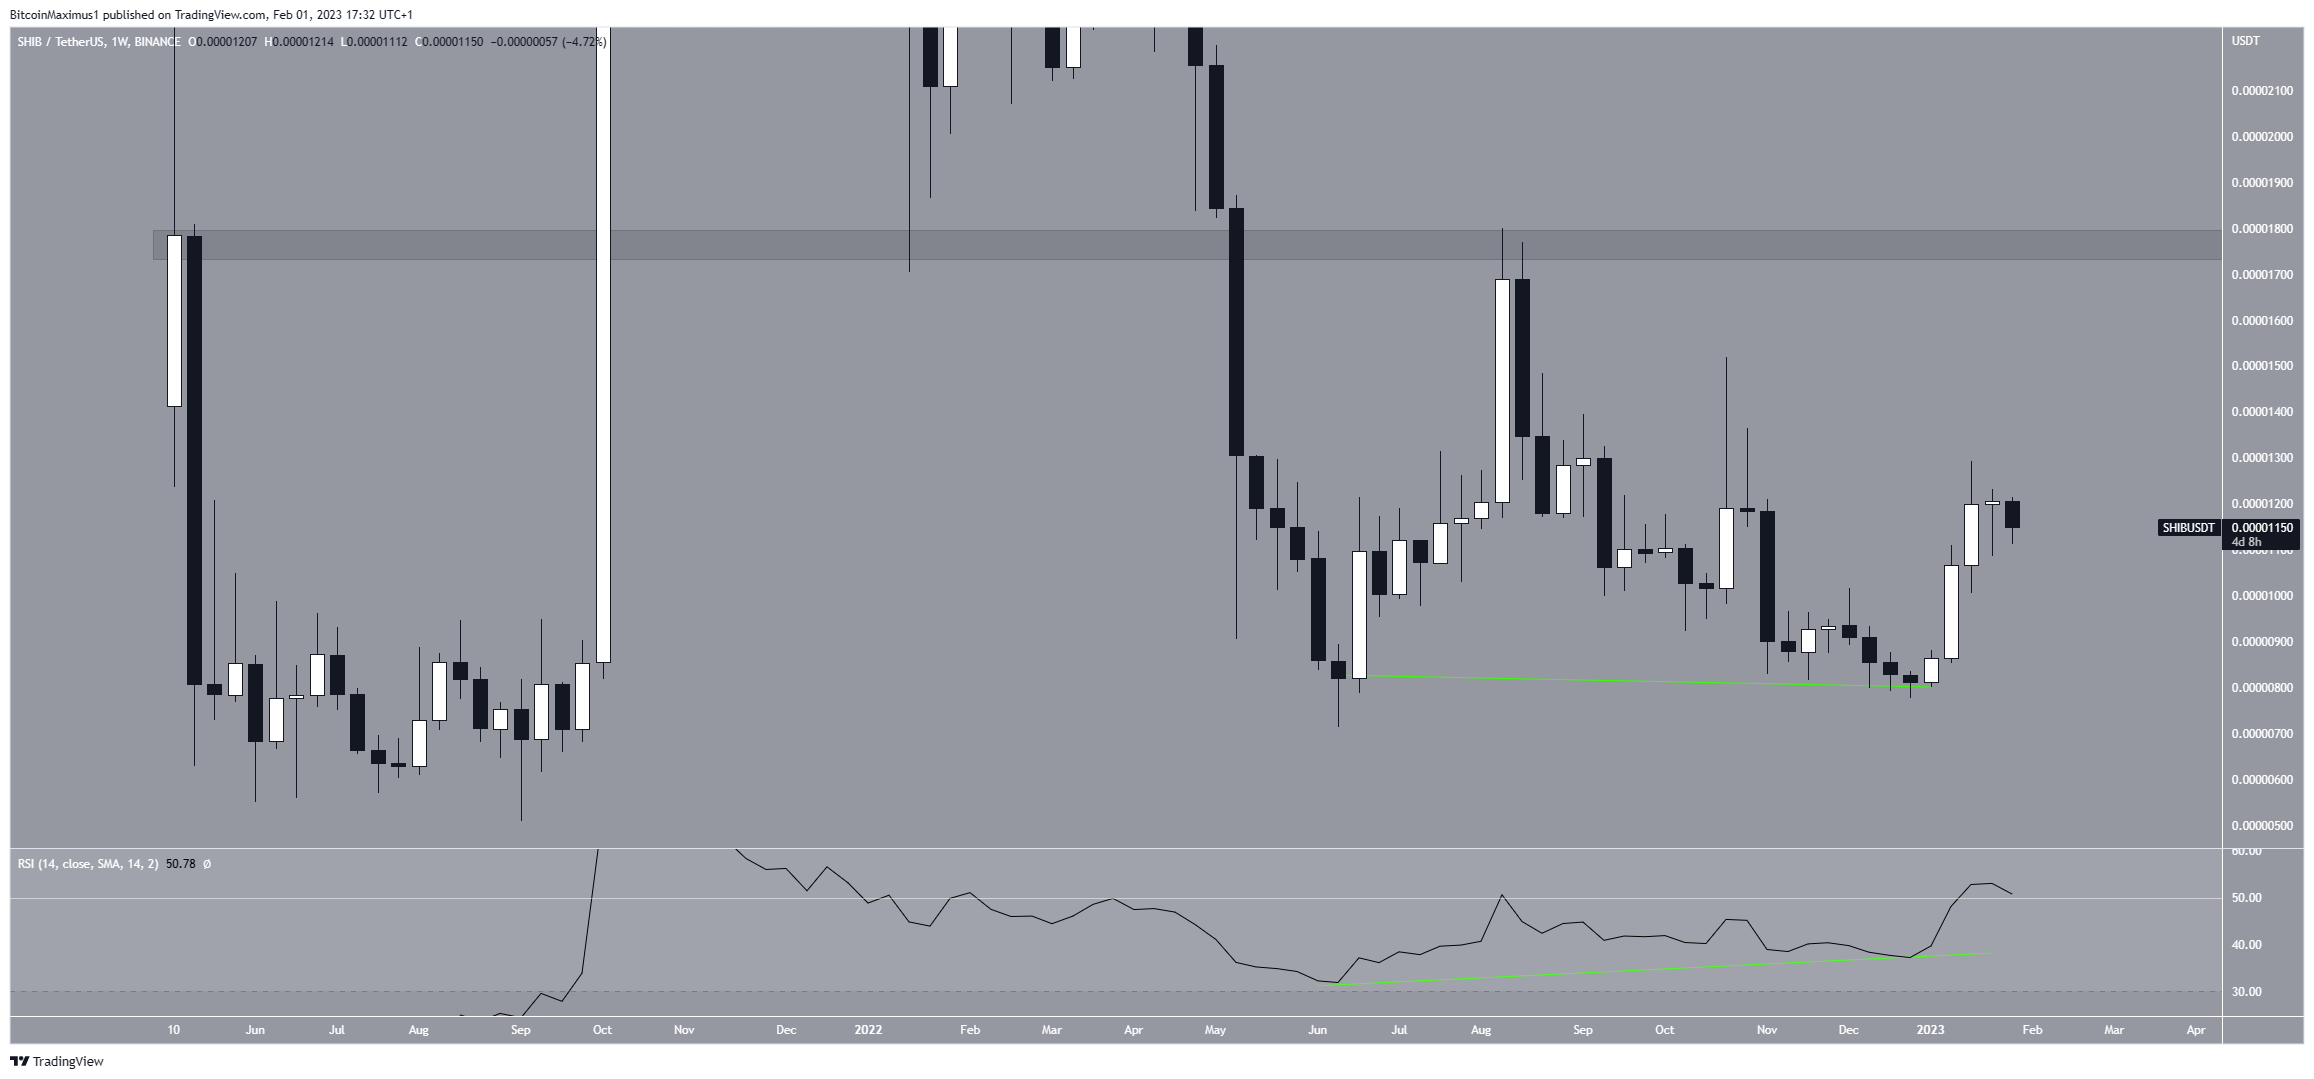
The weekly time frame technical analysis for the SHIB price is bullish. There are two main causes for this:
First, a double bottom has been formed, which is a bullish pattern. The double bottom formed inside the $0.0000083 long-term support zone, adding to its credibility.
Second, the weekly RSI showed positive divergence along with the double bottom (green line). Divergences over such extended periods of time are uncommon. So, this might trigger a significant surge.
The main resistance zone in the weekly time frame is at an average price of $0.0000175. Therefore, if the price of the SHIB coin verifies its double bottom pattern, there is significant upside potential.
Shiba Inu Price Prediction for February: Breakout Could Occur Soon
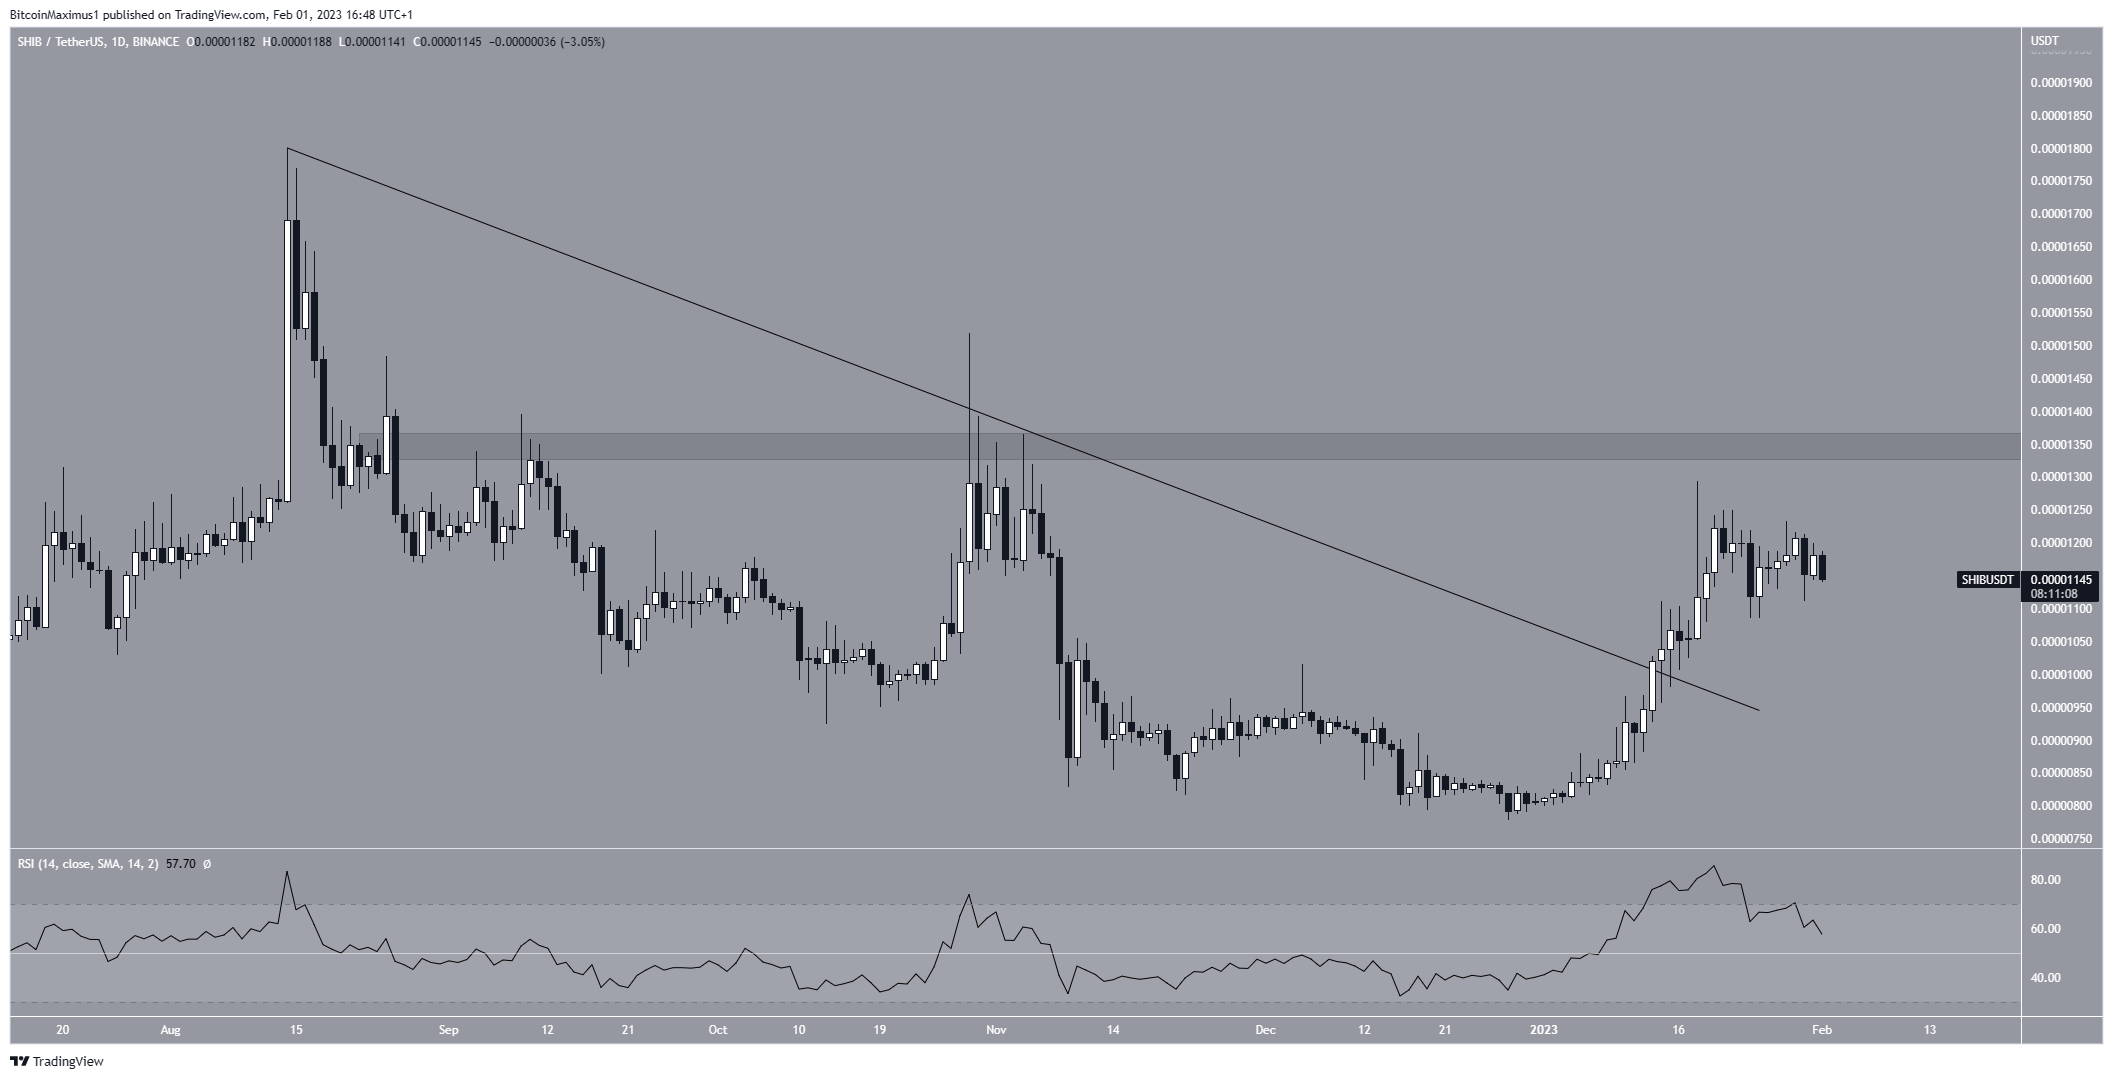
The technical analysis from the daily chart shows that the price broke out from a descending resistance line on Jan. 13, reaching a high of $0.0000129 five days later. The price has fallen since.
While the daily RSI is also decreasing, it has not generated any bearish divergence yet. As a result, it is not certain if the increase will continue toward $0.0000135 or the rally will lose momentum and reverse.
In the case of the latter, the Shiba Inu price could re-test the resistance line at $0.0000900.
The short-term six-hour time frame shows that the Shiba Inu price is trading inside a symmetrical triangle. While the triangle is considered a neutral pattern, it often provides continuation. Since it comes after an upward movement, a breakout from it would be the most likely scenario. As a result, the six-hour time frame supports the possibility that the SHIB price will increase toward $0.0000135.
A breakdown from the triangle would invalidate this bullish Shiba Inu price prediction for February. In that case, the Shiba Inu price could fall to the 0.5 Fib retracement support level at $0.0000103, which is also a horizontal support area.
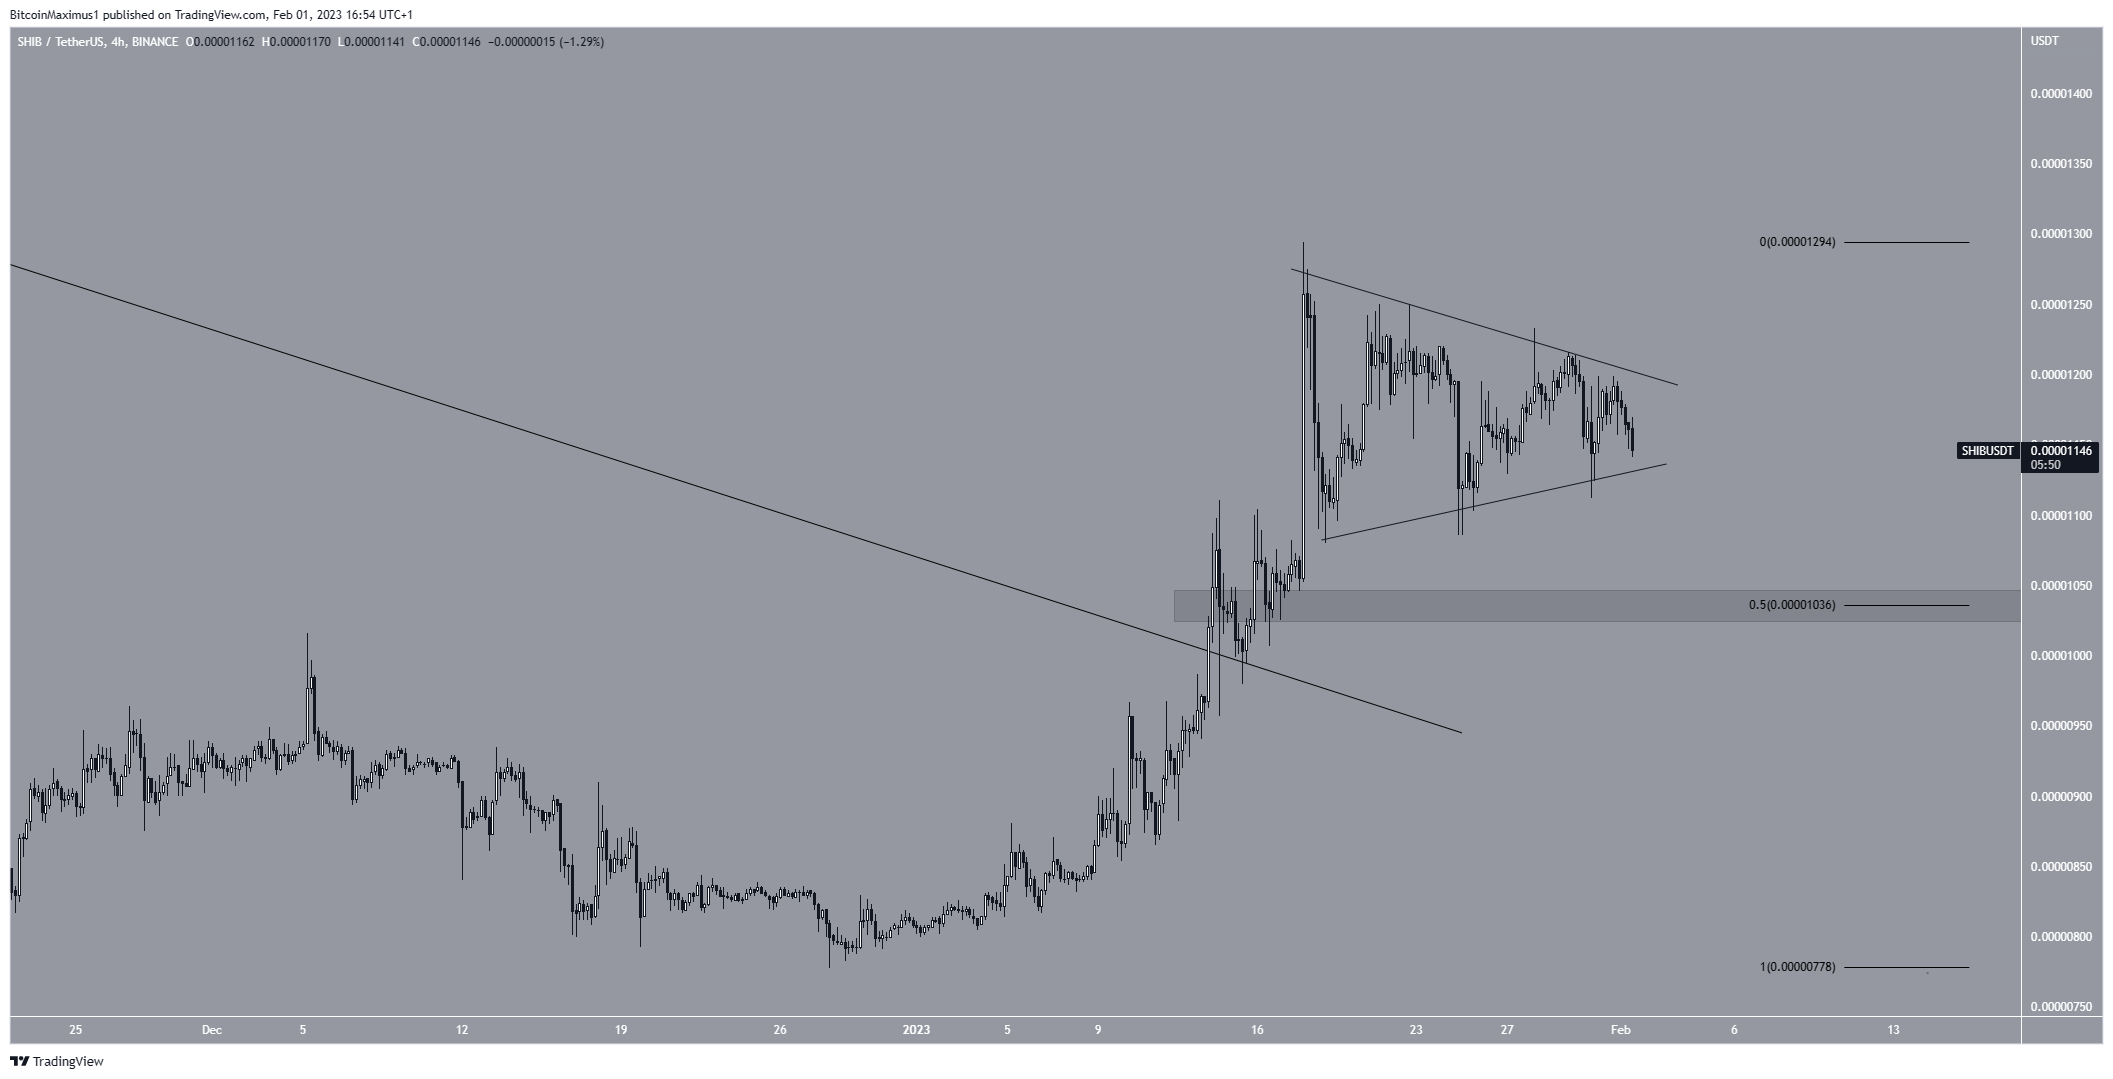
To conclude, the most likely Shiba Inu price prediction for February is a breakout from the triangle and an increase toward $0.0000135. On the other hand, a close below the triangle’s support line would invalidate this bullish Shiba Inu price forecast and could catalyze a fall toward $0.0000103.
For BeInCrypto’s latest crypto market analysis, click here.
