

While Shiba Inu (SHIB) has been moving upwards since June 18, it is trading inside a short-term corrective pattern, indicating that a breakdown could transpire.
SHIB has been decreasing since reaching an all-time high price of $0.000088 in Oct. The downward movement became more gradual and started following a descending resistance line in Dec.
The line has caused several rejections, most recently doing so in April. This led to a low of $0.00000739 in June.
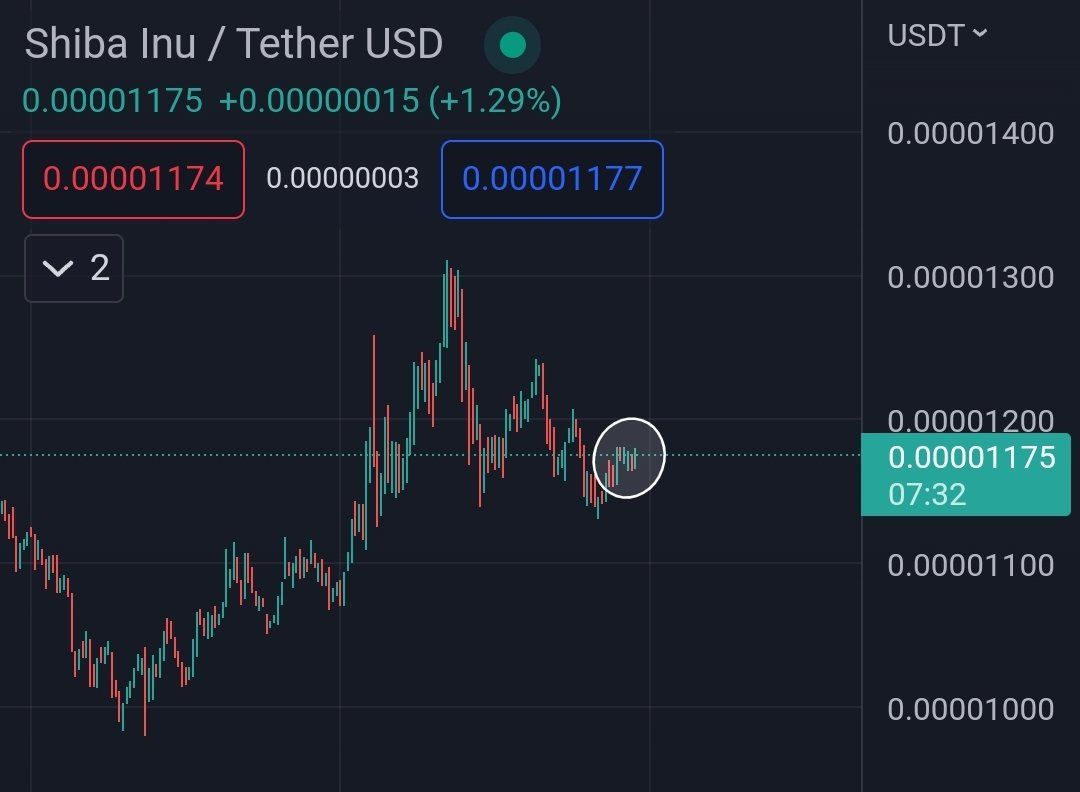
However, the price has been increasing since after bouncing at the $0.0000078 horizontal support area (green icon), a level that had not been reached in nearly a year.
SHIB is currently trading at $0.00001, having fallen by 88% since the all-time high.
If the upward movement continues, the aforementioned resistance line would be found at $0.000015. A breakout from this line is required in order for the long-term trend to be considered as bullish.

Short-term SHIB movement
SHIBA INU enthusiast @army_shiba stated that a short-term breakout could transpire soon.
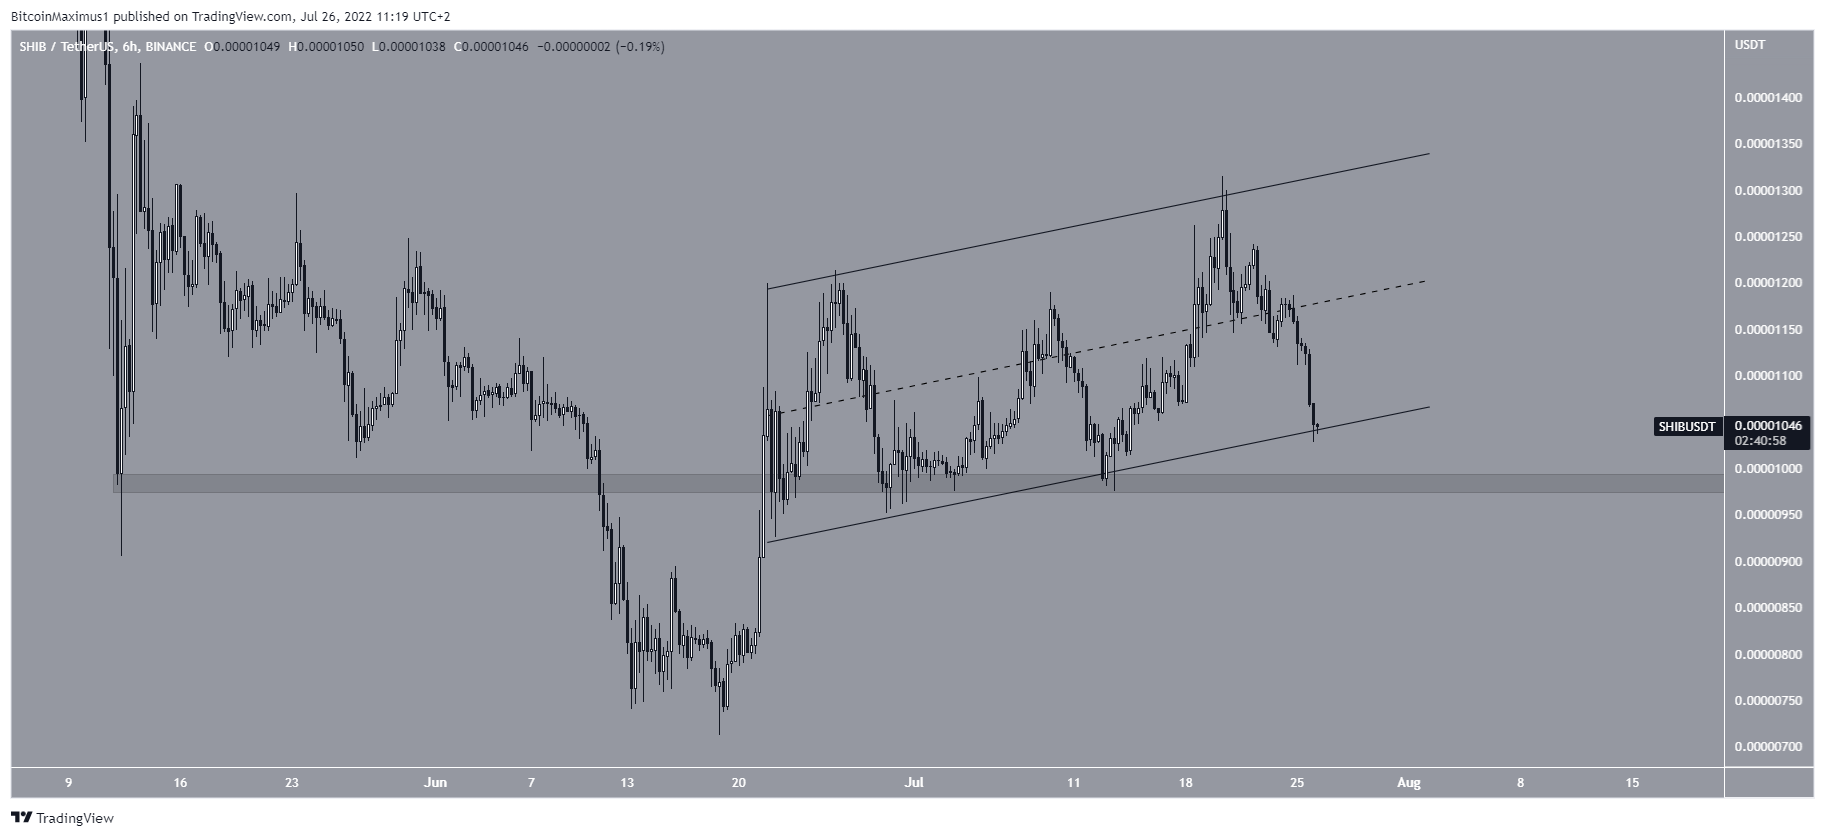
The six-hour chart shows that SHIB initiated a very rapid upward movement on June 18. However, since June 22, it has been trading inside an ascending parallel channel. Such channels usually contain corrective movements, meaning that an eventual breakdown from it is likely.
Additionally, the movement inside the channel has had considerable overlap, another sign that indicates that the movement is corrective. Currently, SHIB is trading right at the support line of this channel.
If a breakdown occurs, the closest support area would be at $0.0000985. Previously, the price had deviated (red circle) below this area prior to reclaiming it.
As a result, a breakdown below this level would be a decisive bearish signs that would indicate that the trend is still bearish and new lows will follow.
For Be[in]Crypto’s latest Bitcoin (BTC) analysis, click here
Trusted
Disclaimer
In line with the Trust Project guidelines, this price analysis article is for informational purposes only and should not be considered financial or investment advice. BeInCrypto is committed to accurate, unbiased reporting, but market conditions are subject to change without notice. Always conduct your own research and consult with a professional before making any financial decisions. Please note that our Terms and Conditions, Privacy Policy, and Disclaimers have been updated.
