


SHIBA INU (SHIB) is showing bullish reversal signs inside a long-term horizontal support area. However, the potential reversal has not been confirmed yet.
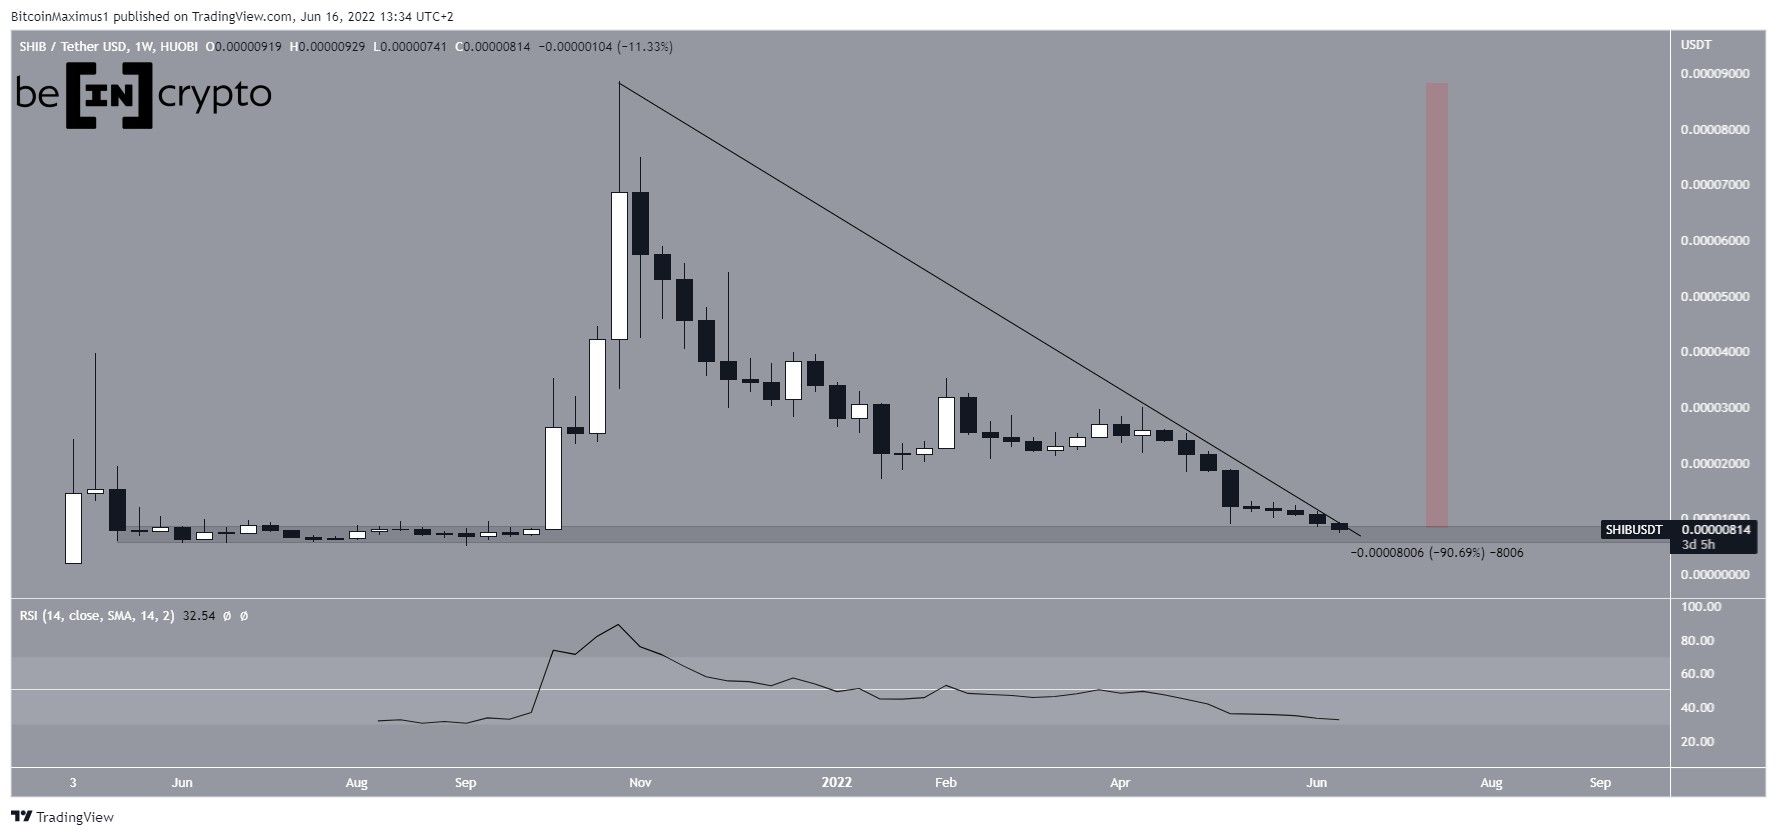
SHIB has been decreasing since reaching an all-time high price of $0.000088 on Oct 28, 2021. The dip has led to a local low of $0.0000074 on June 13. This amounted to a decrease of 90.50% measuring from the all-time high.
The price is close to the $0.000007 support area, which has been in place since 2021.
Despite the proximity to this support level, the weekly RSI is bearish since it is below 50 and falling, indicating that the trend is still bearish.
The price may also have been following a descending resistance line since the all-time high, but its slope has not been confirmed yet.
Potential bounce
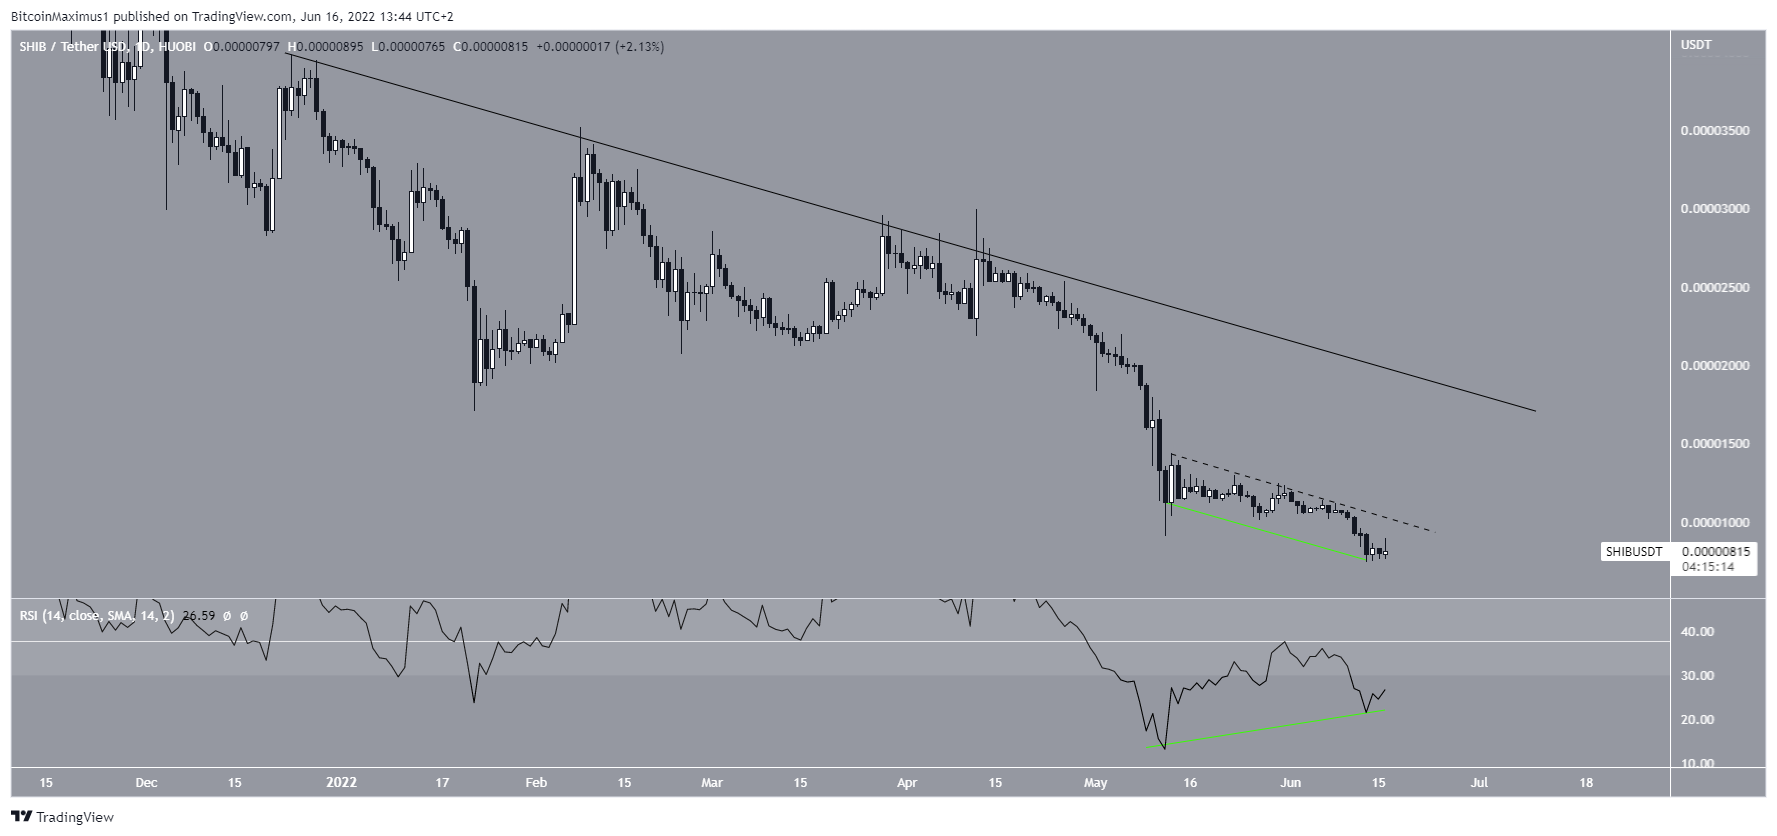
The daily time frame suggests that a bounce could occur soon. The main reason for this is the considerable bullish divergence (green line) that has developed in the daily RSI.
In order for this divergence to be confirmed, the indicator has to move above 37 (white line), the top between the two divergences.
For this to occur, the price would likely have to break out from a short-term descending resistance line (dashed). In turn, this could lead to an upward movement towards the next closest resistance line at $0.000017.
Short-term SHIB movement
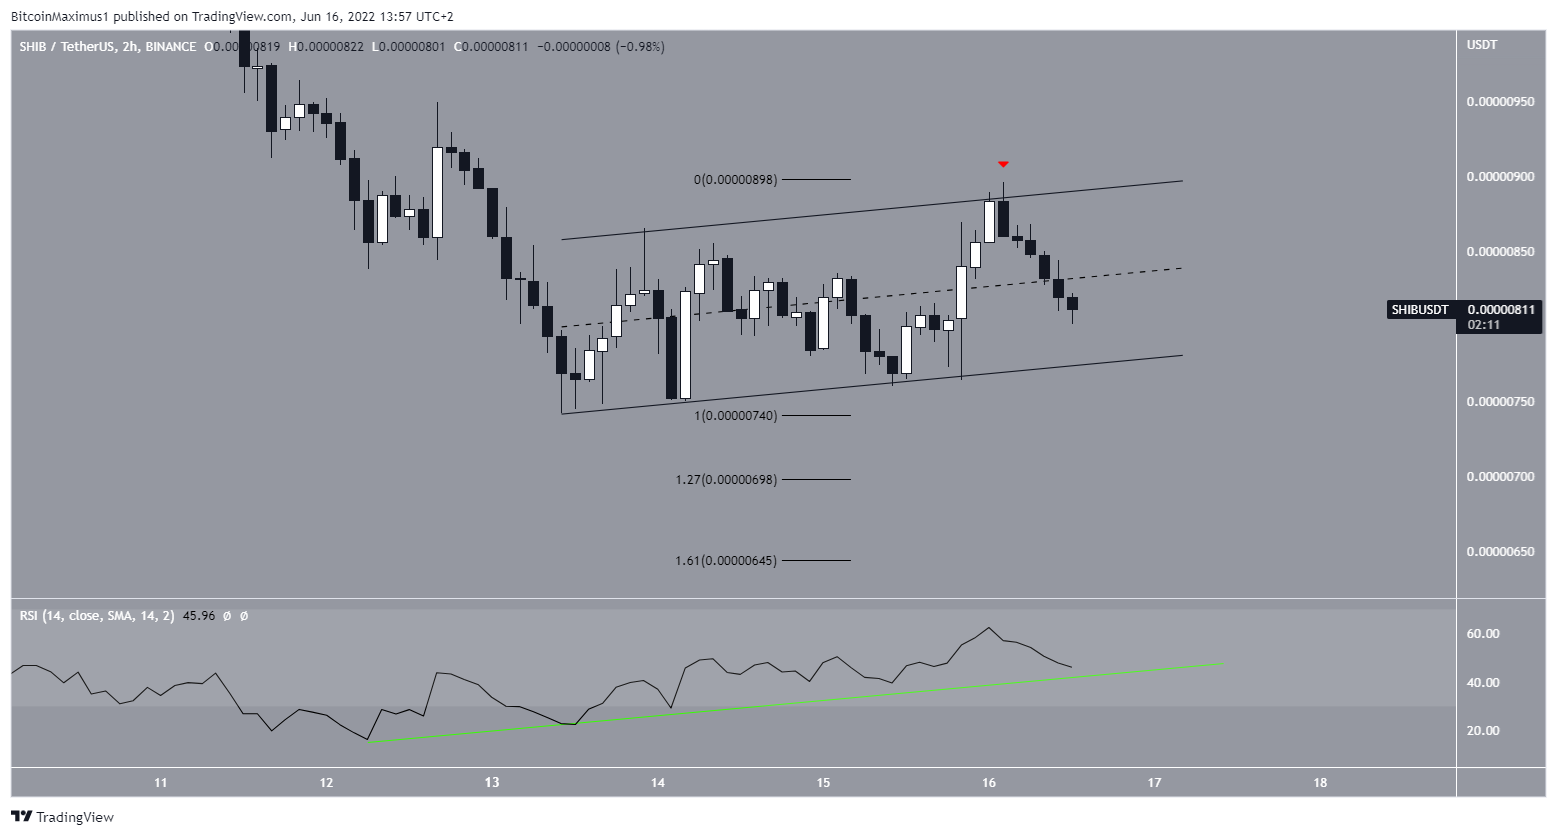
Finally, the two-hour chart shows that SHIB has been increasing inside an ascending parallel channel since May 12. Such channels usually contain corrective movements, meaning that an eventual breakdown from it would seem likely.
Moreover, the price was rejected by the resistance line of this channel on June 16 (red icon) and has been falling since. It’s currently trading below the channel’s midline. This is a bearish sign that indicates a breakdown is likely.
The 1.27 external Fib retracement is found at $0.000007, coinciding with the previously outlined long-term support area. If that does not hold, the next closest support area would be at $0.00000645, created by the 1.61 external Fib retracement level.
For Be[in]Crypto’s latest bitcoin (BTC) analysis, click here


