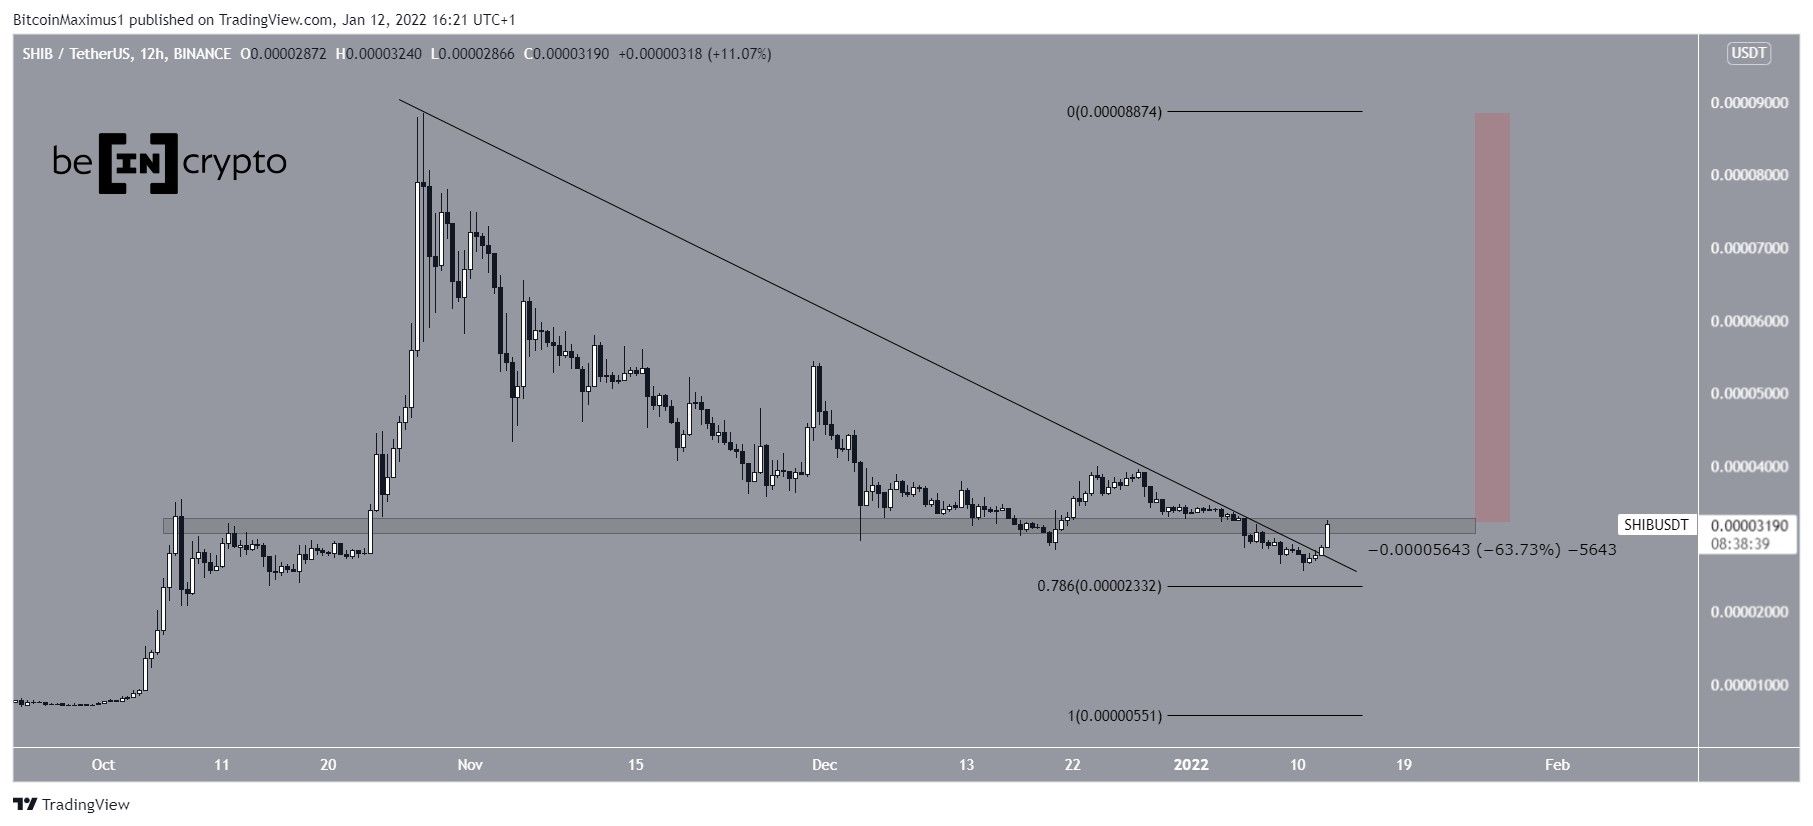
SHIBA INU (SHIB) is still trading 64% below its all-time high price, but has shown some bullish signs with the ongoing bounce.
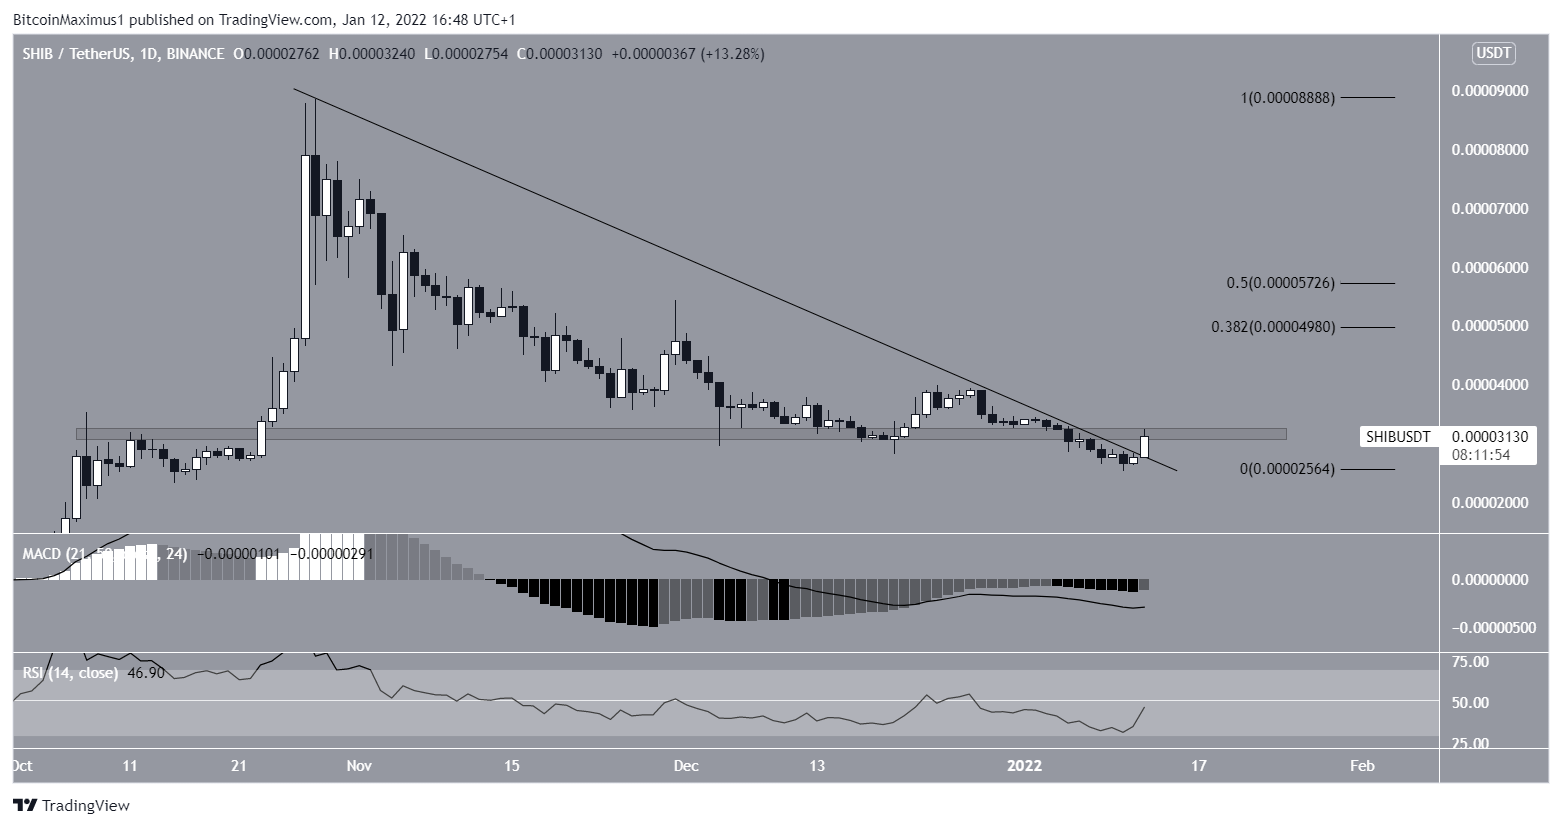
SHIB has been falling since reaching a high of $0.00008854 on Oct 28. The decrease has followed a descending resistance line. It eventually led to a low of $0.00002537, which was reached on Jan 10.
Afterwards, SHIB bounced and broke out from the aforementioned descending resistance line. Currently, the token is in the process of reclaiming the $0.000032 horizontal area, which previously acted as support but has now turned to resistance. Therefore, this is a crucial horizontal level.
Measuring from the all-time high, the token has decreased by 64%
Cryptocurrency trader @altcoinsherpa tweeted a SHIB chart, stating that the token could bounce near the current level.
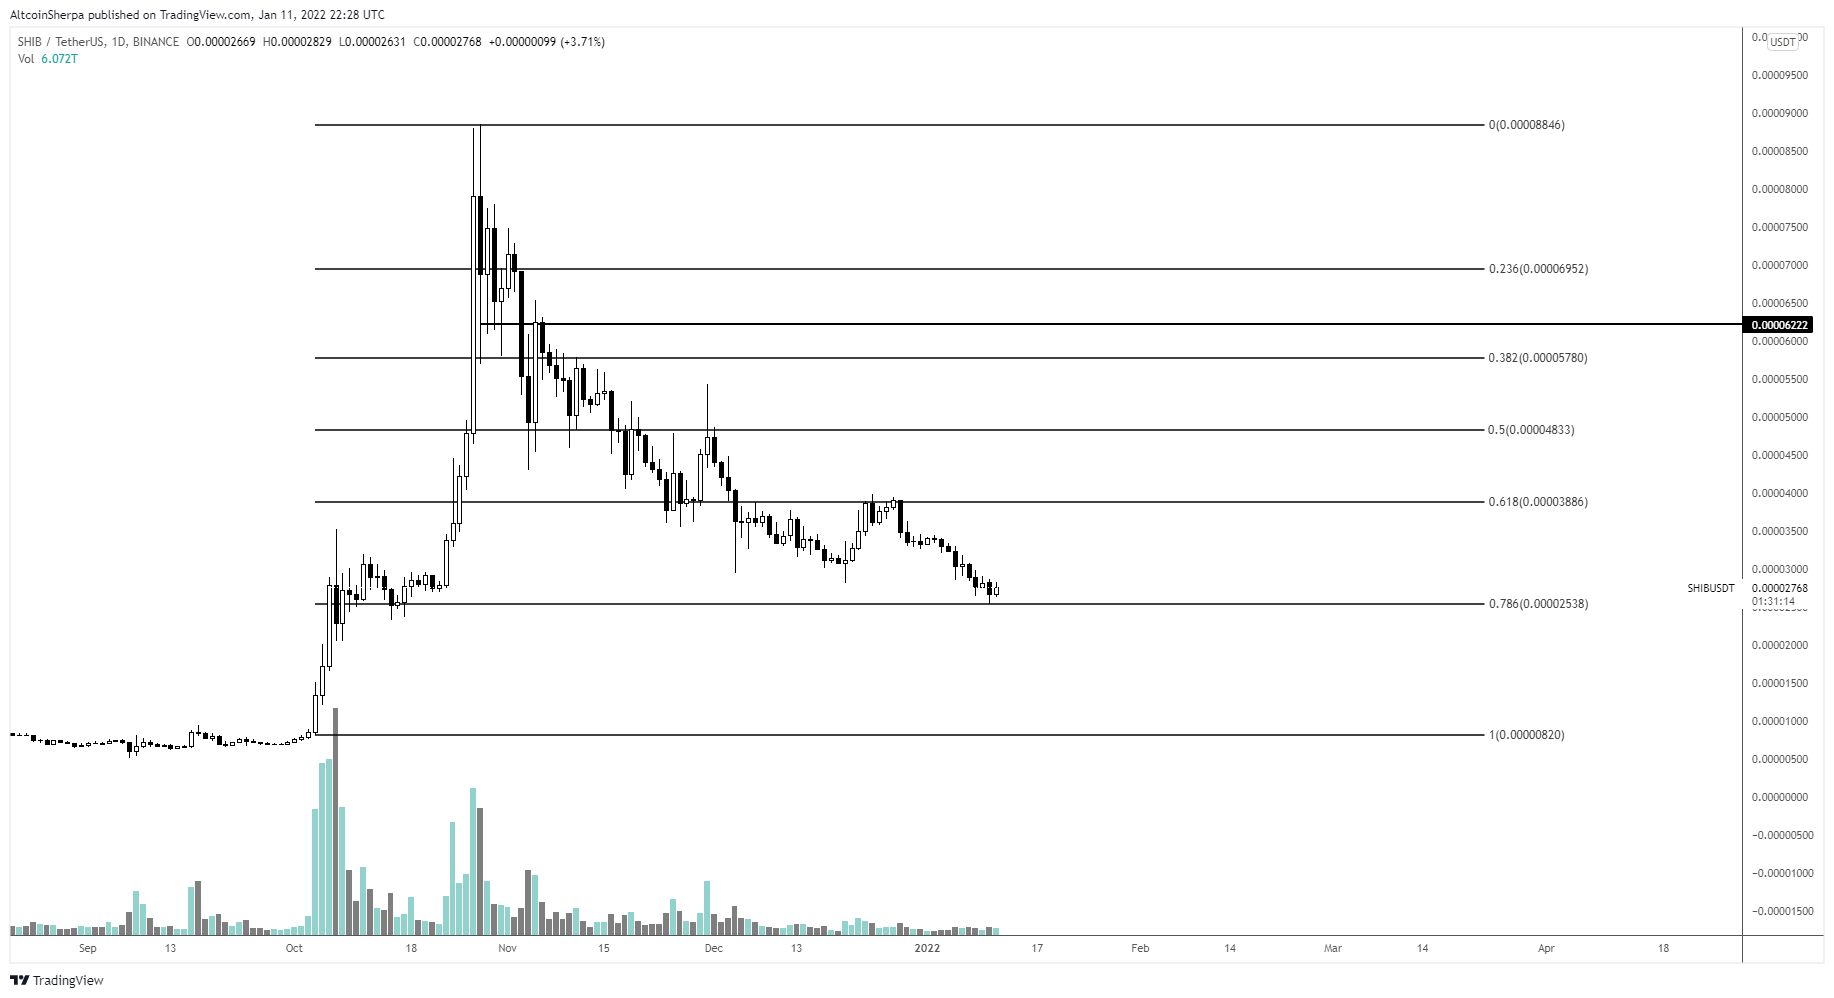
Since the tweet, SHIB has bounced and is in the process of reclaiming the $0.000032 area.
Future SHIB movement
If the breakout continues, the closest resistance area would be between $0.000050 – $0.000057. This resistance is created by the 0.382-0.5 Fib retracement resistance levels.
However, despite the ongoing increase, technical indicators in the daily time-frame have yet to confirm the bullish reversal.
The MACD, which is created by a short- and a long-term moving average (MA), is still negative despite its ascent. This means that the short-term MA is still slower than the long-term one. While the higher histogram bar is a bullish sign, there are several hours left until the daily close.
Similarly, the RSI is still below 50. The RSI is a momentum indicator, and values below 50 are considered bearish. Despite the ongoing increase, the RSI is currently at 44.
Therefore, it is not yet clear if the current bounce is part of a bullish reversal, or it is just a relief rally.