
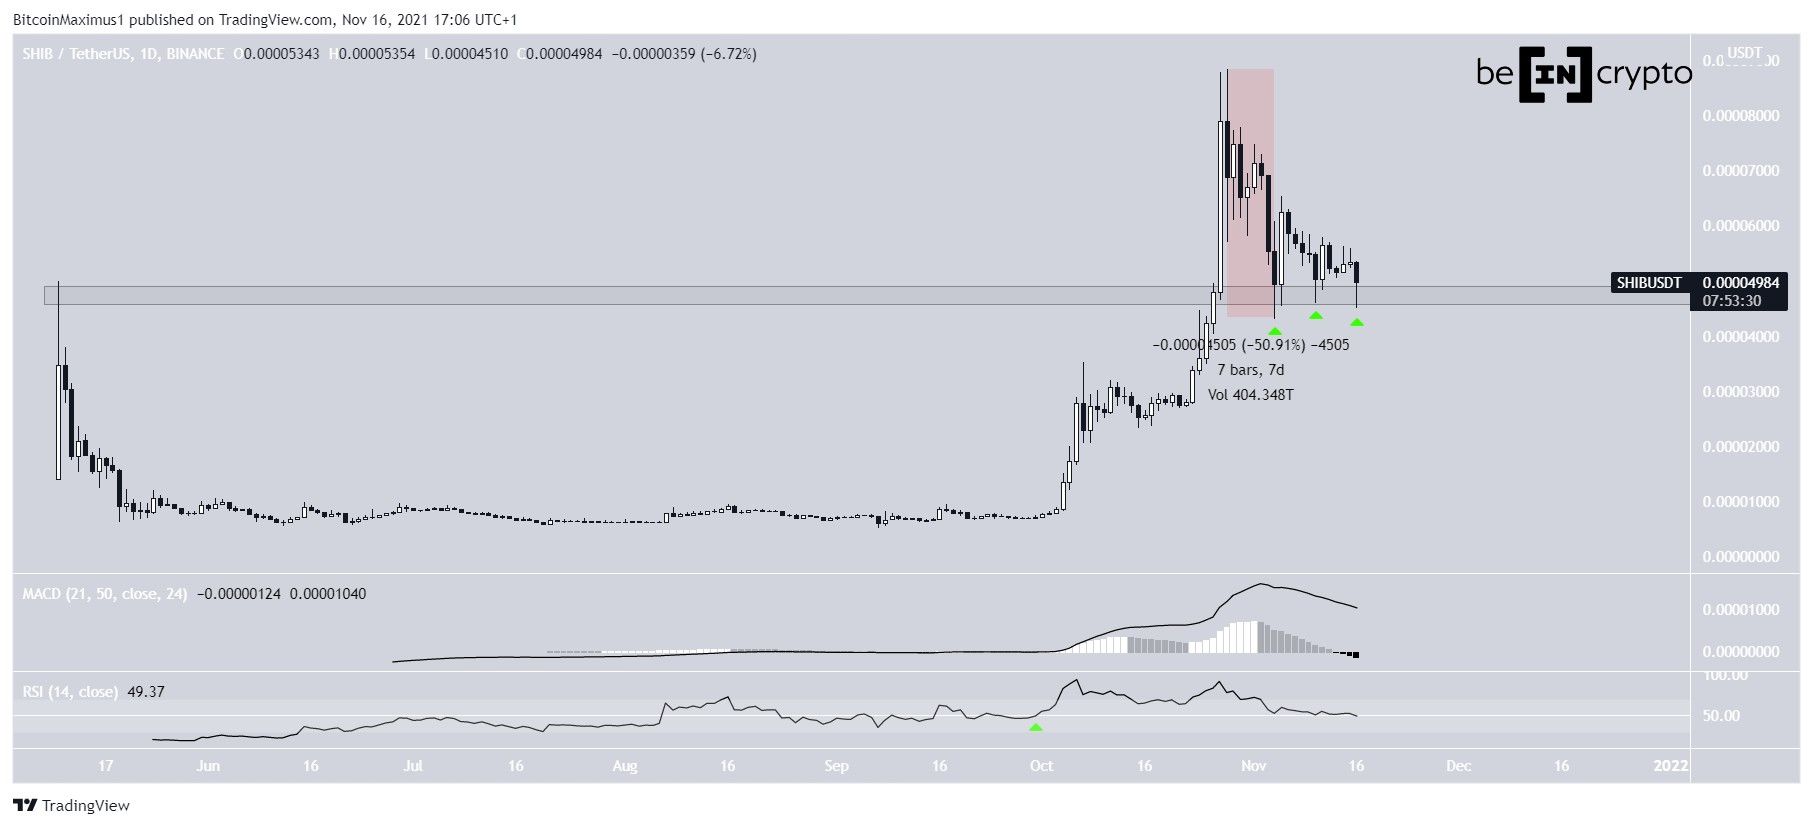
Shiba Inu (SHIB) has seemingly found support at its previous all-time high resistance area but has failed to initiate any sort of upward movement.
SHIB has been decreasing since it reach an all-time high price of $0.00008800 on Oct 28. The decrease has been sharp and led to a low of $0.00043 on Nov 4. This amounted to a decrease of more than 50% in only seven days.
However, it has bounced three times above the $0.00008800 horizontal support area. These rebounds have been crucial since the area previously acted as the all-time high resistance. Therefore, the fact that it’s now purportedly acting as support is a bullish sign.
However, technical indicators are bearish. The MACD, which is created by short and long-term moving average (MA) is moving downwards. This means that the short-term MA is deaccelerating relative to the long-term one. It’s a sign that’s usually associated with the beginning of downward trends.
The RSI, which is a momentum indicator, is at risk of falling below 50. Crosses above and below 50 are considered benchmarks of bullish/bearish trends. The previous cross above 50 (green icon) transpired on Oct 1 and preceded the entire rally to the new all-time high price.
Current resistance
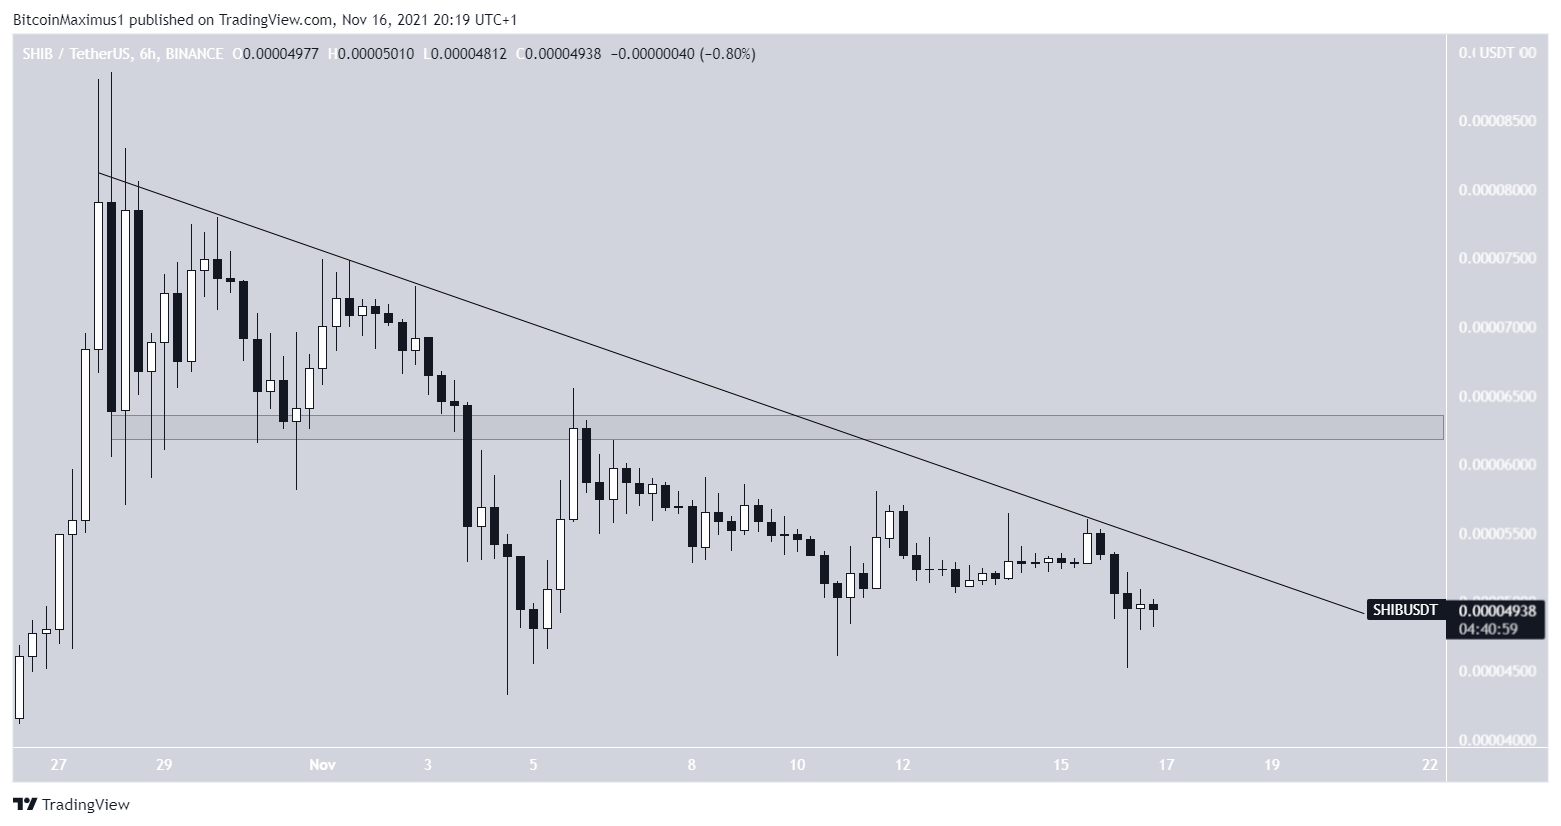
Shiba Inu short term outlook
The six-hour chart shows that SHIB is following a descending resistance line, and has been doing so since the all-time high of Oct 28.
As long as it is doing so, the correction cannot be considered complete.
If a breakout were to occur, the closest resistance would be found at $0.00006200.
At the current time, there are no signs pointing to a potential breakout.
SHIB wave count
Cryptocurrency trader @Mesawine1 outlined a SHIB chart, stating that SHIB has completed its impulse and is now correcting.
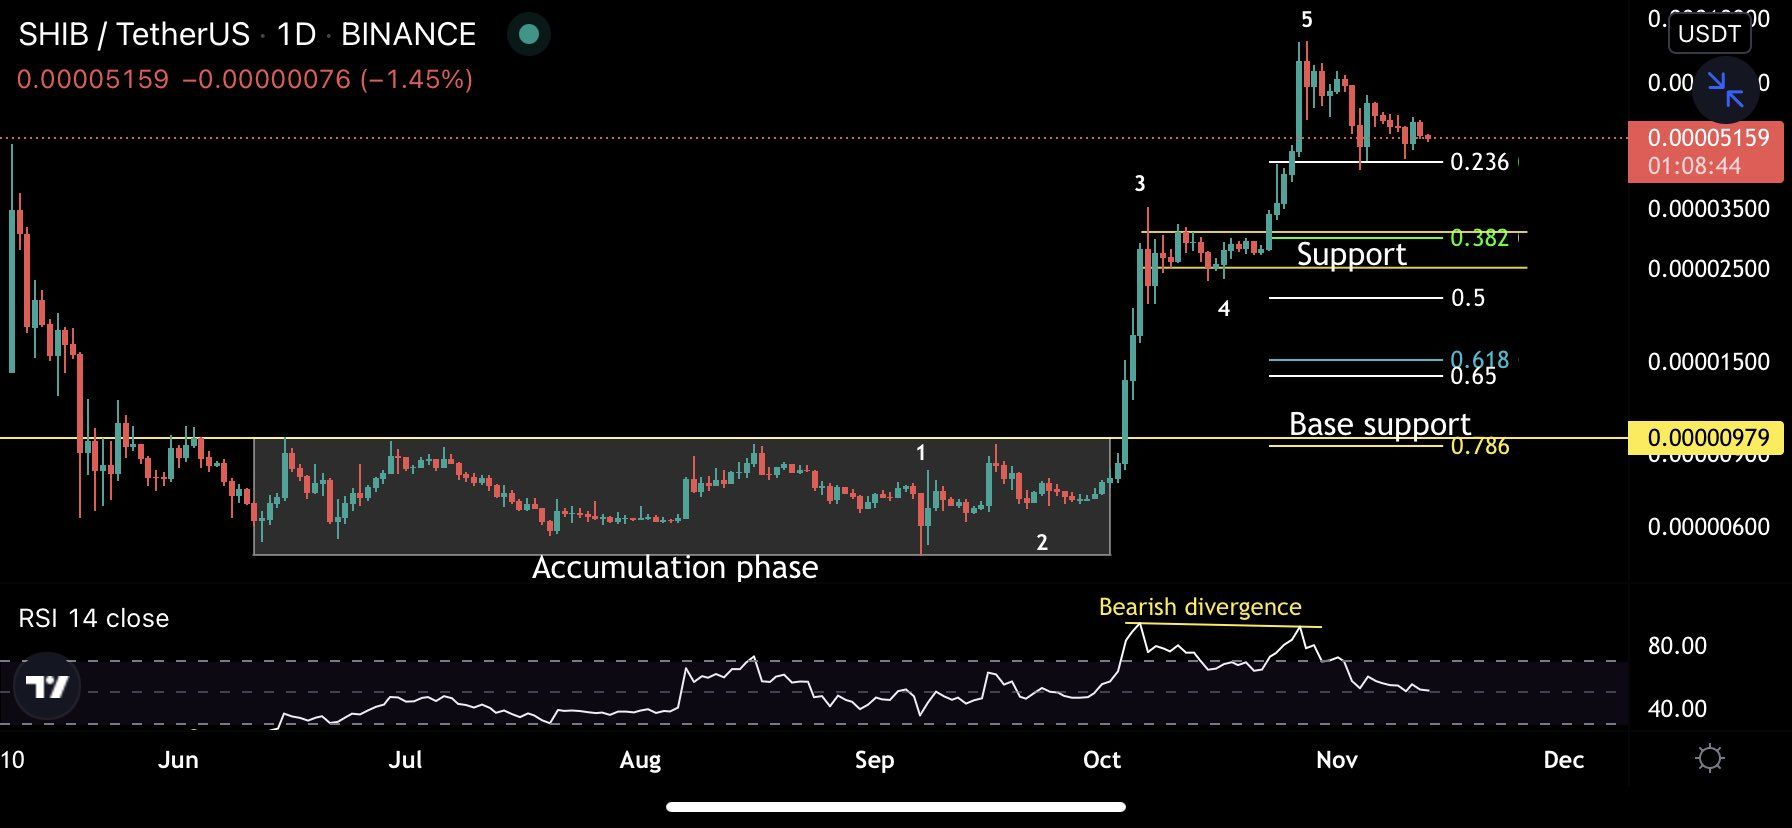
Potential wave count
When looking at the movement since September, there is a five-wave upward movement that led to the all-time high price of $0.00008800. If correct, it would mean that the upward move is complete, and SHIB is now correcting.
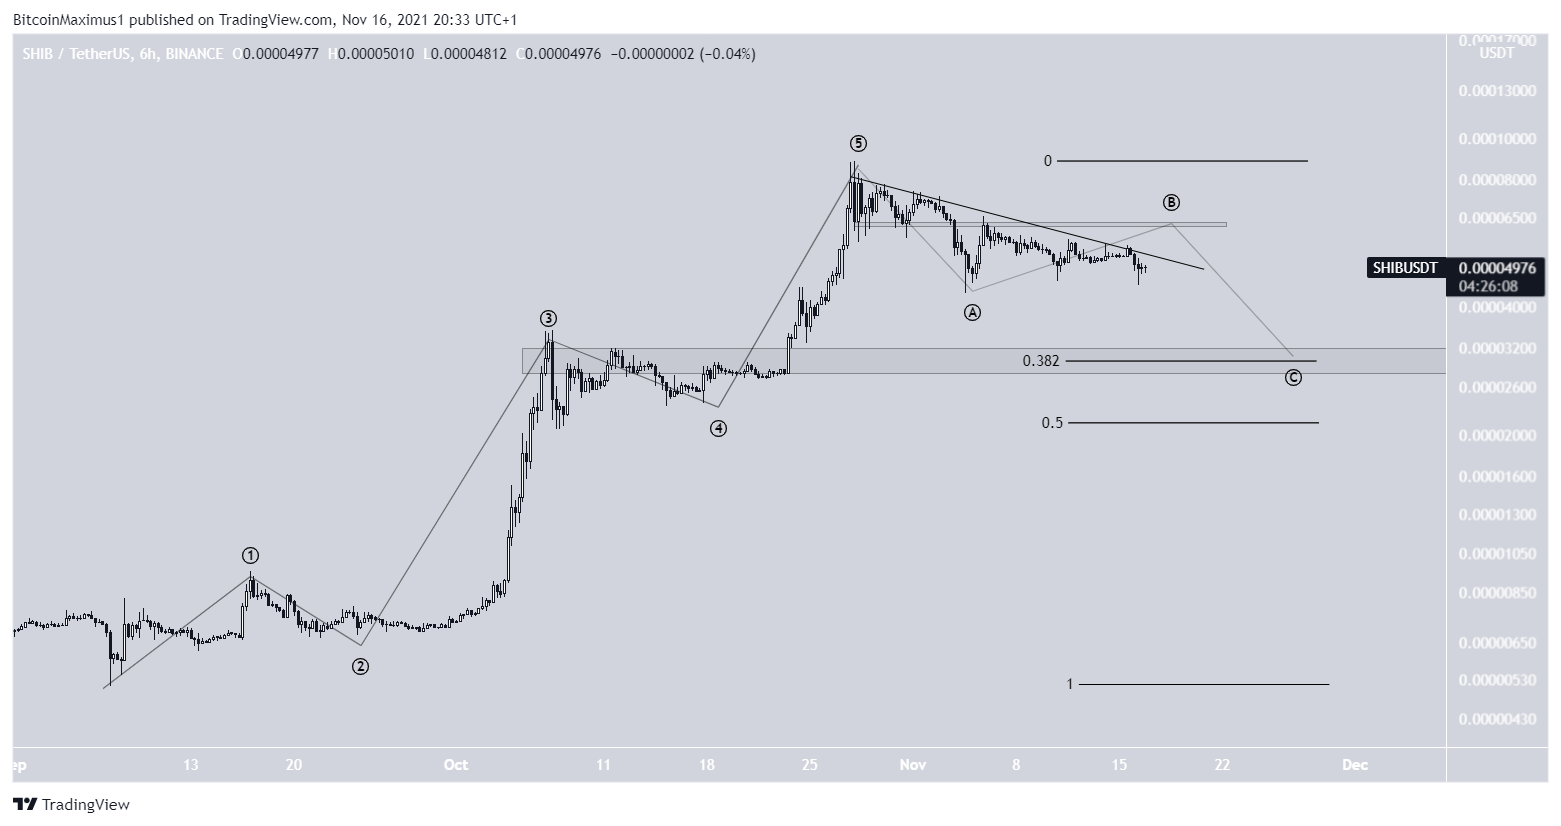
In this possibility, SHIB is only in the B wave of an A-B-C corrective structure.
Therefore, even if the potential short-term breakout were to occur, it would likely lead to a lower high and another downward move.
The first significant support area is at $0.00003000, which is the 0.382 Fib retracement support level and a horizontal support area.
For BeInCrypto’s latest Bitcoin (BTC) analysis, click here.
