


The Shiba Inu (SHIB) price trades in a short-term bullish pattern, a breakout from which would also validate the legitimacy of a previous longer-term breakout.
Although the Shiba Inu (SHIB) price previously experienced a breakout, it is currently facing difficulties in maintaining its upward momentum. Looking at the daily time frame, there are conflicting signals.
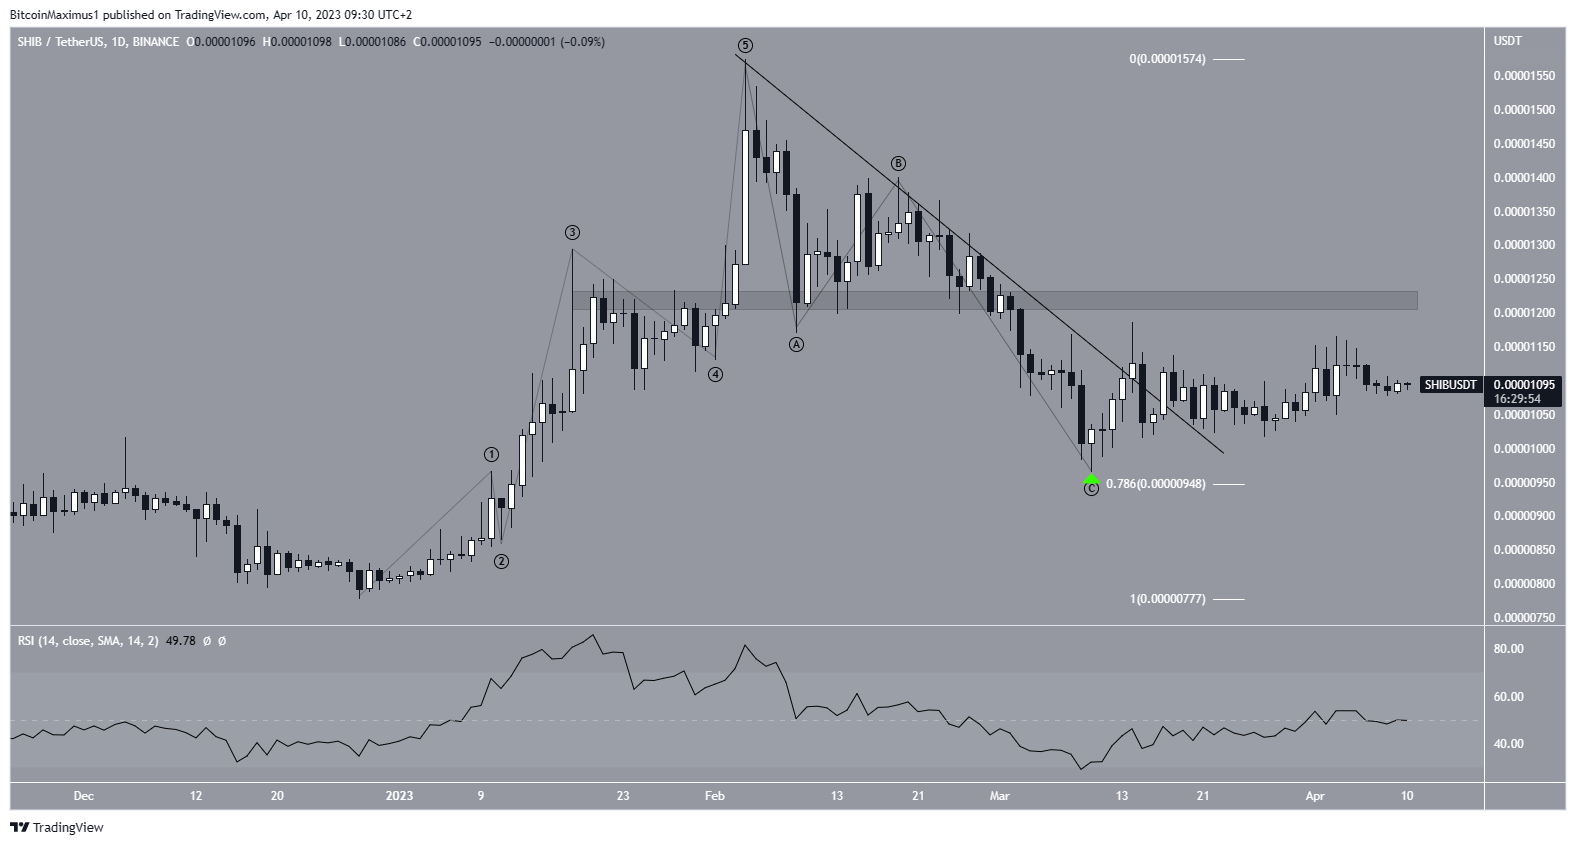
On one hand, the price broke through a long-term descending resistance line that had been present since February and completed an A-B-C correction while remaining under this resistance line. The correction ended at the 0.786 Fib retracement support level and the daily RSI rose above 50 on April 1. Despite these positive indicators, the SHIB price was unable to maintain its upward movement after the breakout. Additionally, it did not reach the nearest resistance at $0.0000123. It is currently trading close to pre-breakout levels, which is seen as a sign of weakness. Moreover, long upper wicks characterize the price action.
If the SHIB price drops below the 0.786 Fib level, it could potentially decline to $0.0000077.
Shiba Inu (SHIB) Price Prediction for April: Will Bullish Pattern Lead to Breakout?
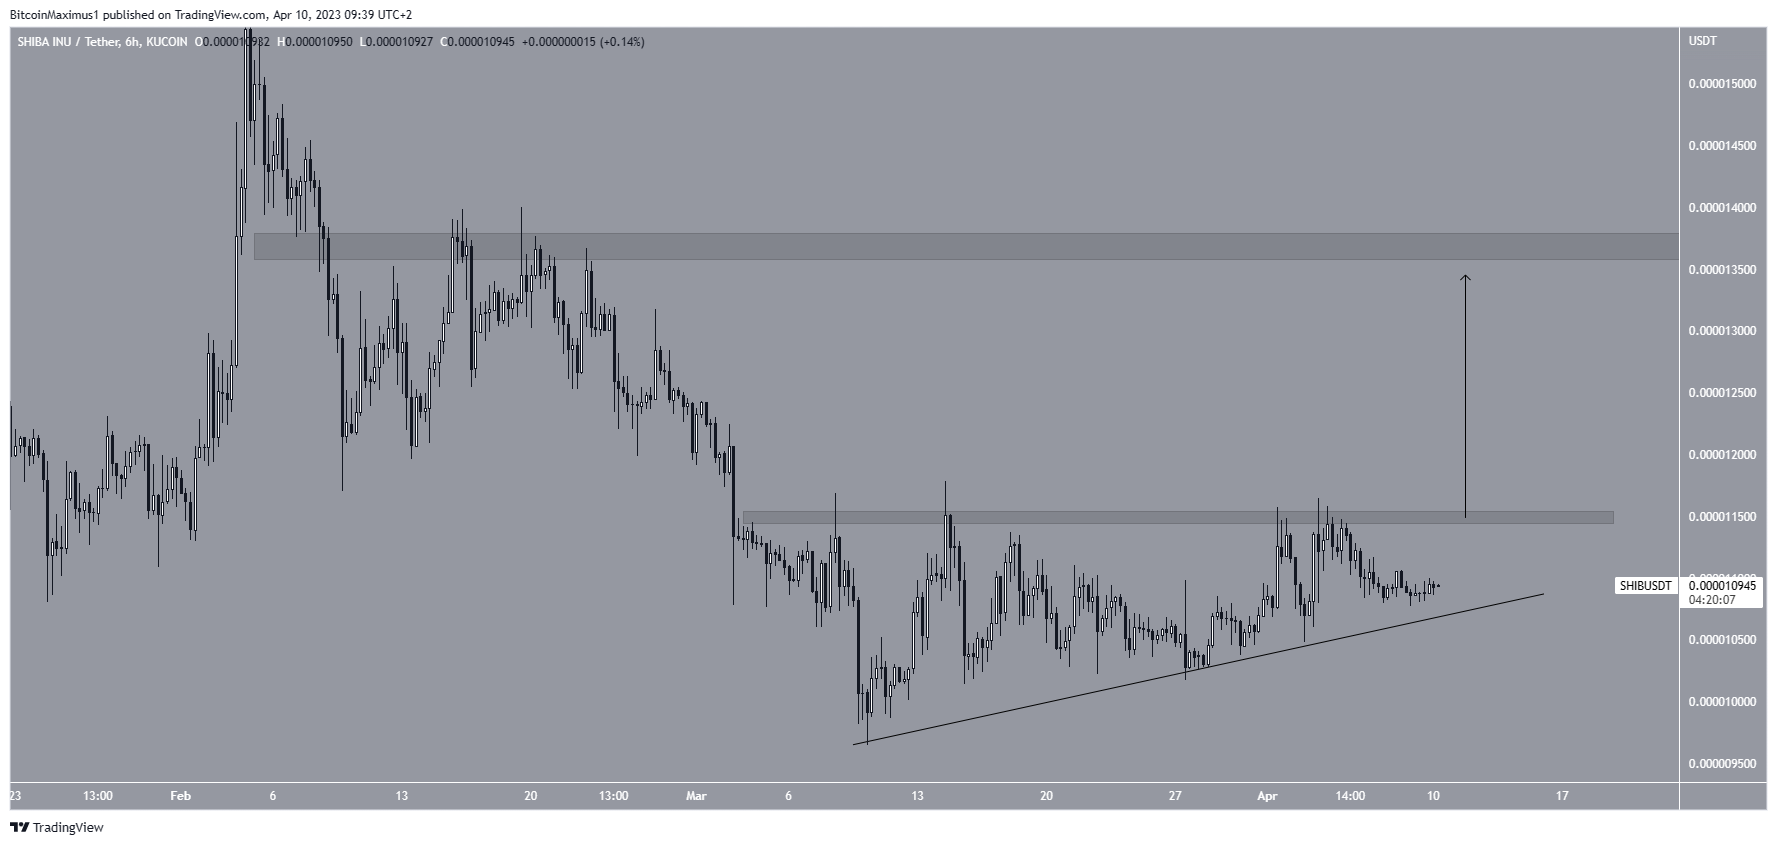
The short-term six-hour time frame technical analysis supports the possibility of a breakout and continuation of the upward movement. As a result, it gives a bullish SHIB price prediction for April. The reason for this is the creation of an ascending triangle, which is considered a bullish pattern.
The SHIB price is close to the pattern’s support line, suggesting that a bounce is expected over the next 24 hours. A close above the $0.0000115 resistance area would confirm the breakout. An upward movement that travels the entire height of the pattern would take the SHIB price to $0.0000137, moving above the previously outlined resistance area and reaching the wave B high.
Conversely, a close below the ascending support line would invalidate the bullish outlook for the price of Shiba. In that case, SHIB could drop to $0.0000077.
To conclude, the most likely SHIB price forecast is a breakout from the short-term triangle and an increase toward at least $0.0000125 and possibly $0.0000137. This bullish analysis would be invalidated by a close below the short-term ascending support line and could cause a drop to $0.000077.
For BeInCrypto’s latest crypto market analysis, click here.


