


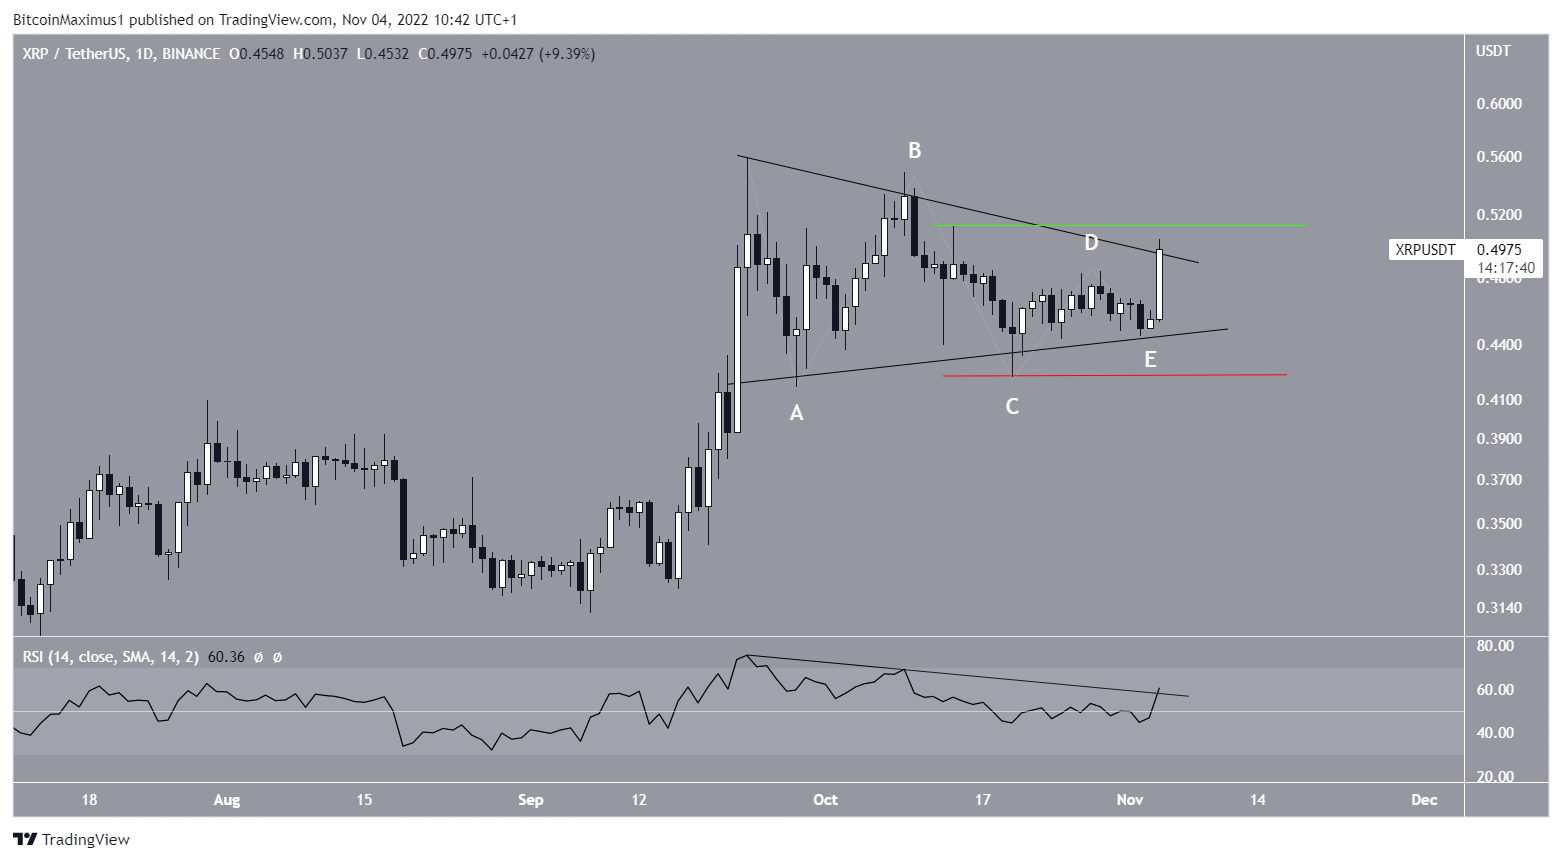
The XRP price is in the process of breaking out from a symmetrical triangle. An increase above $0.51 would confirm the breakout.
The XRP price has decreased inside a symmetrical triangle since Sept. 23. The symmetrical triangle is considered a neutral pattern. Therefore, a price breakdown and breakout are both possible.
On Nov. 2, after bouncing at the support line for the third time, the XRP price initiated a significant upward movement. The rate of increase accelerated over the past 24 hours, leading to a high of $0.503. Since there is no positive Ripple news, it seems that the pump alone is causing the price action.
An increase above $0.51 (green line) would confirm that the trend is bullish while a fall below $0.42 (red line) would invalidate the bullish hypothesis.
XRP Price Prediction: Is $0.58 in Sight?
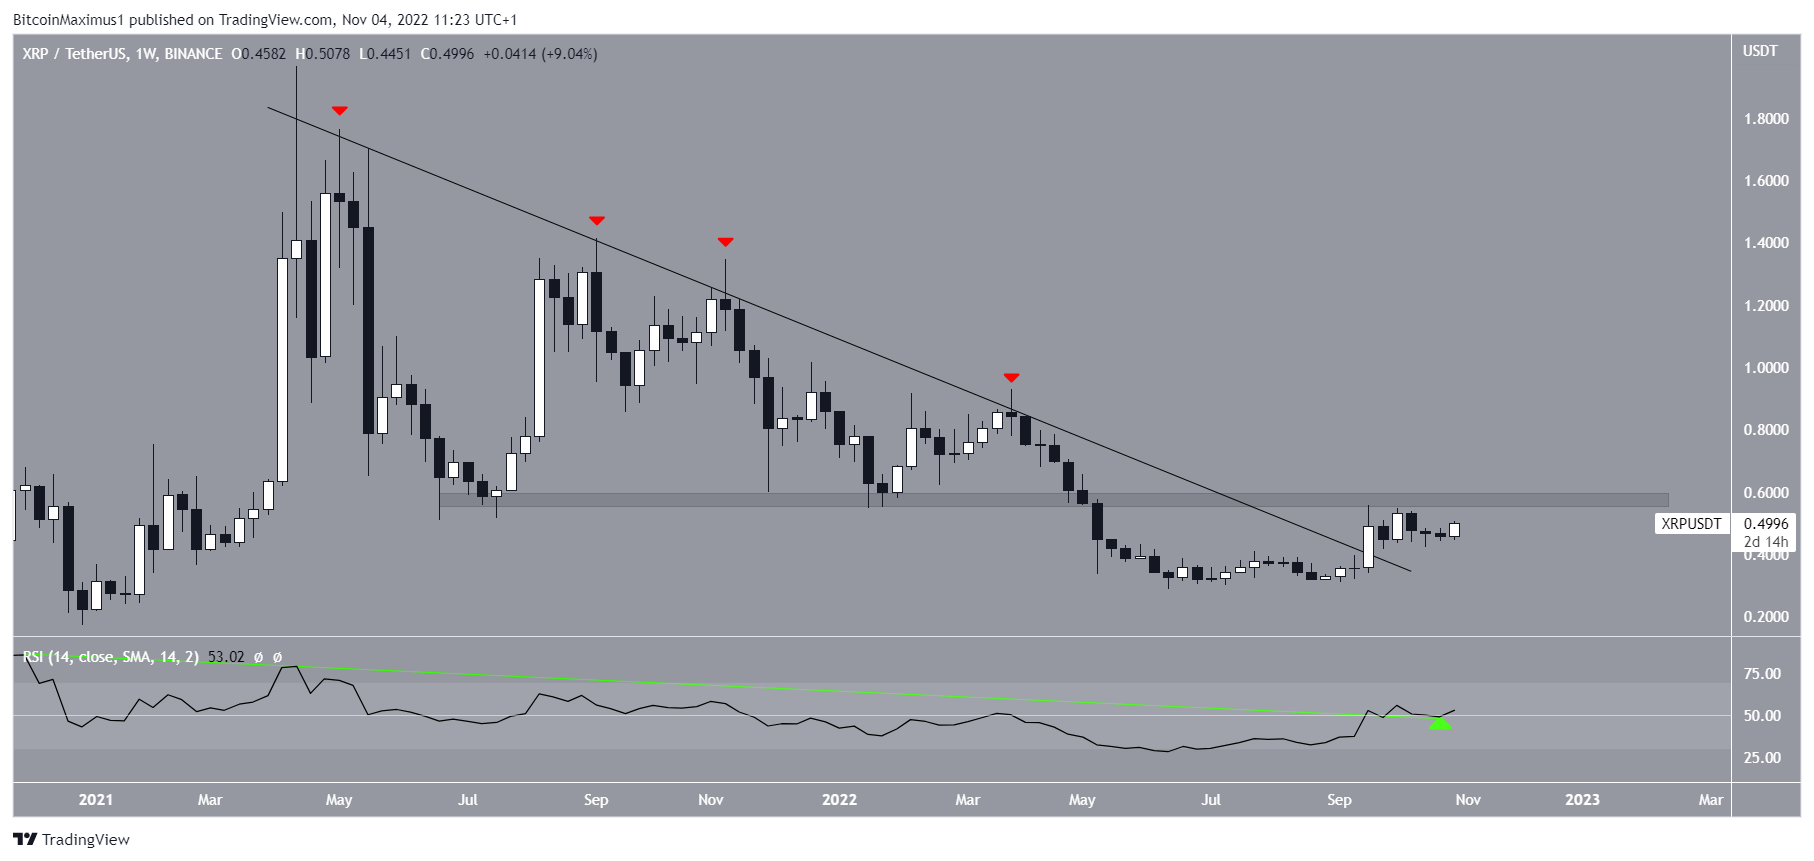
In order to find the potential for the ensuing increase, a look at the weekly chart is required. The chart shows that the price has broken out from a long-term descending resistance line that had been in place since the April 2021 highs.
The RSI also validated the price movement breakout, which has broken out from its bearish divergence trend line (green line). Additionally, the indicator has moved above 50.
The closest resistance area is at $0.58. If the Ripple price successfully moves above it, the upward movement could accelerate significantly due to the lack of further resistance. The technical analysis readings from the weekly and daily charts support this.
As outlined above, a decrease below $0.42 would invalidate the bullish XRP price prediction.
For the latest BeInCrypto Bitcoin (BTC) and crypto market analysis, click here
Disclaimer: BeInCrypto strives to provide accurate and up-to-date information, but it will not be responsible for any missing facts or inaccurate information. You comply and understand that you should use any of this information at your own risk. Cryptocurrencies are highly volatile financial assets, so research and make your own financial decisions.
