


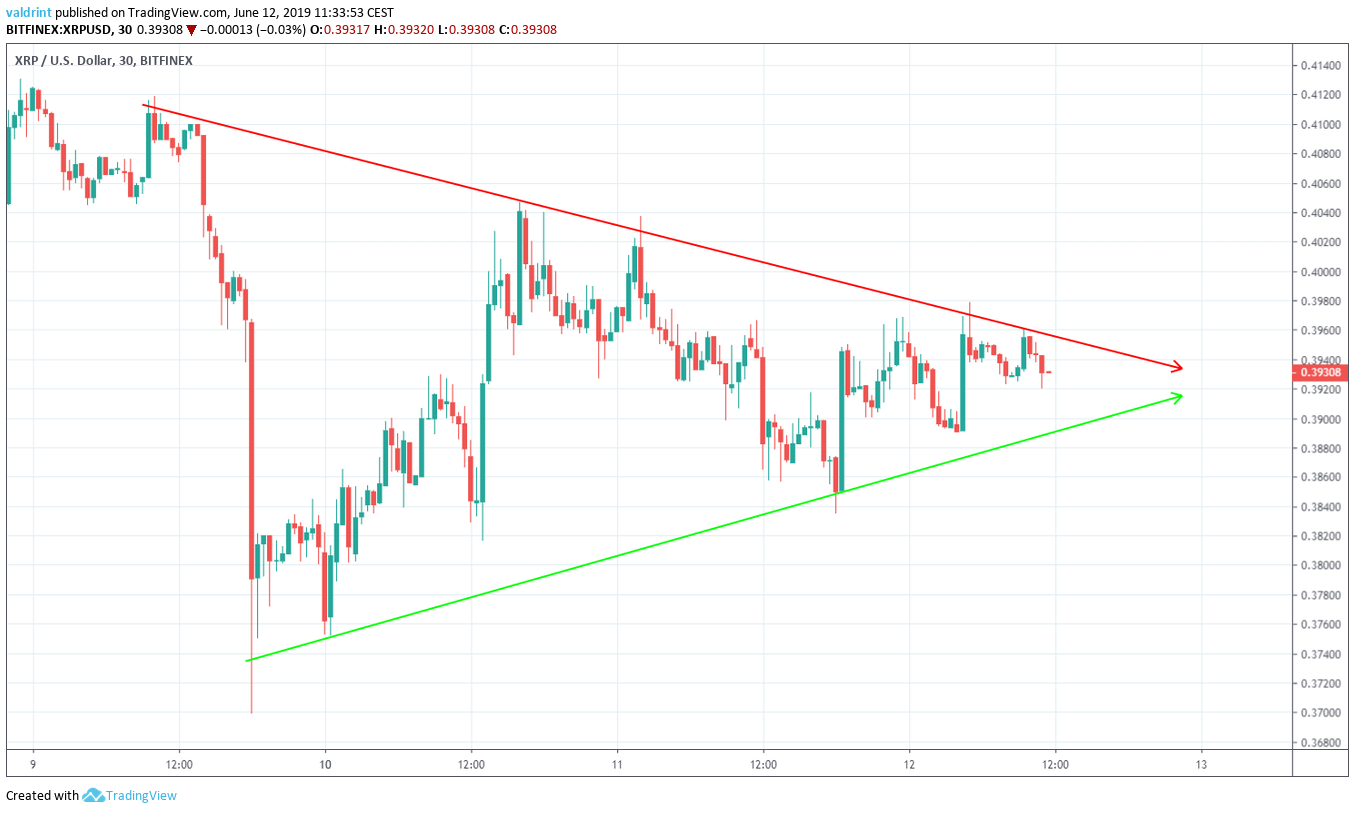
On June 9, 2019, the Ripple price (XRP) reached a high of $0.41. A rapid decrease ensued and the price reached a low of $0.37 the same day. Since then, the price has been gradually increasing.

At the time of writing, it was trading near $0.39.
Where will the Ripple price (XRP) go next? Keep reading below and find out. For our previous analysis, click here.
Ripple Price (XRP): Trends and Highlights for June 12
- XRP/USD reached a low on June 9.
- It is trading inside a short-term symmetrical triangle.
- It is trading inside a longer-term descending channel.
- The 10- and 20-day moving averages have made a bearish cross.
- There is resistance near $0.43.
- There is support near $0.36.
XRP Price: Current Pattern
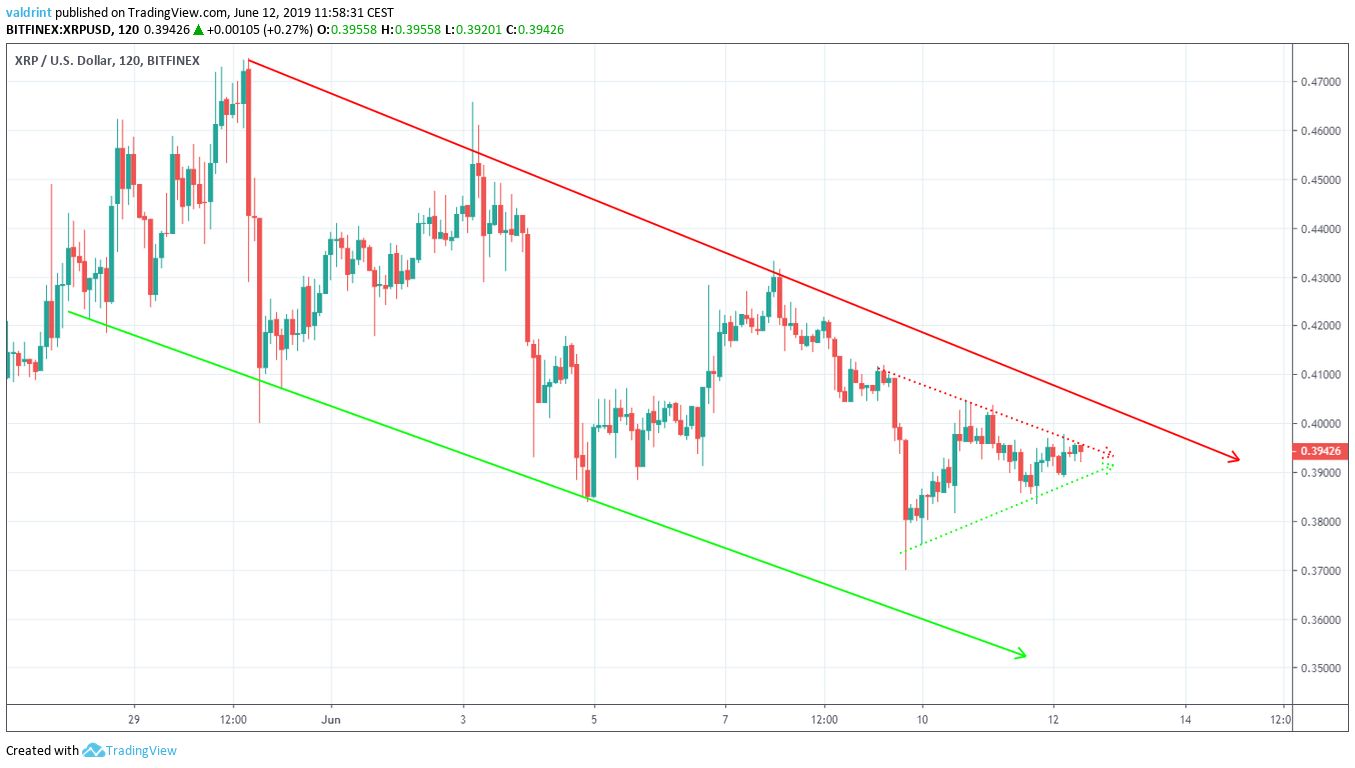
The resistance lines of the triangle and channel are close to each other. Therefore, a breakout from the triangle could also indicate a breakout from the slightly longer term channel.
Will the price initiate an upward move? A look at technical indicators is required in order to find out.
Moving Averages
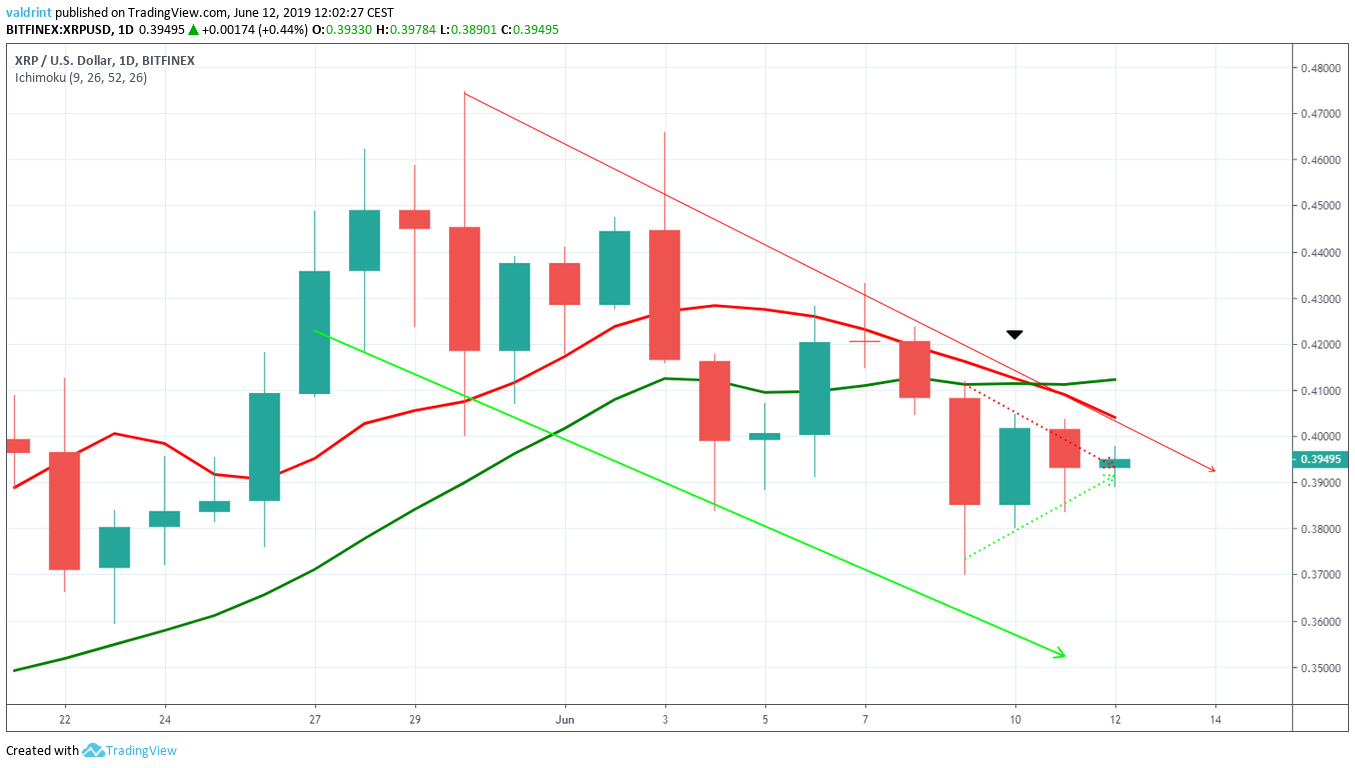
The XRP price is trading below both moving averages, facing very close resistance from the 10-day MA. Furthermore, the latter coincides with the resistance line of the descending channel.
The use of these indicators makes it unlikely that the price will break out from the channel.
However, it is possible that the price initiates a weak breakout from the short-term symmetrical triangle towards the resistance line of the channel.
Reversal Areas
One support and one resistance area are traced for XRP below.
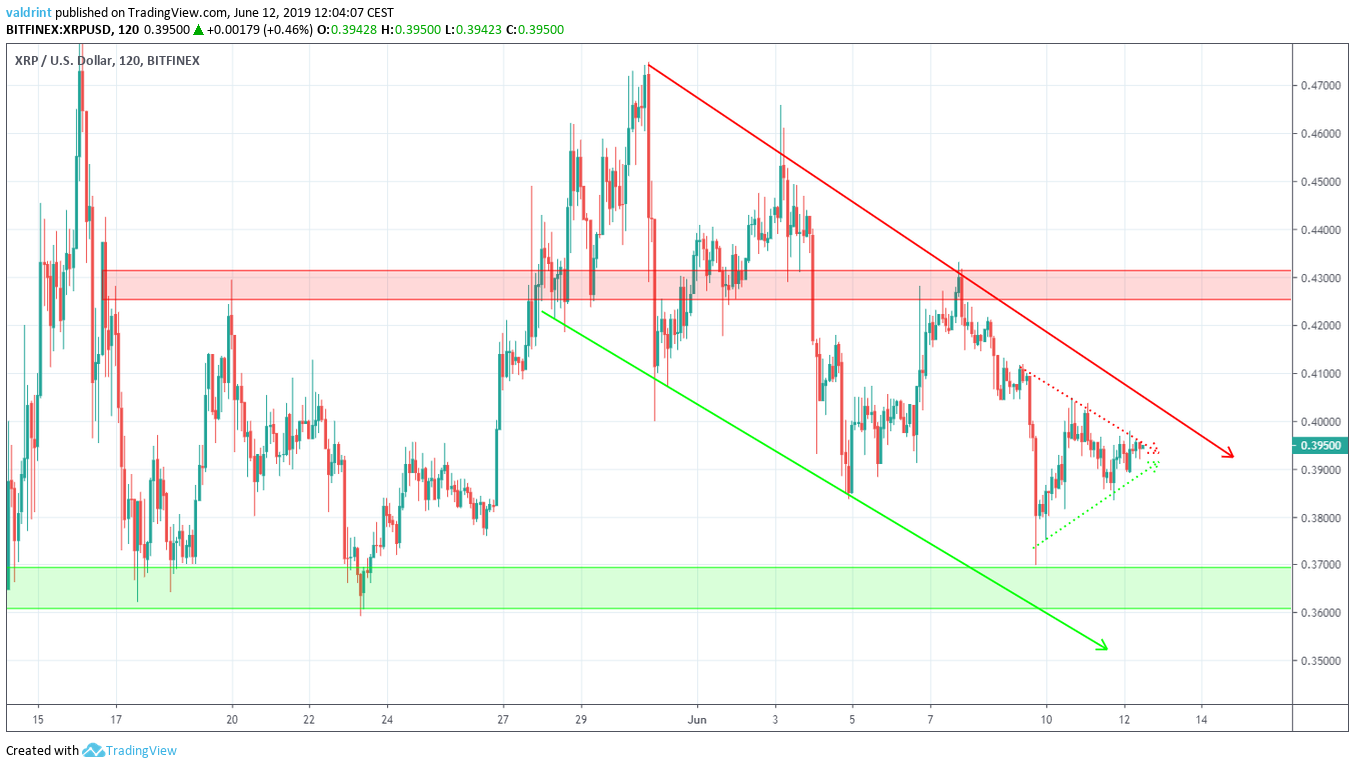
The closest support area is found near $0.36. If the Ripple price (XRP) continues to decrease at the rate predicted by the channel, it will reach this area around June 15. An analysis of technical indicators supports this possibility.
The closest resistance area is found near $0.43. If the XRP price breaks out from the channel, it is likely to provide a reversal.
Summary
To conclude, the Ripple price (XRP) made a high on May 30 and is currently trading inside a descending channel. Furthermore, it is trading inside a short-term symmetrical triangle.
An analysis of technical indicators suggests that a downtrend has begun. The use of these indicators makes it likely that the XRP price will eventually reach the support area outlined above.
Do you think the Ripple price (XRP) will reach the support area? Let us know in the comments below.
Disclaimer: This article is not trading advice and should not be construed as such. Always consult a trained financial professional before investing in cryptocurrencies, as the market is particularly volatile.


