


Reserve Rights (RSR) is trading inside a bullish pattern but has broken down from a long-term support level.
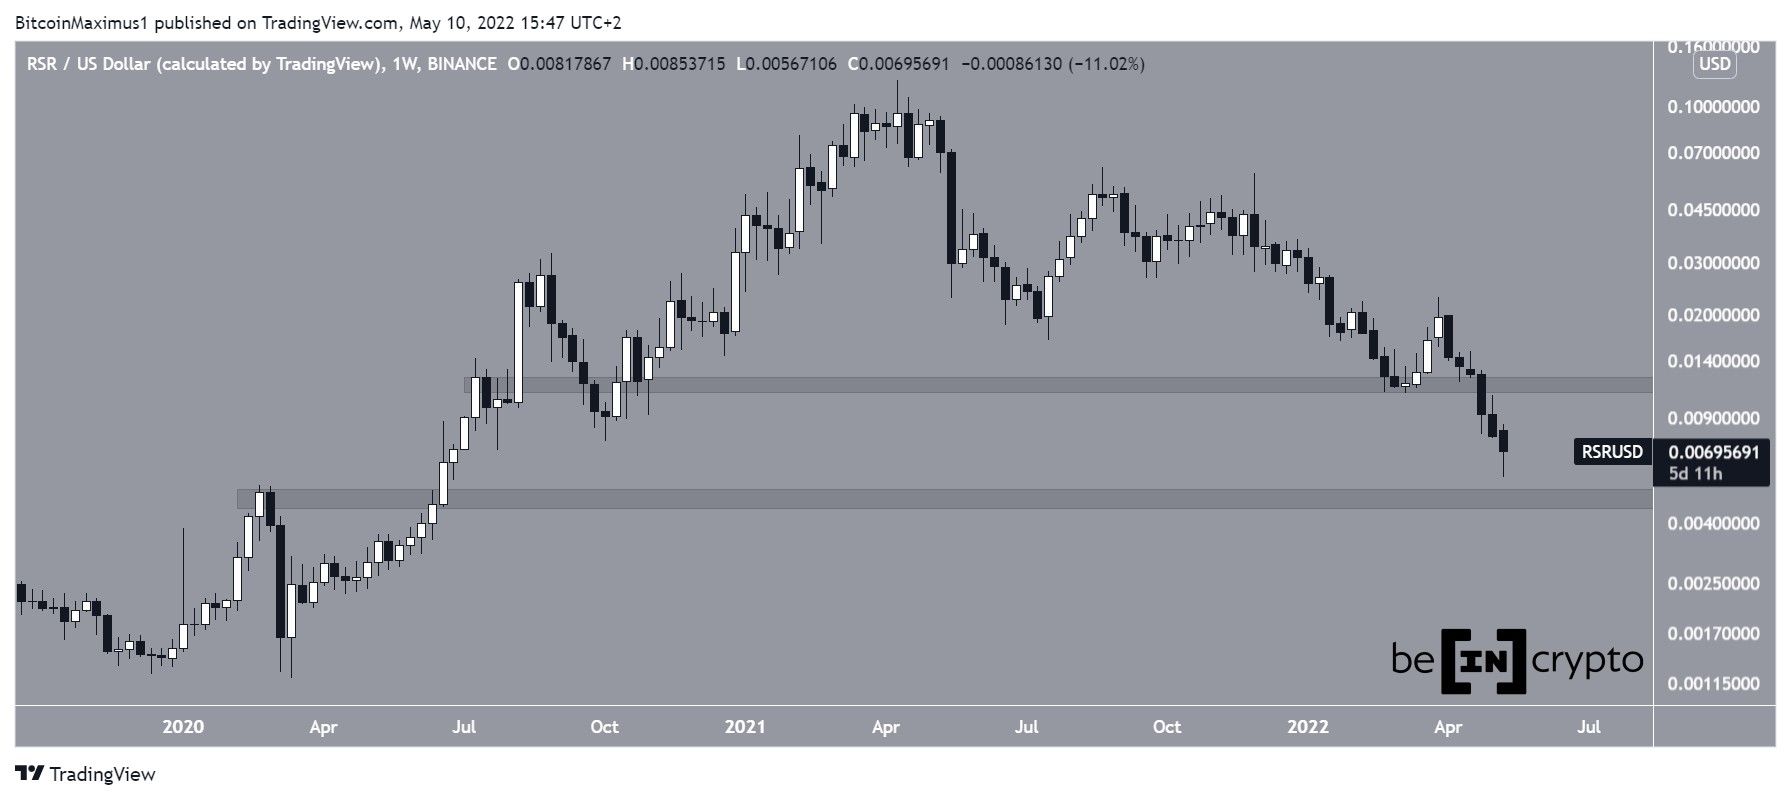
RSR has been falling since reaching an all-time high price of $0.119 on April 16, 2021. It created a lower high of $0.059 on Dec 2 before resuming its downward movement at a more accelerated rate.
At the end of April 2022, RSR broke down from the $0.012 support area, which had been in place since Oct. 2020. This was an extremely bearish development, due to the fact that such a long-term support level had failed to initiate a bounce.
Measuring from the all-time high, the price has fallen by 94%.
If the downward movement continues, the next closest support area would be at $0.0045, created by the 2020 highs.
Potential Breakout?
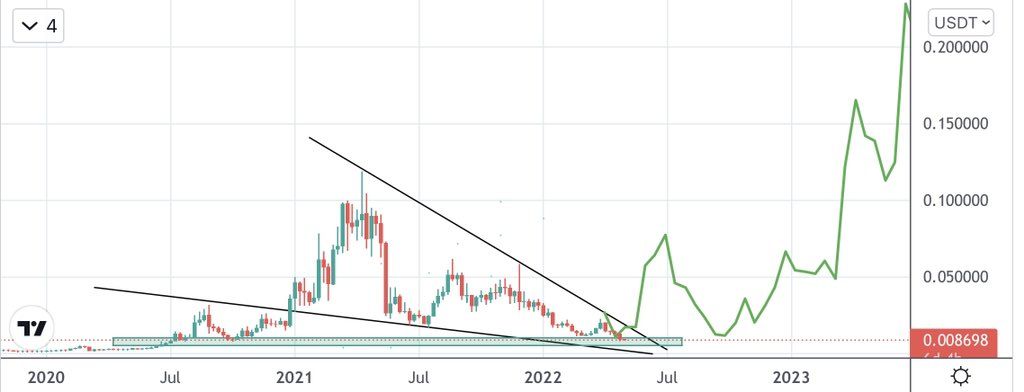
Altcoin trader @SATOSHIHUSTLE stated that RSR could break out from its long-term descending wedge.
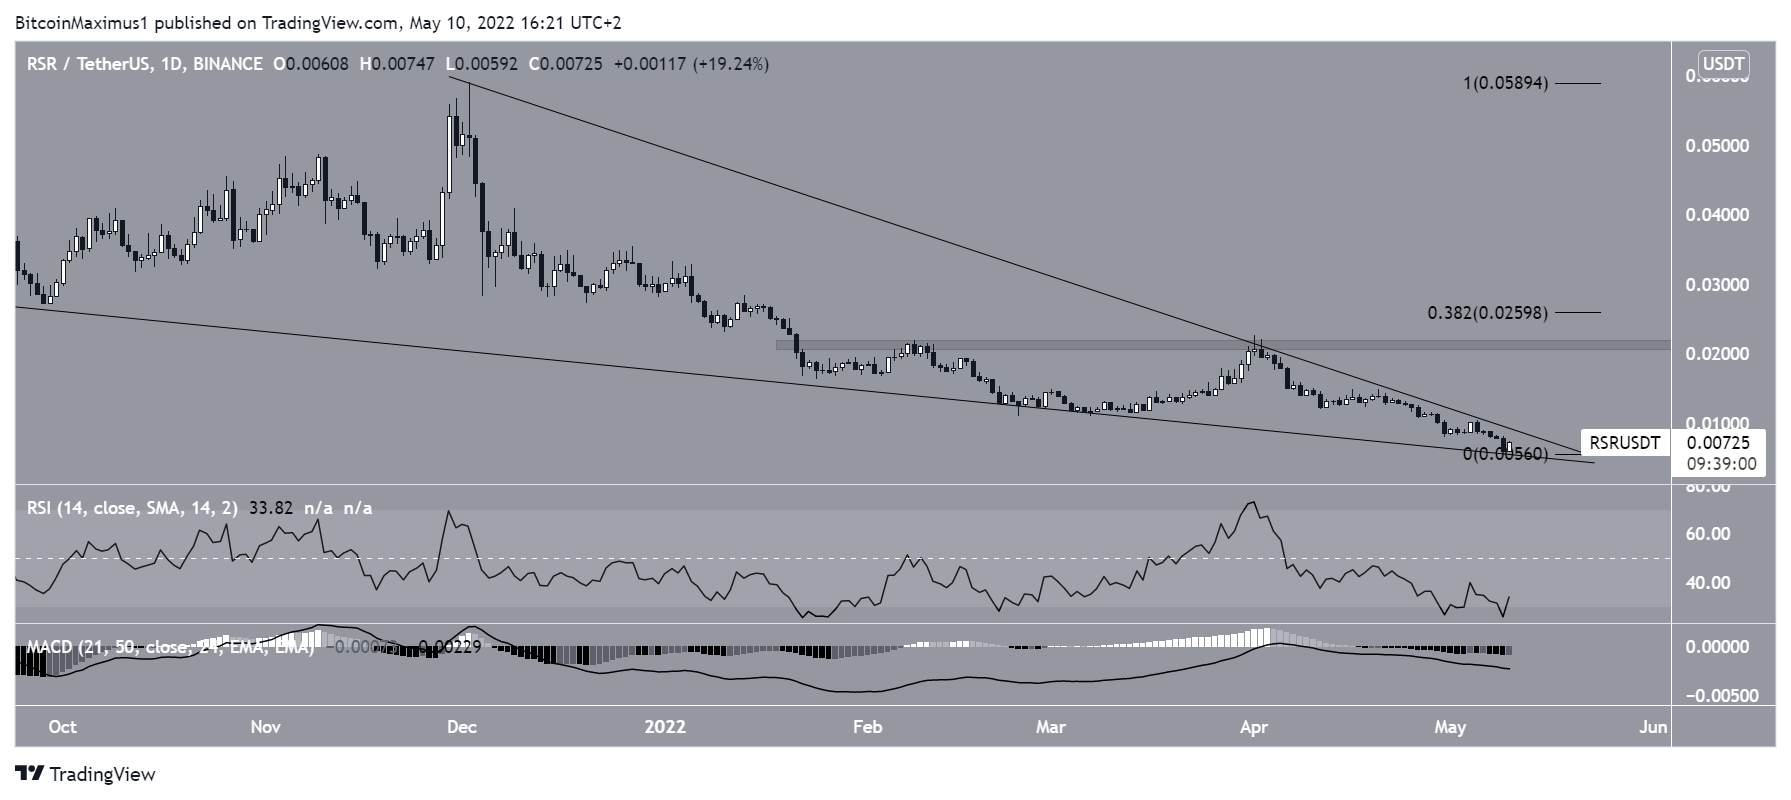
The daily chart shows that RSR is still trading inside the same descending wedge, currently being very close to the end of the pattern.
Even though the descending wedge is considered a bullish pattern, technical indicators do not yet provide any bullish signs, since both the RSI and MACD are falling.
While the RSI is oversold, it has not generated any bullish divergence. Without it, the potential of a bullish reversal remains unconvincing.
If however, a breakout were to occur, the first resistance area would be at $0.021.
RSR/BTC
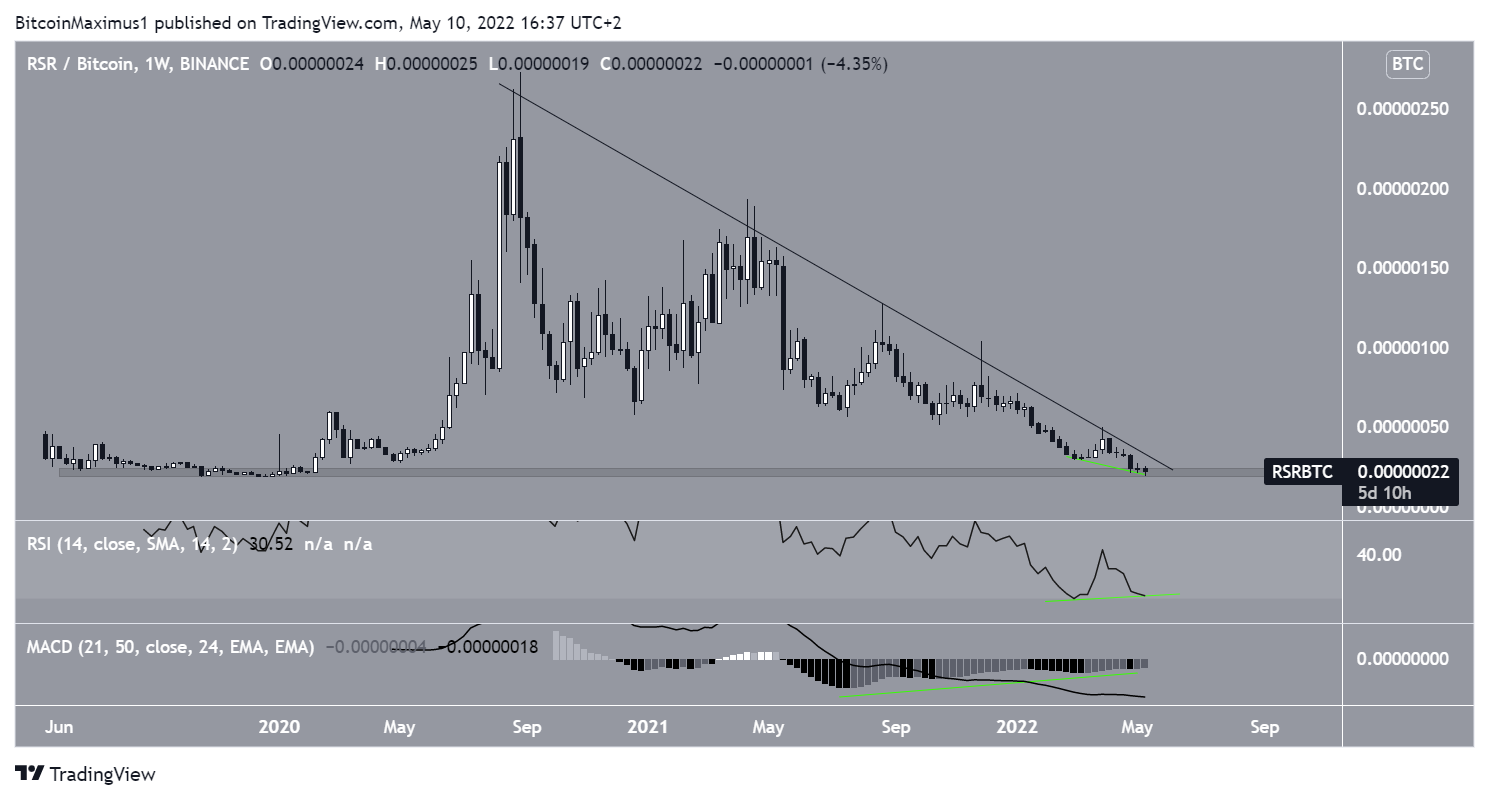
The RSR/BTC chart is less bearish than its USD counterpart for two main reasons.
Firstly, RSR is still trading above the 20 satoshi support area, which has been in place since 2020.
Secondly, both the RSI and MACD have generated bullish divergences.
Therefore, it is still possible that RSR will break out from the long-term resistance line and initiate an upward movement.
For BeInCrypto’s latest Bitcoin (BTC) analysis, click here


