


Reserve Rights (RSR) is likely nearing the bottom of its downward movement but could sweep its September lows prior to reversing.
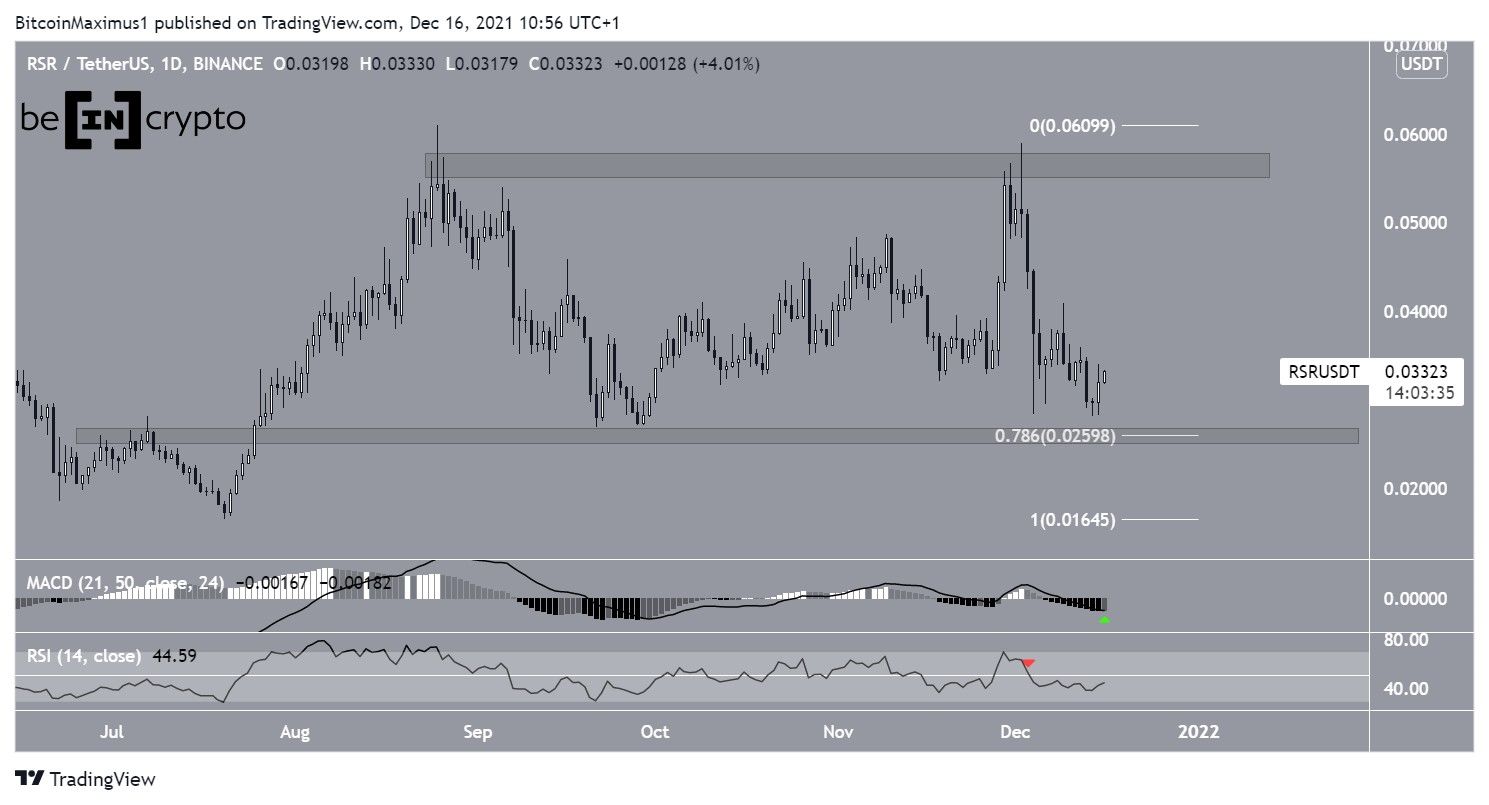
On Dec 2, RSR reached a high of $0.059 and fell, leaving a long upper wick in place. The rejection served to validate the $0.057 area as support. Previously, the same area rejected it on Aug 25.
The price of RSR has been decreasing since then and fell to a low of $0.028 on Dec 14.
While it has bounced slightly, technical indicators are still bearish.
The MACD, which is created by short and long-term moving averages (MA), is negative and decreasing. This is a bearish sign that means the short-term MA is slower than the long-term average. While it’s in the process of creating a higher momentum bar (green icon), it’s still way too early to call a reversal.
The RSI, which is a momentum indicator, is below 50 (red icon). This is also considered a sign of bearish trends.
The main support area is found at $0.026. This is the 0.786 Fib retracement support level and a horizontal support area, which is just below the September lows.
Wave count
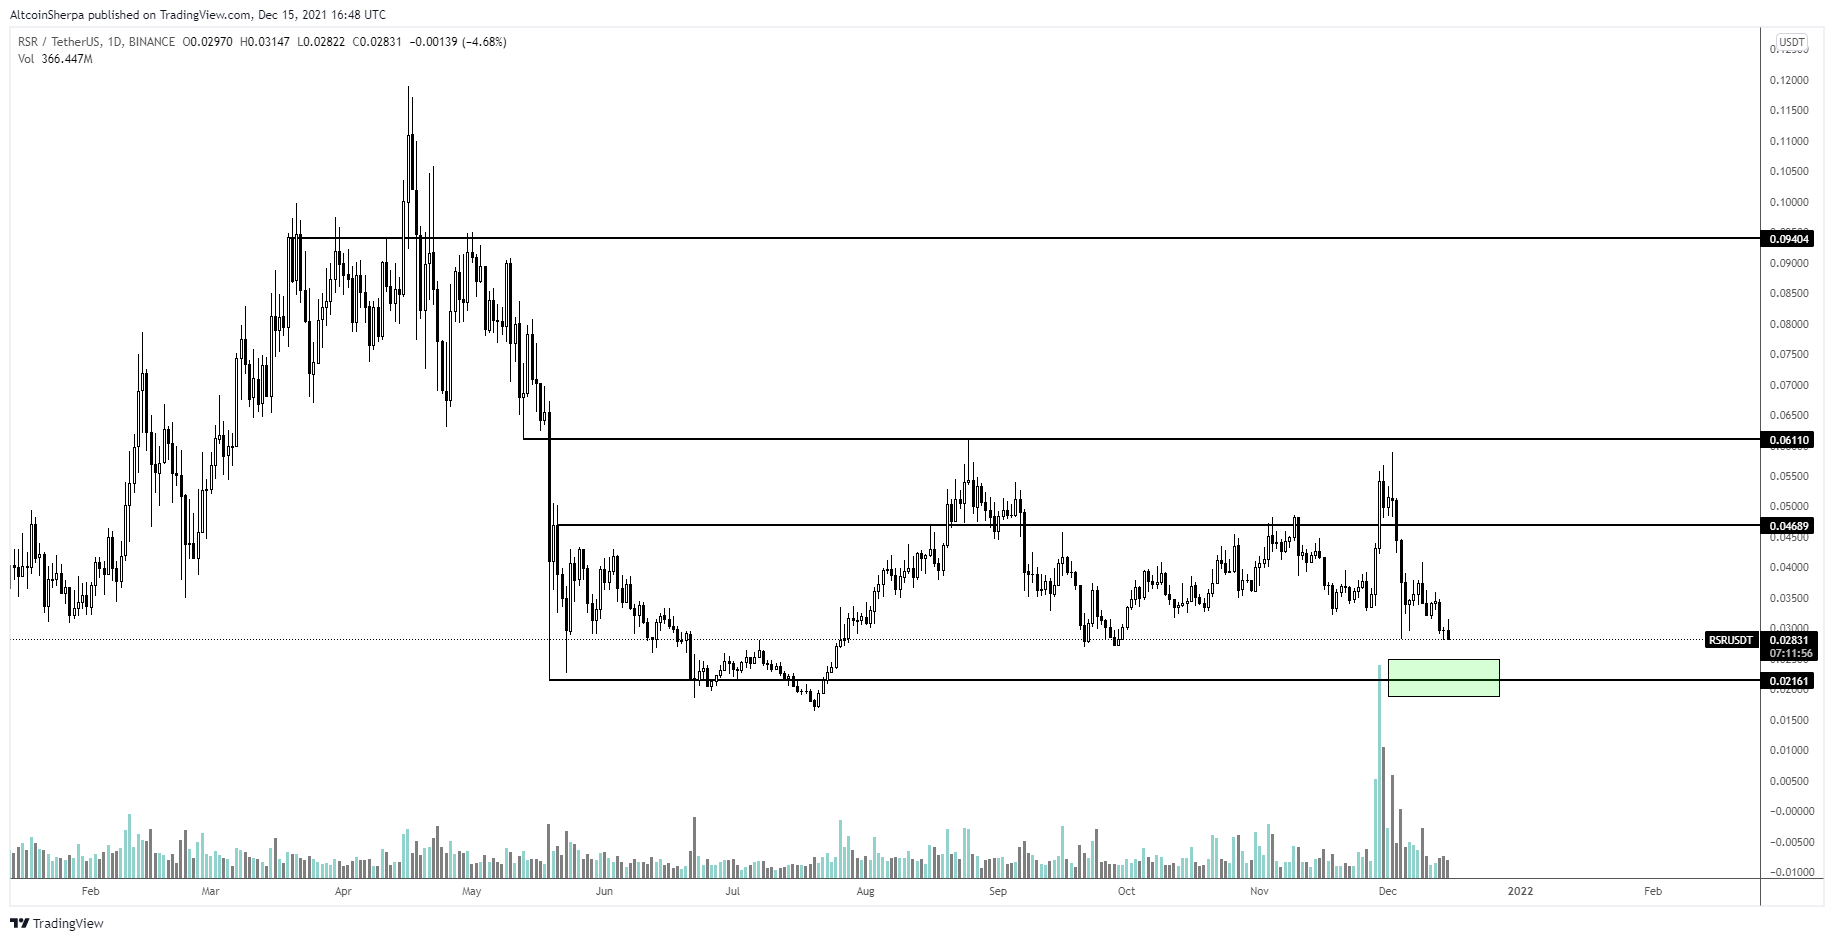
Cryptocurrency trader @Altcoinsherpa tweeted an RSR chart, stating that it’s likely to fall to the $0.02 support.
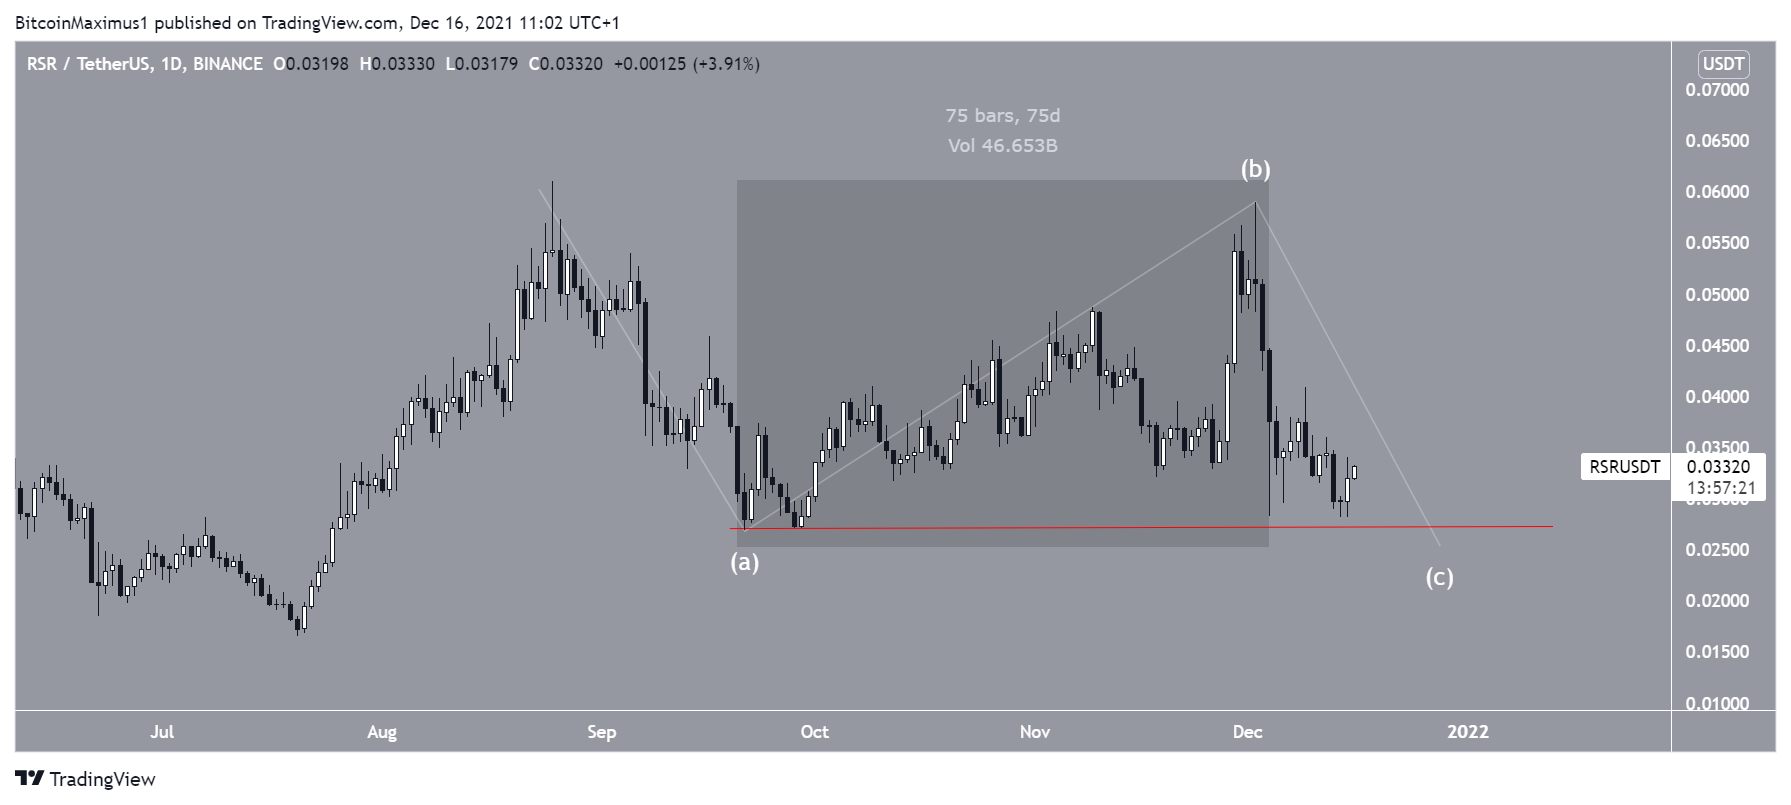
Due to the considerable overlap, the movement from Sept 22 to Dec 2 (highlighted) looks corrective. Therefore, it would make sense for it to be a part of a B wave, in an A-B-C corrective structure.
In this case, RSR would now be in the C wave.
A likely spot for the C wave to end would be just below the Sept lows (red line) at $0.031, creating a slightly lower low relative to the A wave. This would align with the target given in the tweet.
RSR/BTC
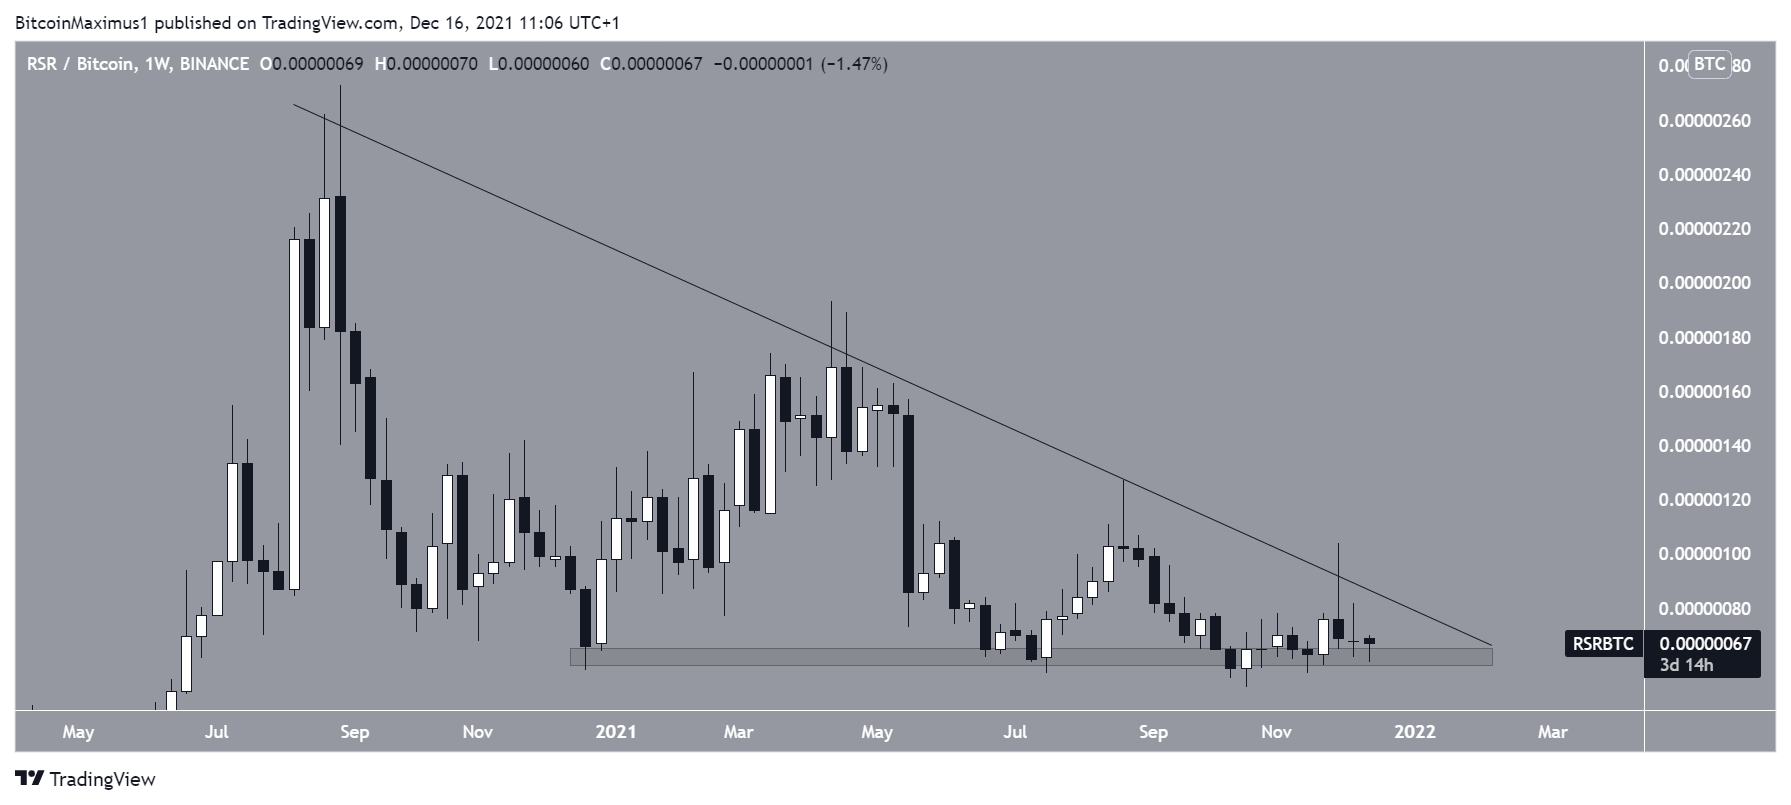
RSR/BTC has been decreasing beneath a descending resistance line since reaching an all-time high in August. On Oct 22, RSR/BTC reached a new yearly low of 51 satoshis.
However, it has bounced since and reclaimed the 60 satoshi horizontal support area.
Whether it breaks down below this area or breaks out from the descending resistance line will likely determine the direction of the future trend.
For BeInCrypto’s previous Bitcoin (BTC) analysis, click here


