


The Ren (REN) price is in the process of breaking out from the resistance area of a range that has been in place since the beginning of Sept.
The price will likely break out and continue moving upwards towards one of the two resistance areas outlined below.
Trading Range
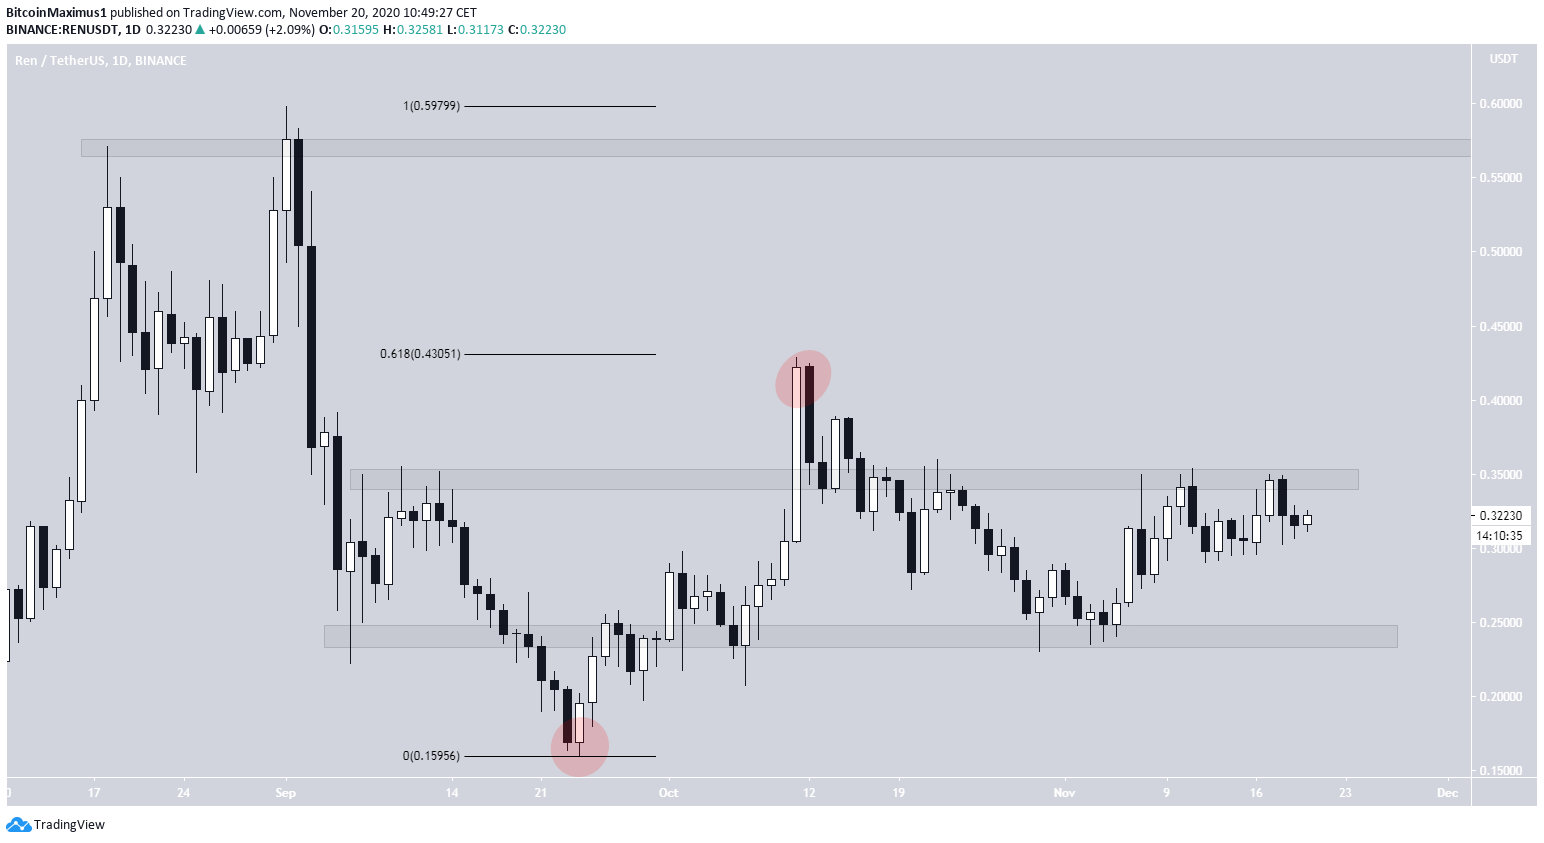
The REN price has been trading in a range between $0.24 and $0.35 since the beginning of Sept when a sharp drop caused it to fall from $0.60. The price deviated both above and below this area once (red circles), however, it returned inside the range afterward and has since respected both the support and resistance levels.
The rejected breakout occurred right at the 0.618 Fib retracement level of $0.43, which is a common resistance area. If the price were to break out, the $0.43 area would be likely to act as resistance again. The next significant resistance area is at $0.58.
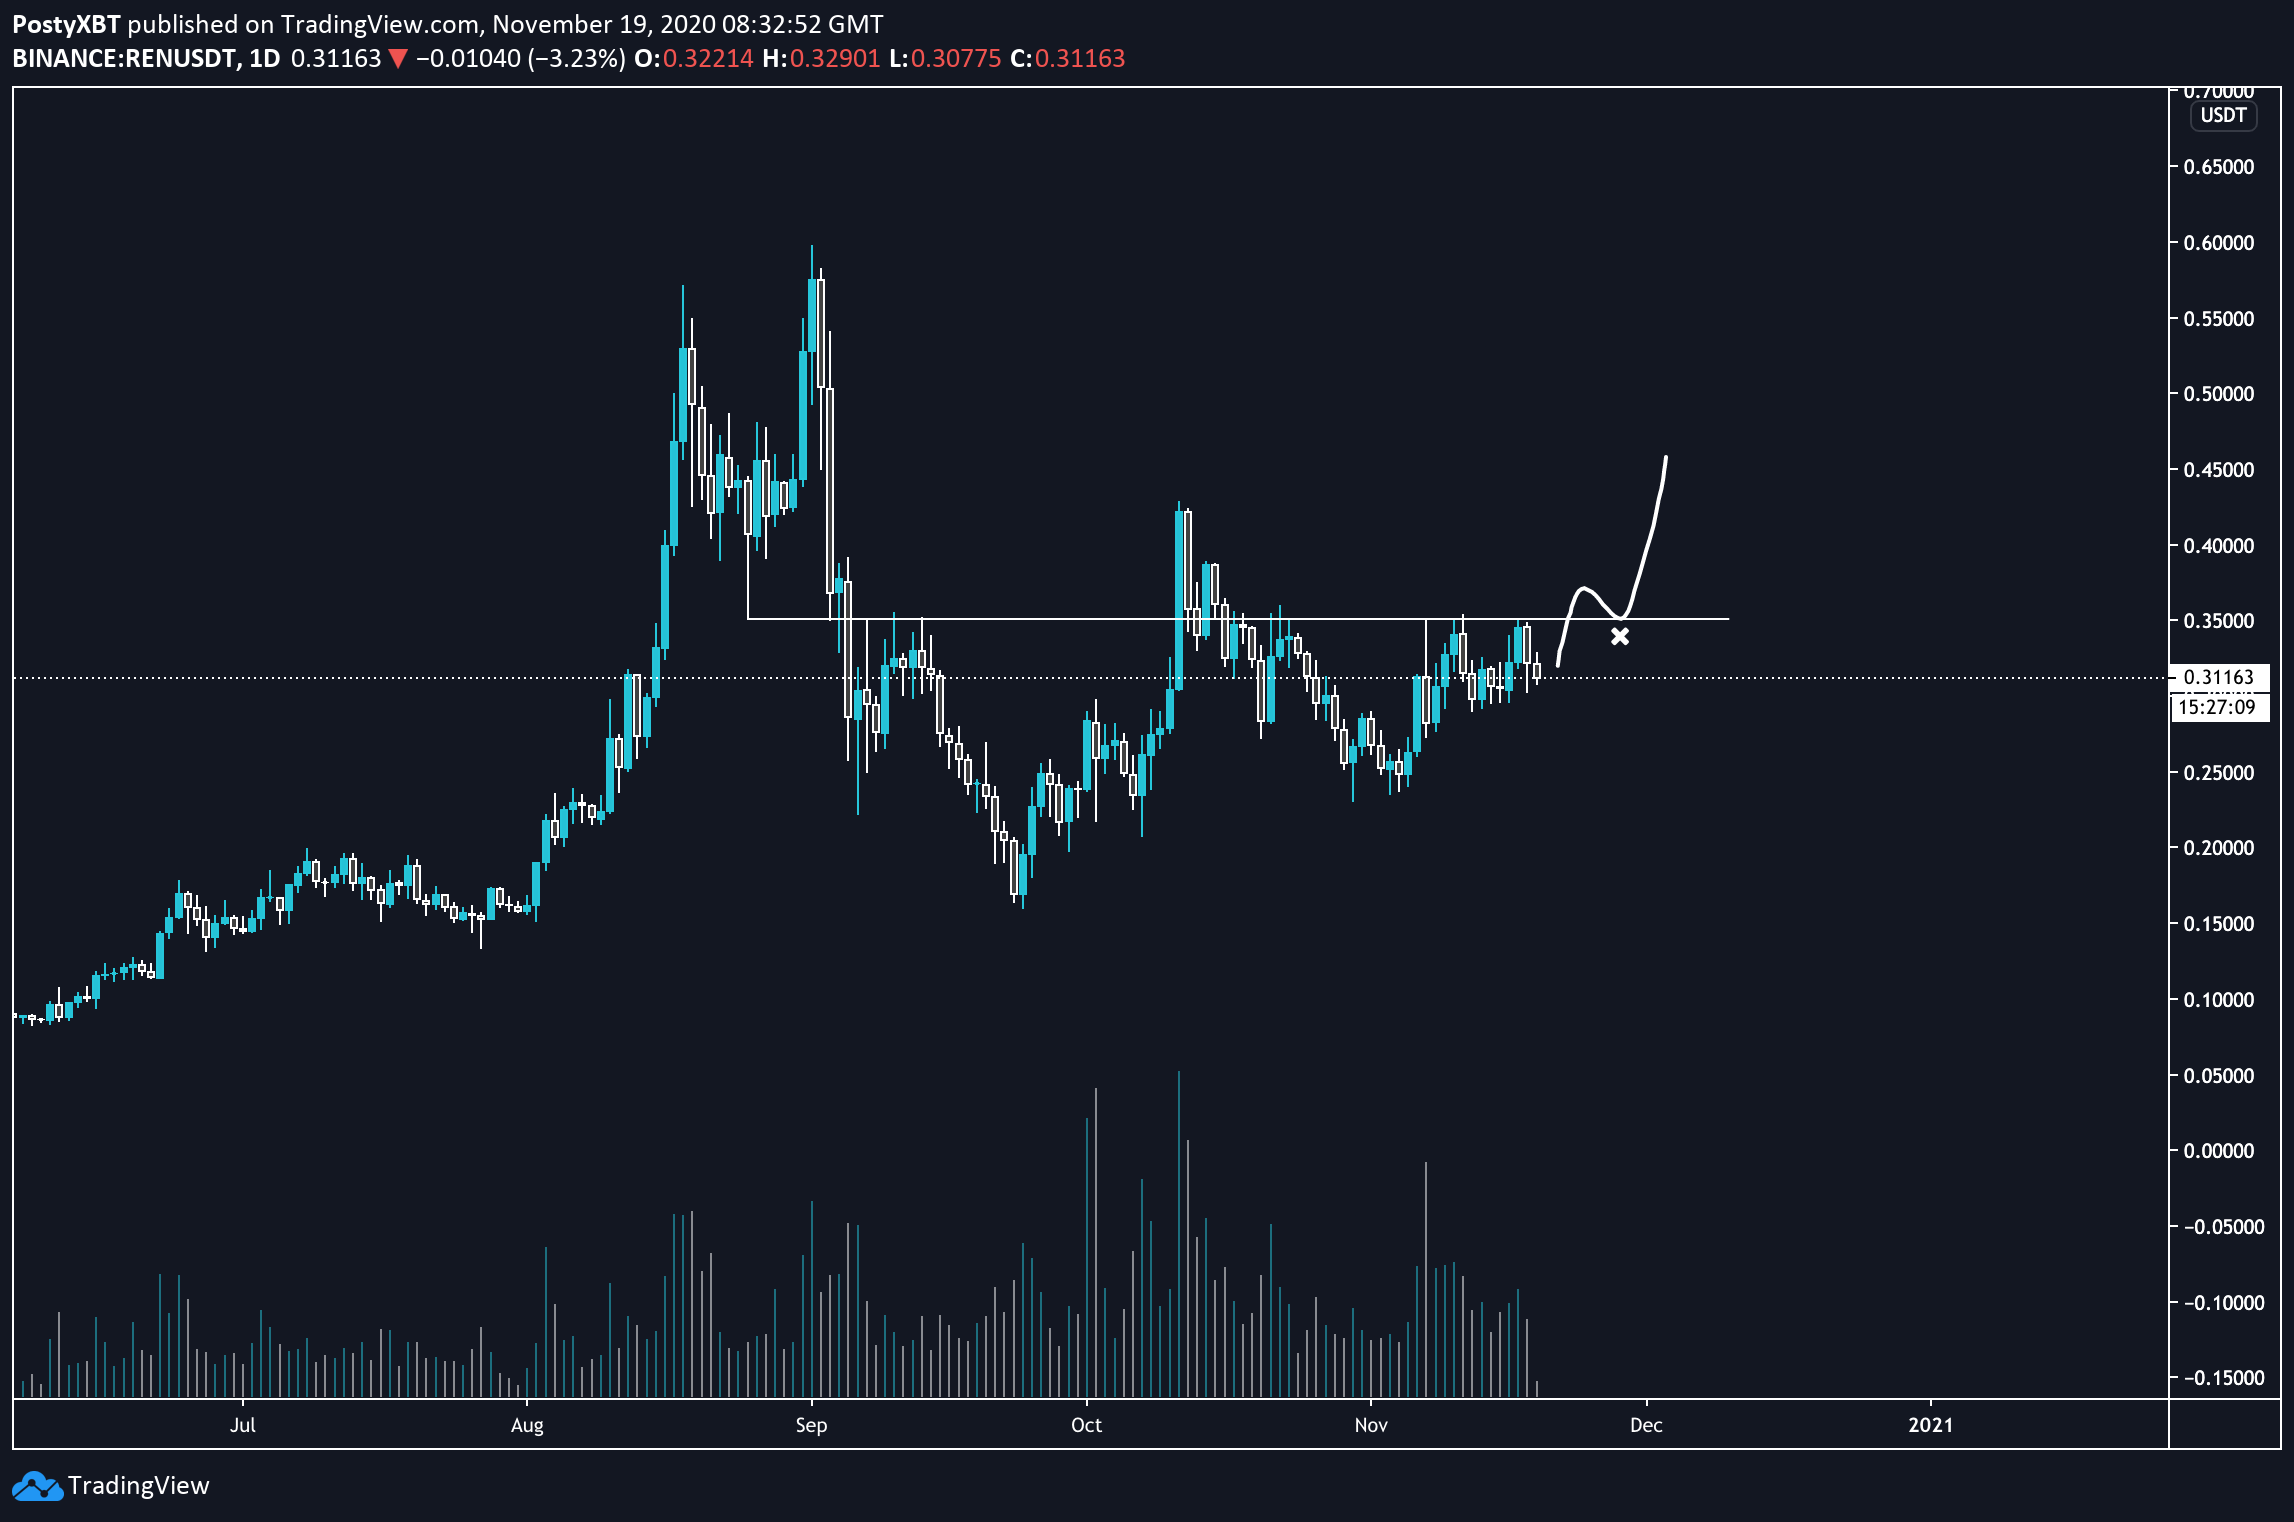
Cryptocurrency trader @postyXBT outlined a REN chart, stating that if $0.35 flips as support, the price could move upwards at a rapid pace. The area coincides with the upper limit of the trading range we have outlined, so a breakout above it would likely initiate a rapid acceleration of price.
Possible Breakout
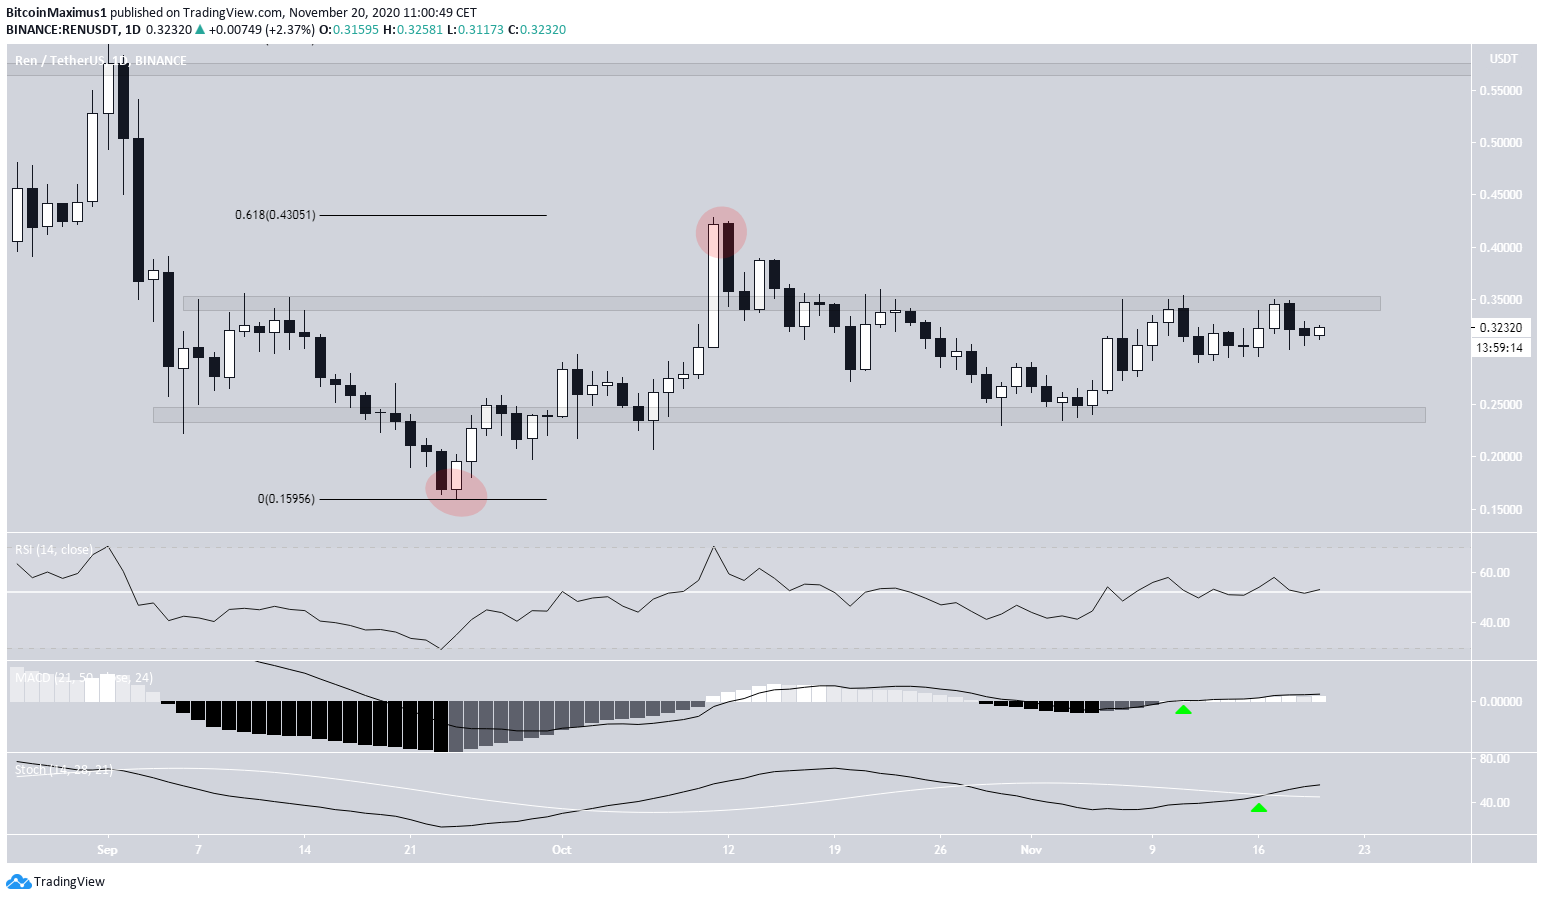
Technical indicators on the daily time-frame are bullish:
- The RSI is increasing and is above 50.
- The MACD is increasing and is above 0.
- The Stochastic Oscillator has made a bullish cross and is moving upwards.
Therefore, the REN price should eventually break out from its resistance area and continue moving higher.
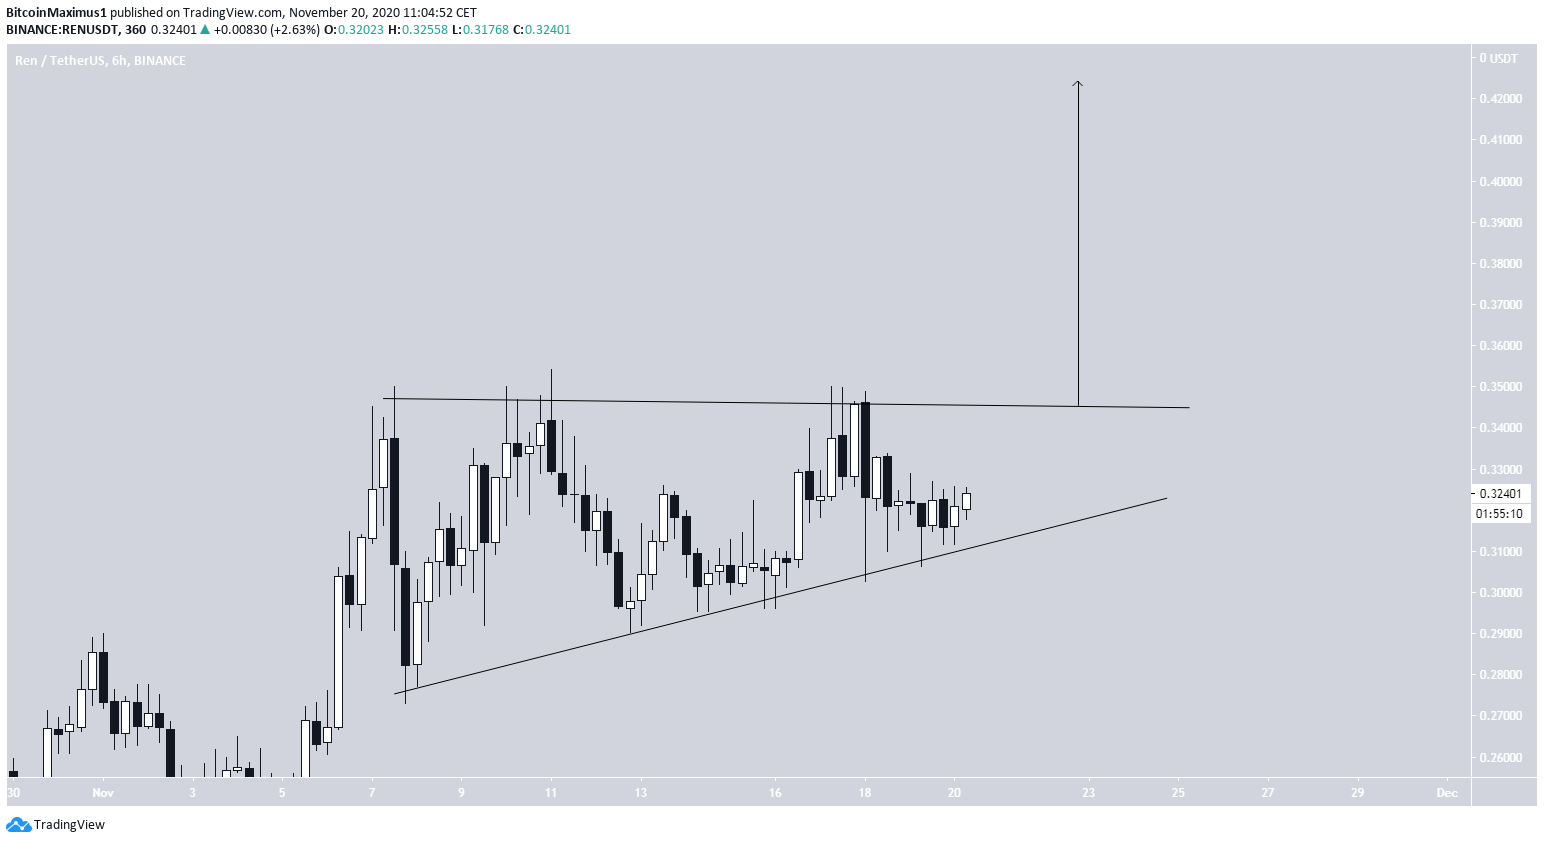
The shorter-term chart shows that the price is trading inside an ascending triangle, which is a bullish pattern. The resistance line of the triangle coincides with the upper limit of the trading range near $0.35.
If a breakout occurs, which is likely, a movement that travels the entire height of the pattern would take REN all the way to $0.43, the previously mentioned 0.618 Fib retracement level.
Conclusion
To conclude, the REN price should break out from its short-term pattern and trading range, and continue moving upwards until it reaches at least one of the resistance areas we have outlined.
For BeInCrypto’s previous Bitcoin analysis, click here!
Disclaimer: Cryptocurrency trading carries a high level of risk and may not be suitable for all investors. The views expressed in this article do not reflect those of BeInCrypto


