
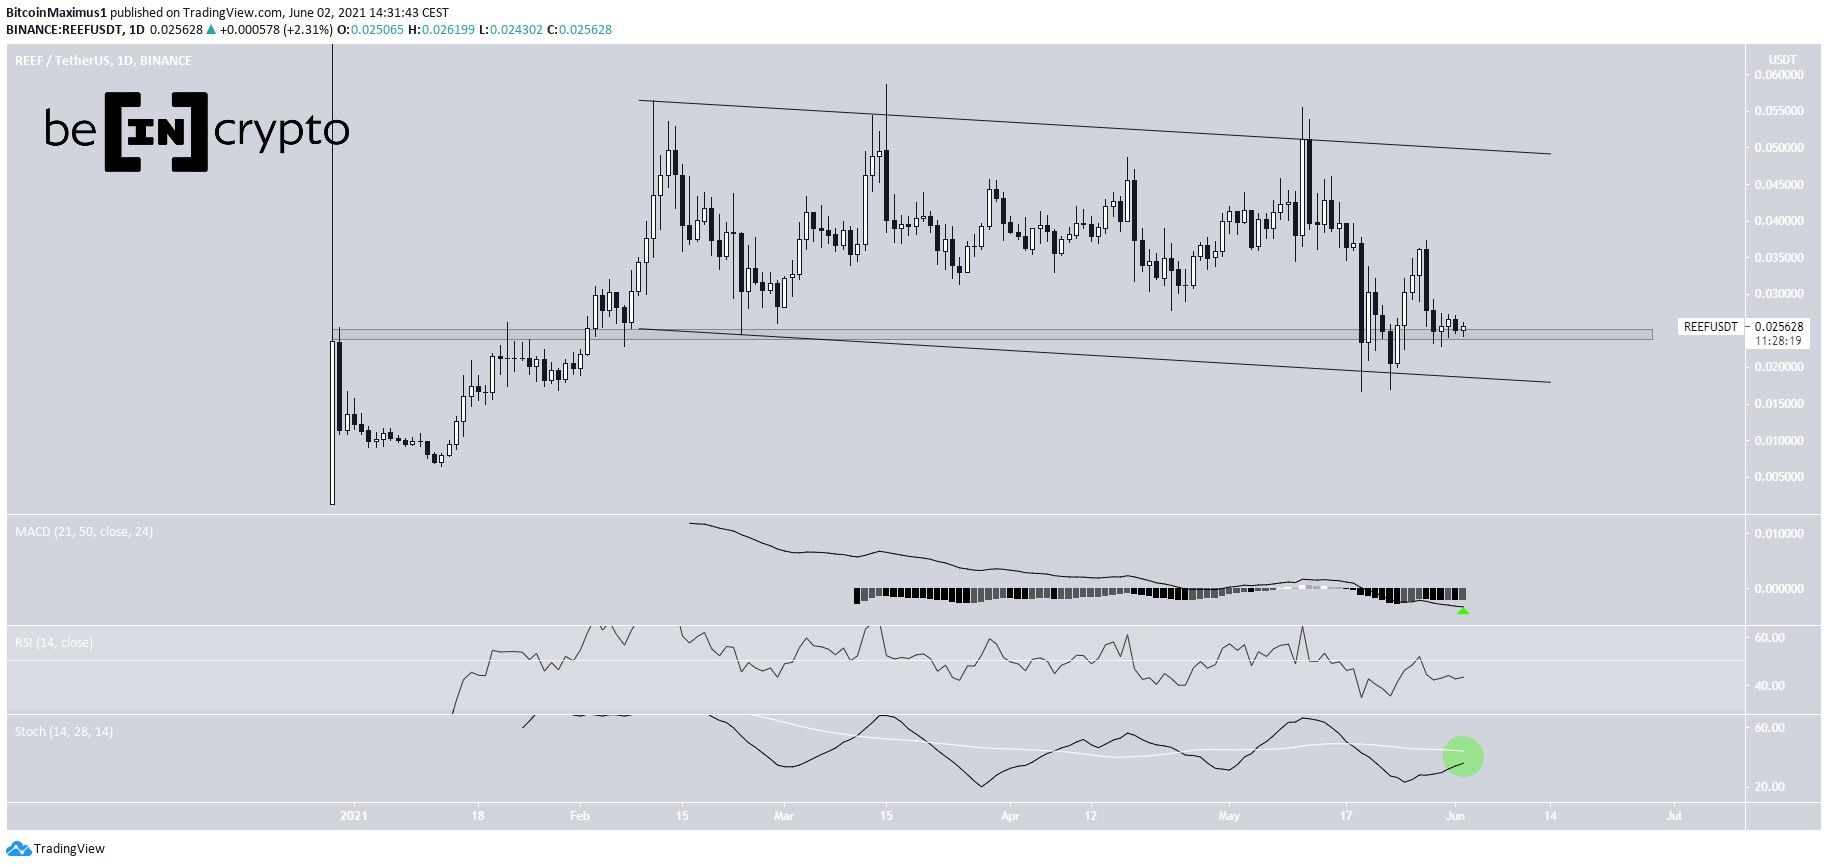
Reef (REEF) has been trading inside a descending parallel channel since Feb. 11.
While it is showing some bullish reversal signs, it is yet to confirm its bullish structure.
REEF continues consolidating
Since Feb. 11, REEF has been trading inside a descending parallel channel. While it did reach a new all-time high price of $0.058 on March 15, it created a long upper wick and fell back inside the channel.
After being rejected on May 11, it began a sharp downward movement towards support, reaching it on May 19. It has been moving upwards since.
Technical indicators are neutral, but are showing some bullish signs, such as an impending bullish cross in the Stochastic oscillator (green circle).
Furthermore, REEF has reclaimed the $0.0245 area, validating it as support in the process.
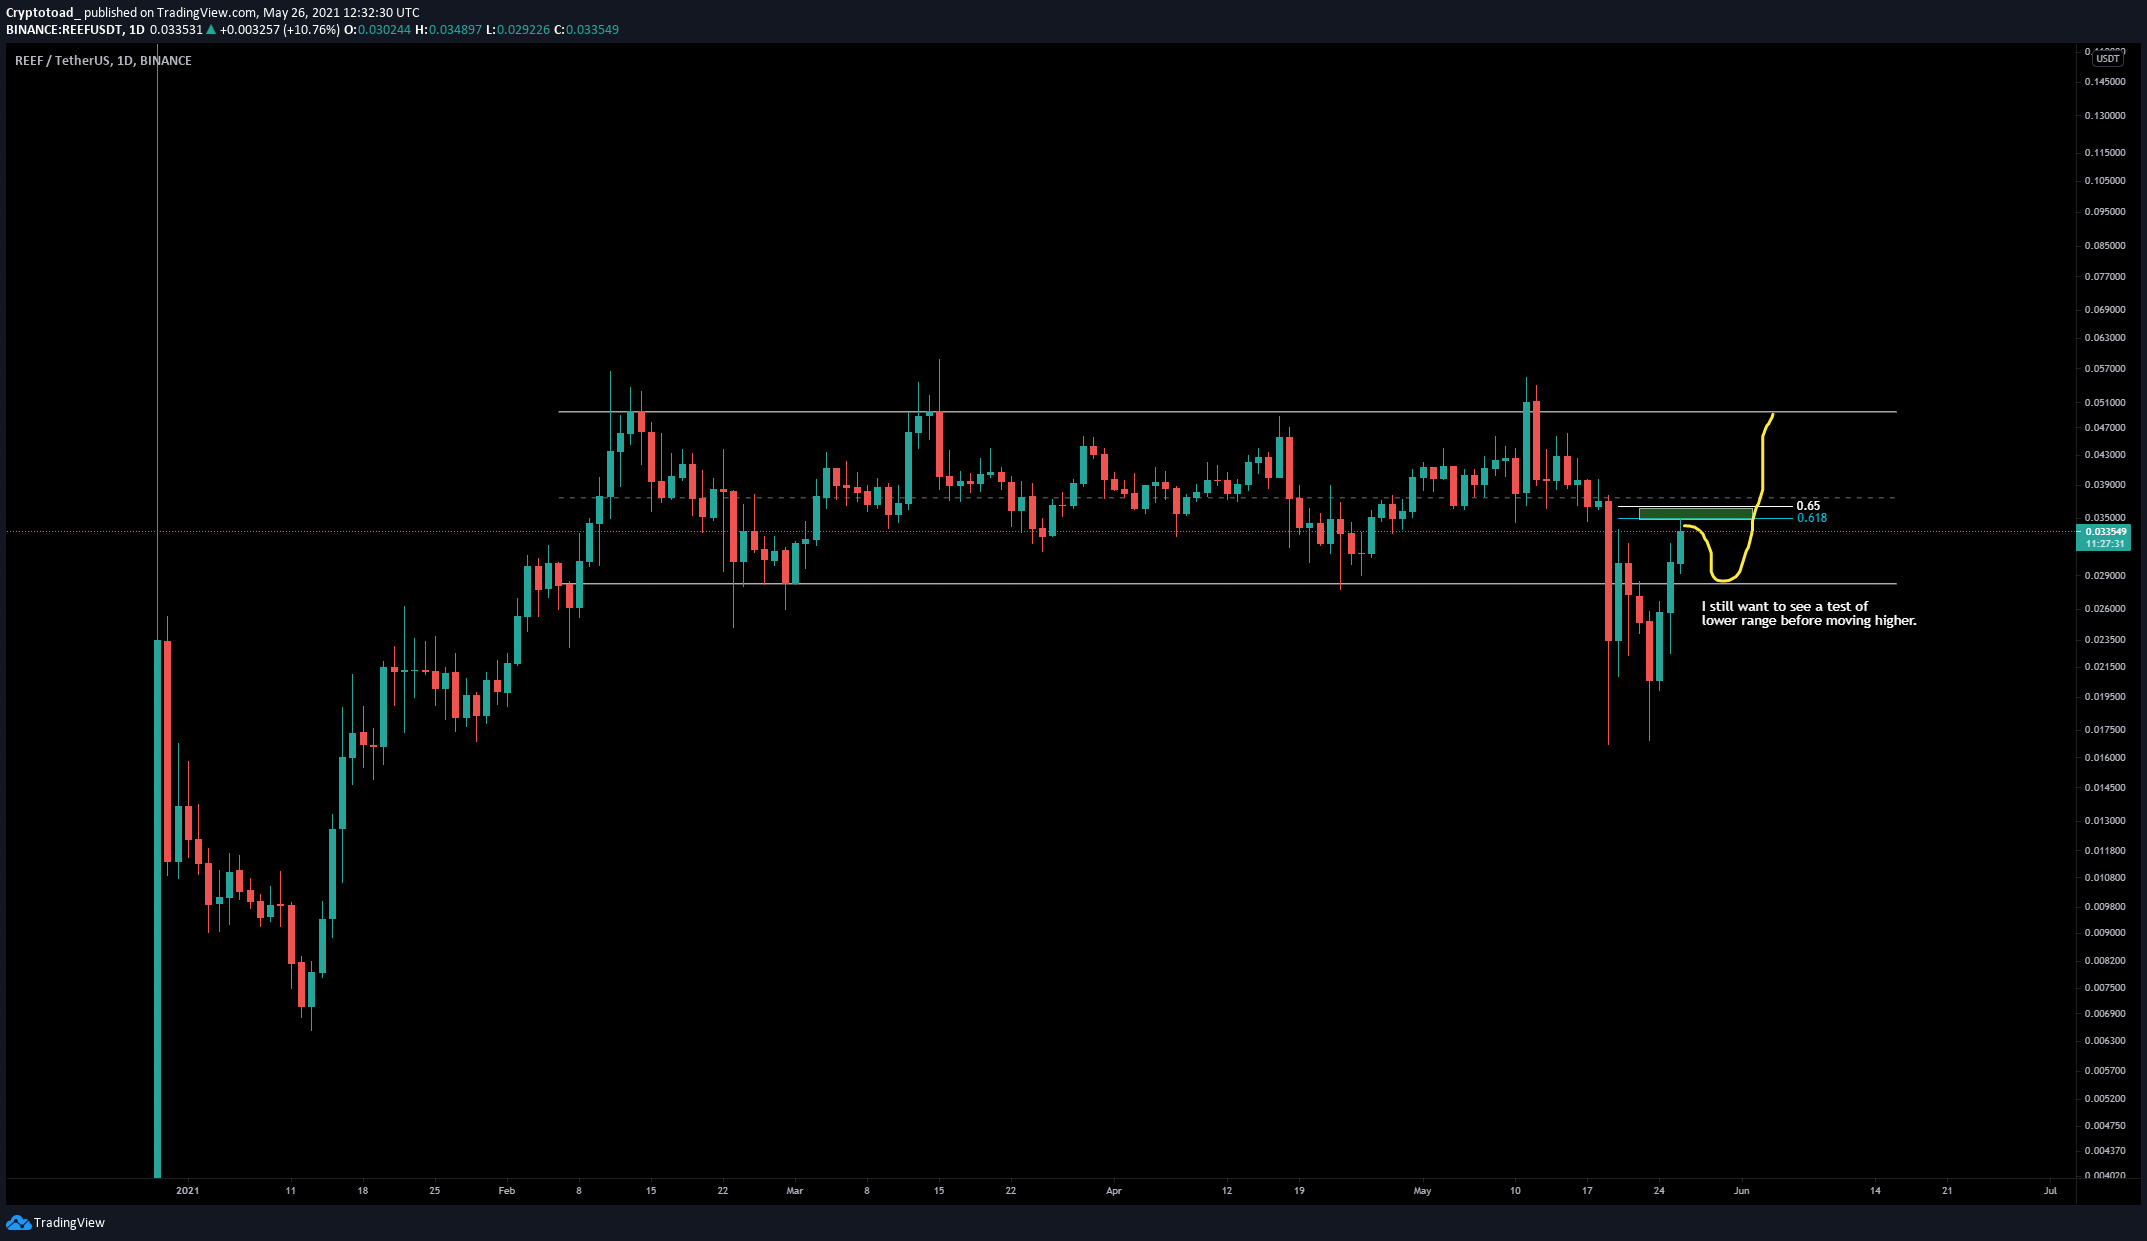
Cryptocurrency trader @Mesawine1 outlined a REEF chart, which shows the token reclaiming the support line of the descending channel. Since the tweet, the token has also reclaimed the $0.245 support area.
Future movement
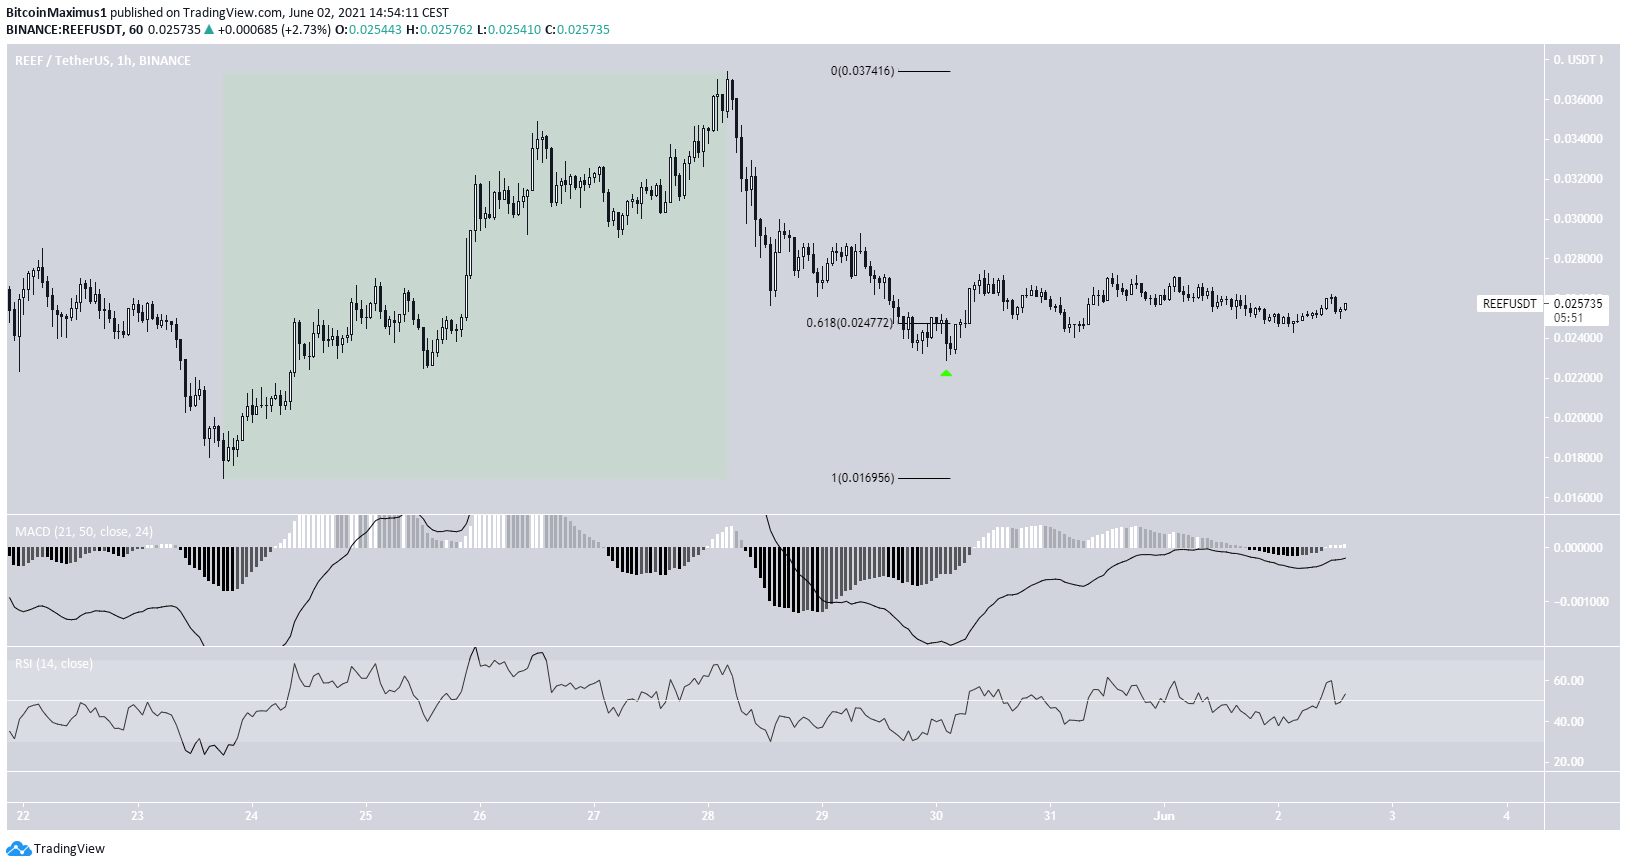
The shorter-term two-hour chart shows a five wave move up (highlighted in green), which looks like the beginning of a bullish impulse.
In addition, the resulting retracement was completed very close to the 0.618 Fib retracement level, which coincides with the previously outlined $0.0245 support area.
Moreover, both the RSI and MACD are moving upwards.
Therefore, the two-hour chart is showing some bullish reversal signs, which align with those from the daily time-frame. However, REEF has to confirm the higher low, in order to create a bullish structure. A breakdown below the $0.0245 area would invalidate this scenario.
REEF/BTC
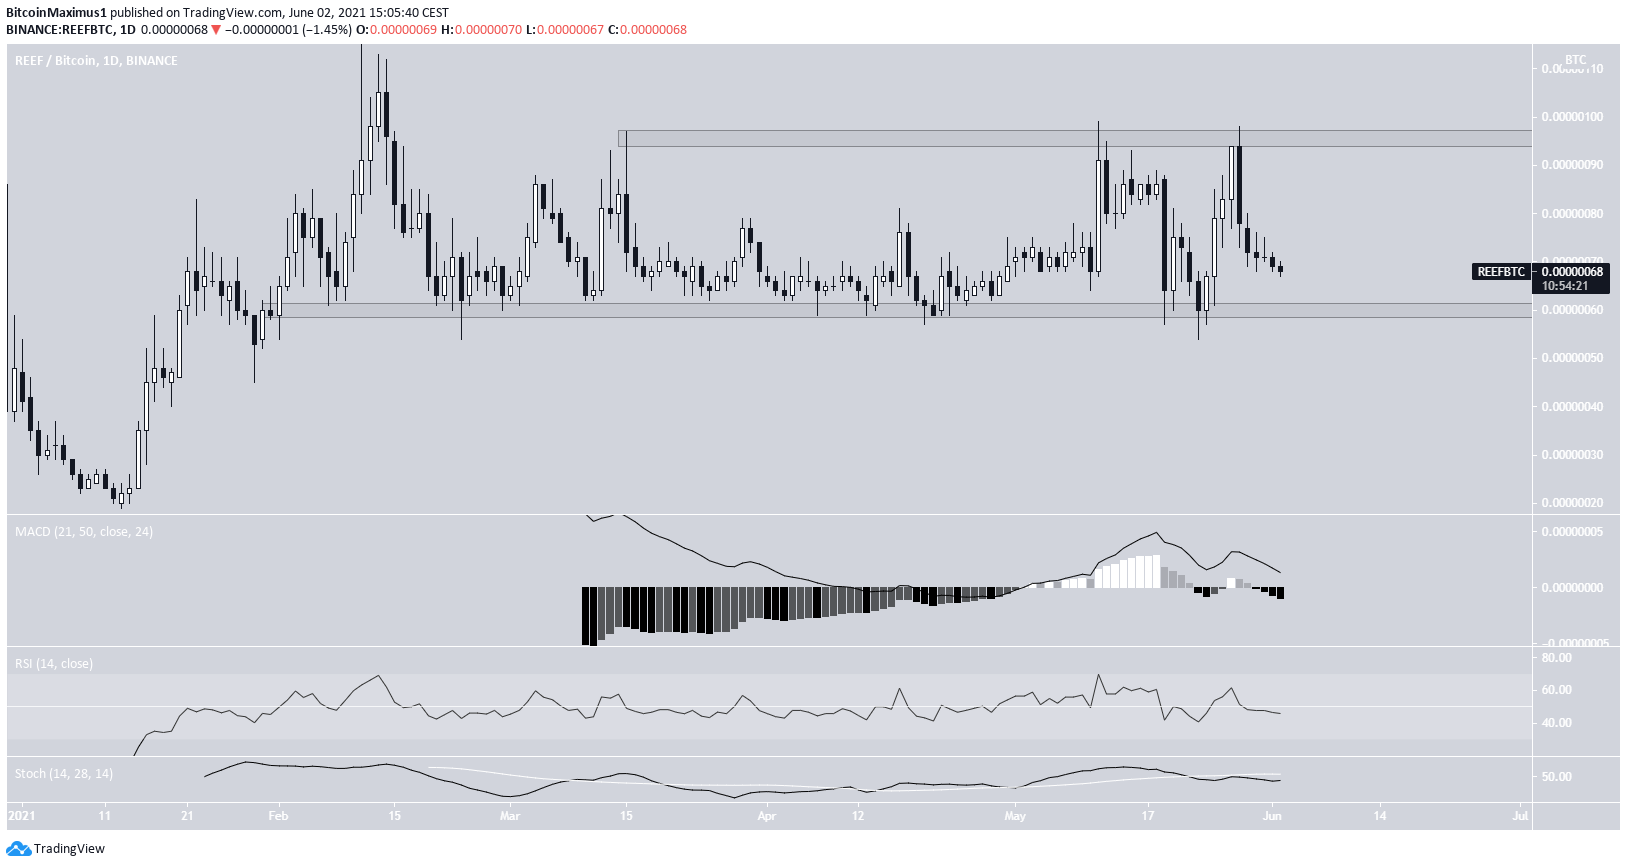
Similarly to the USD counterpart, the REEF/BTC chart provides a relatively neutral outlook.
The token is trading inside a range between 60 and 96 satoshis. It bounced at the support area, on May 23, but was rejected from the resistance area four days later.
Currently, it is trading close to the 60 satoshi support area once more.
Technical indicators are also neutral. This is especially evident in the RSI, which is freely crossing above and below the 50 line. Therefore, the trend remains undetermined until a decisive movement outside the range.
For BeInCrypto’s previous bitcoin (BTC) analysis, click here.
