
The Quant (QNT) price is trading very close to a major resistance area. Due to a breakout from the current pattern, the price should eventually move above this resistance.
Long-Term Resistance
QNT has been rallying since March 13, when the price reached a low of $1.09. The rally continued until the price reached a high of $13.10 on Sept 1. However, the price created a long upper wick and fell considerably afterward. At the time of writing, QNT was in the process of making another breakout attempt above the long-term resistance area at $11.30. Until now, the price has never reached a weekly close above this level. If it does, the next resistance area would be found at $16.70, coinciding with the all-time high price. Conversely, the closest support area is found at $6.50. Technical indicators are bullish, since both the RSI and Stochastic Oscillator are increasing, neither being overbought or forming any bearish divergence.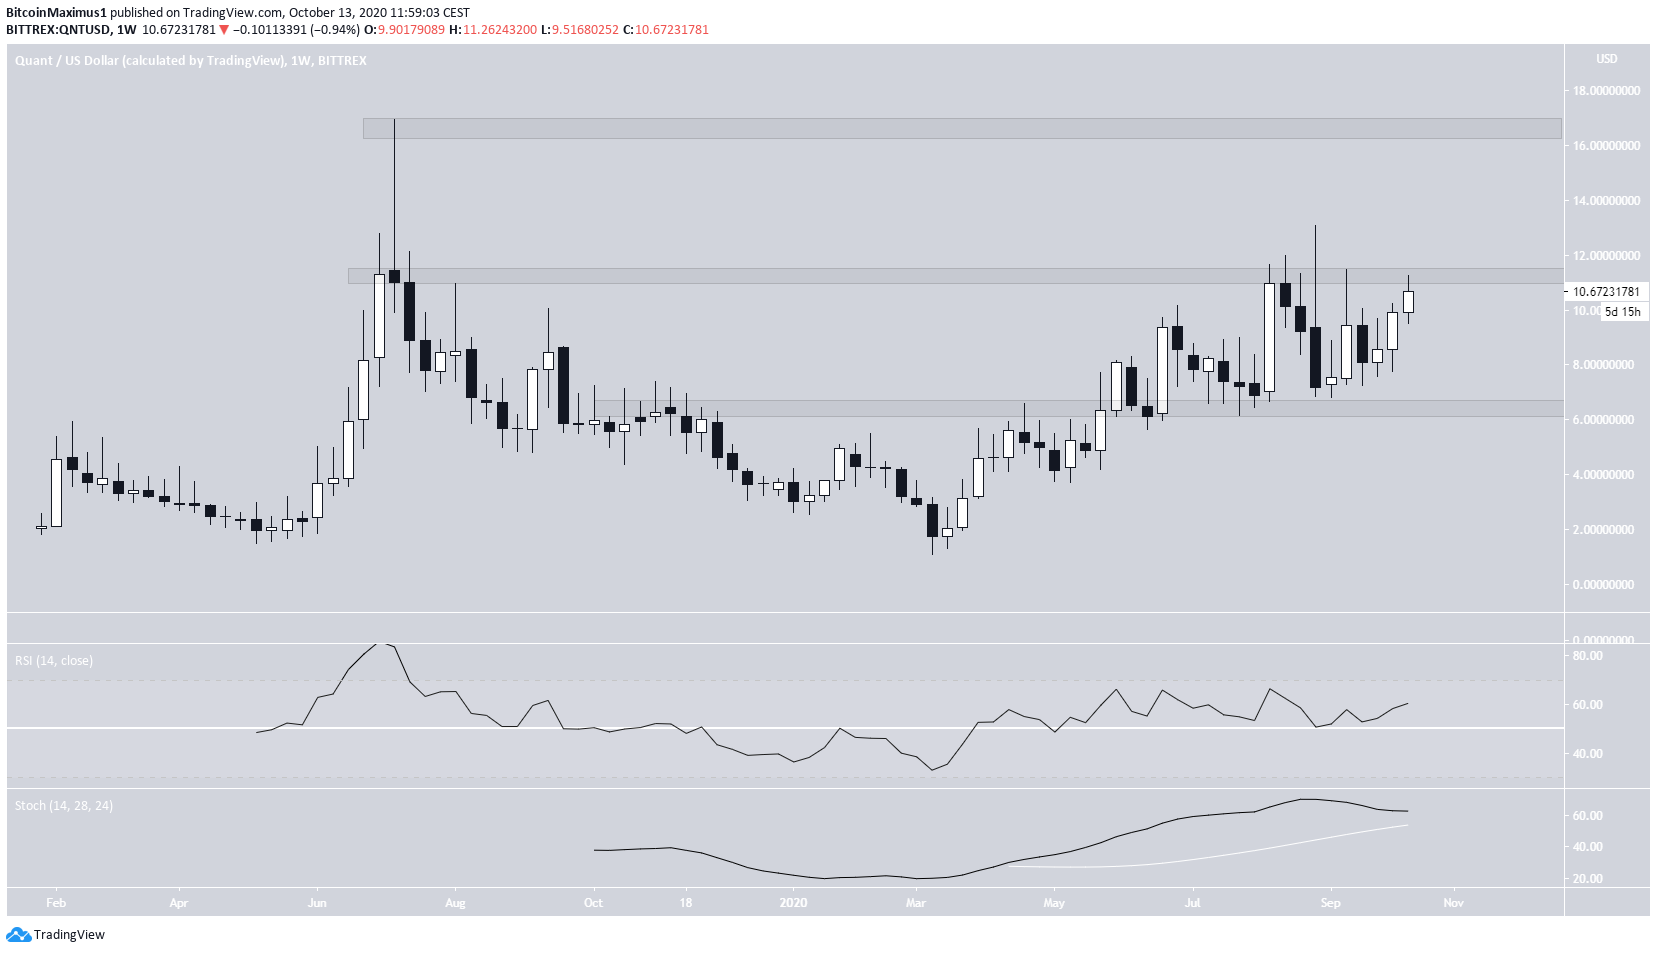
Possible Breakout
The daily chart shows that the price was trading inside a symmetrical triangle since June 2020. While the exact slope of the resistance and support lines is not clear due to numerous long wicks, it’s possible that the price broke out from the resistance line yesterday. If so, the price should continue moving upwards and also break out from the $11.20 resistance area. Technical indicators are bullish, since all three of the: MACD, RSI and Stochastic Oscillator are moving upwards, the latter having made a bullish cross.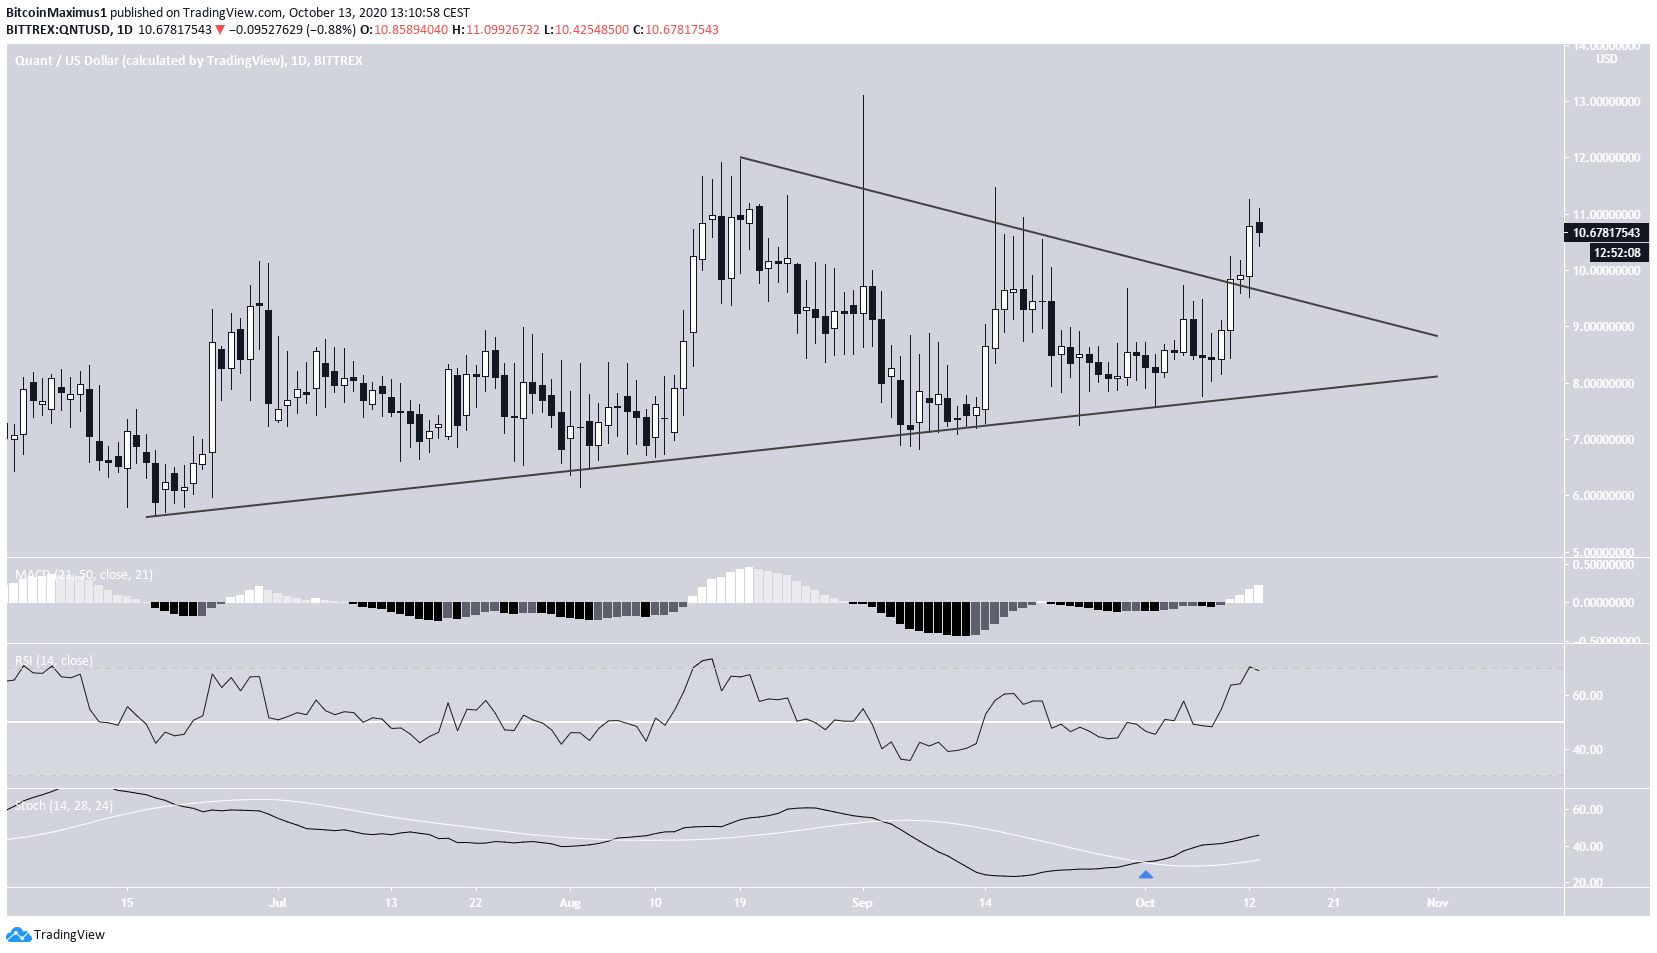
QNT/BTC
The QNT/BTC price shows a similar movement to QNT/USD. However, instead of breaking out from a symmetrical triangle, it seems that the price is still trading inside an ascending triangle. Technical indicators are bullish, and since the ascending triangle is considered a bullish pattern, a breakout from here is likely. If so, the price could rally all the way to the next resistance area at ฿0.00135, a target found by projecting the height of the triangle to the breakout point.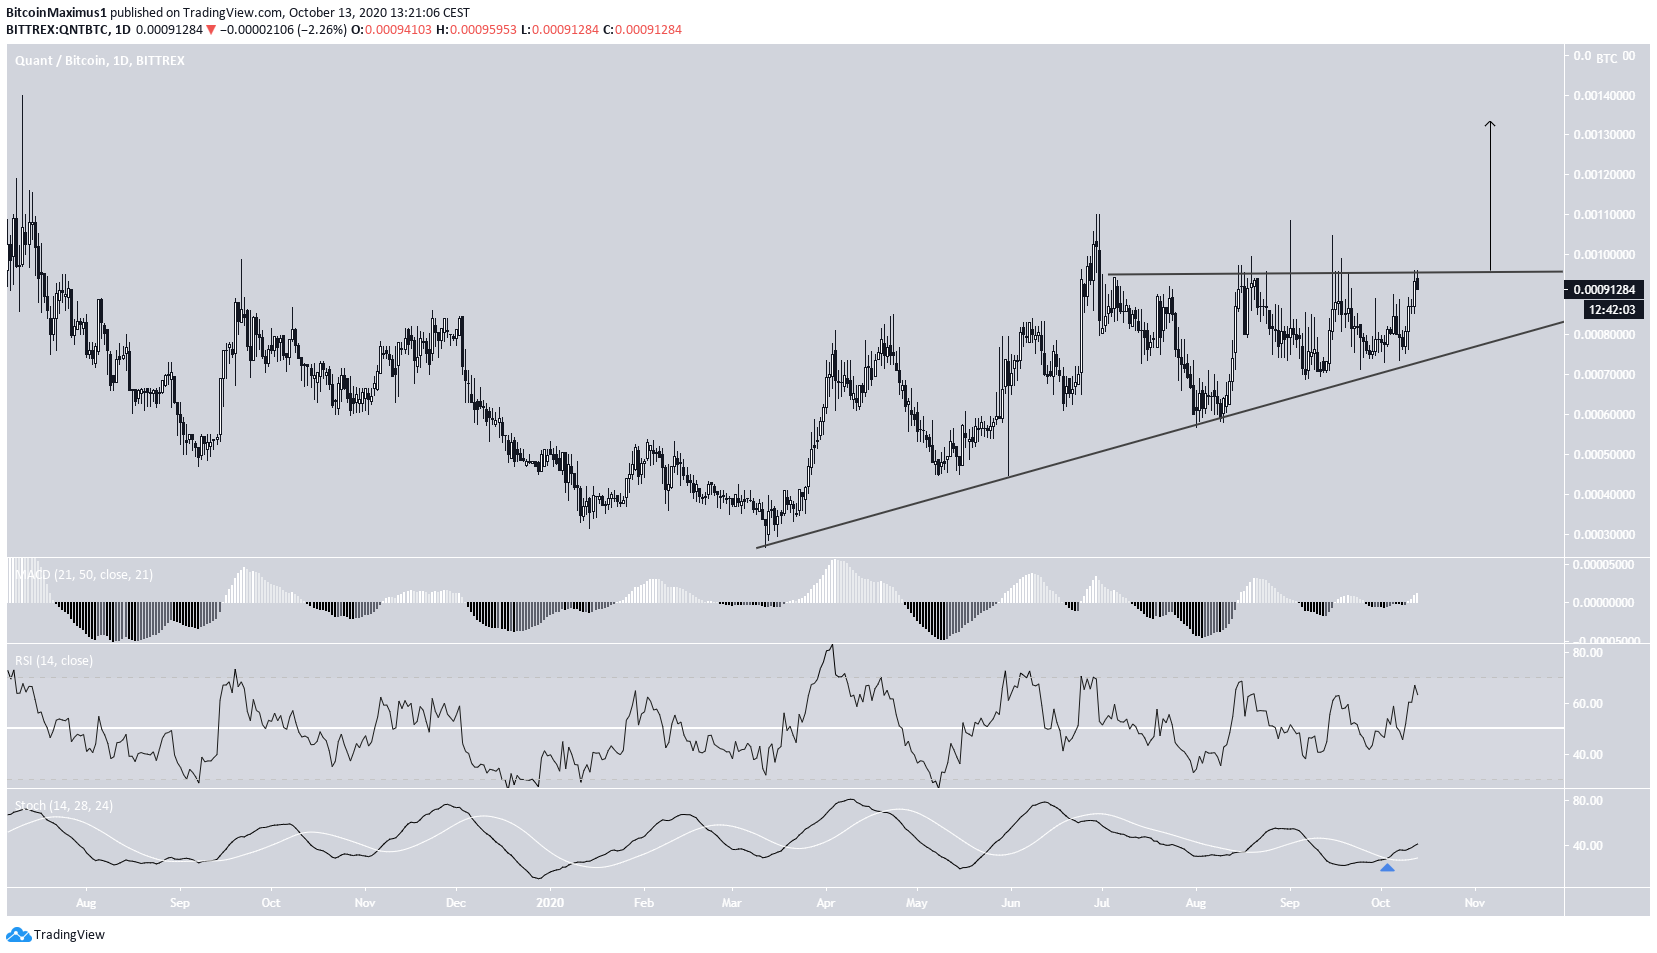
Top crypto platforms in the US
Disclaimer
In line with the Trust Project guidelines, this price analysis article is for informational purposes only and should not be considered financial or investment advice. BeInCrypto is committed to accurate, unbiased reporting, but market conditions are subject to change without notice. Always conduct your own research and consult with a professional before making any financial decisions. Please note that our Terms and Conditions, Privacy Policy, and Disclaimers have been updated.

Valdrin Tahiri
Valdrin discovered cryptocurrencies while he was getting his MSc in Financial Markets from the Barcelona School of Economics. Shortly after graduating, he began writing for several different cryptocurrency related websites as a freelancer before eventually taking on the role of BeInCrypto's Senior Analyst.
(I do not have a discord and will not contact you first there. Beware of scammers)
READ FULL BIO
Sponsored
Sponsored