


The Quant (QNT) price has broken down from both long- and short-term patterns. A downward movement is the most likely scenario.
QNT is the native token of the Quant network, founder in 2018 by Gilbert Verdian. Quant’s operating system, the Overledger Network, is aimed to act as a connector of different blockchains, in turn fixing one of the main issues with distributed ledger technology.
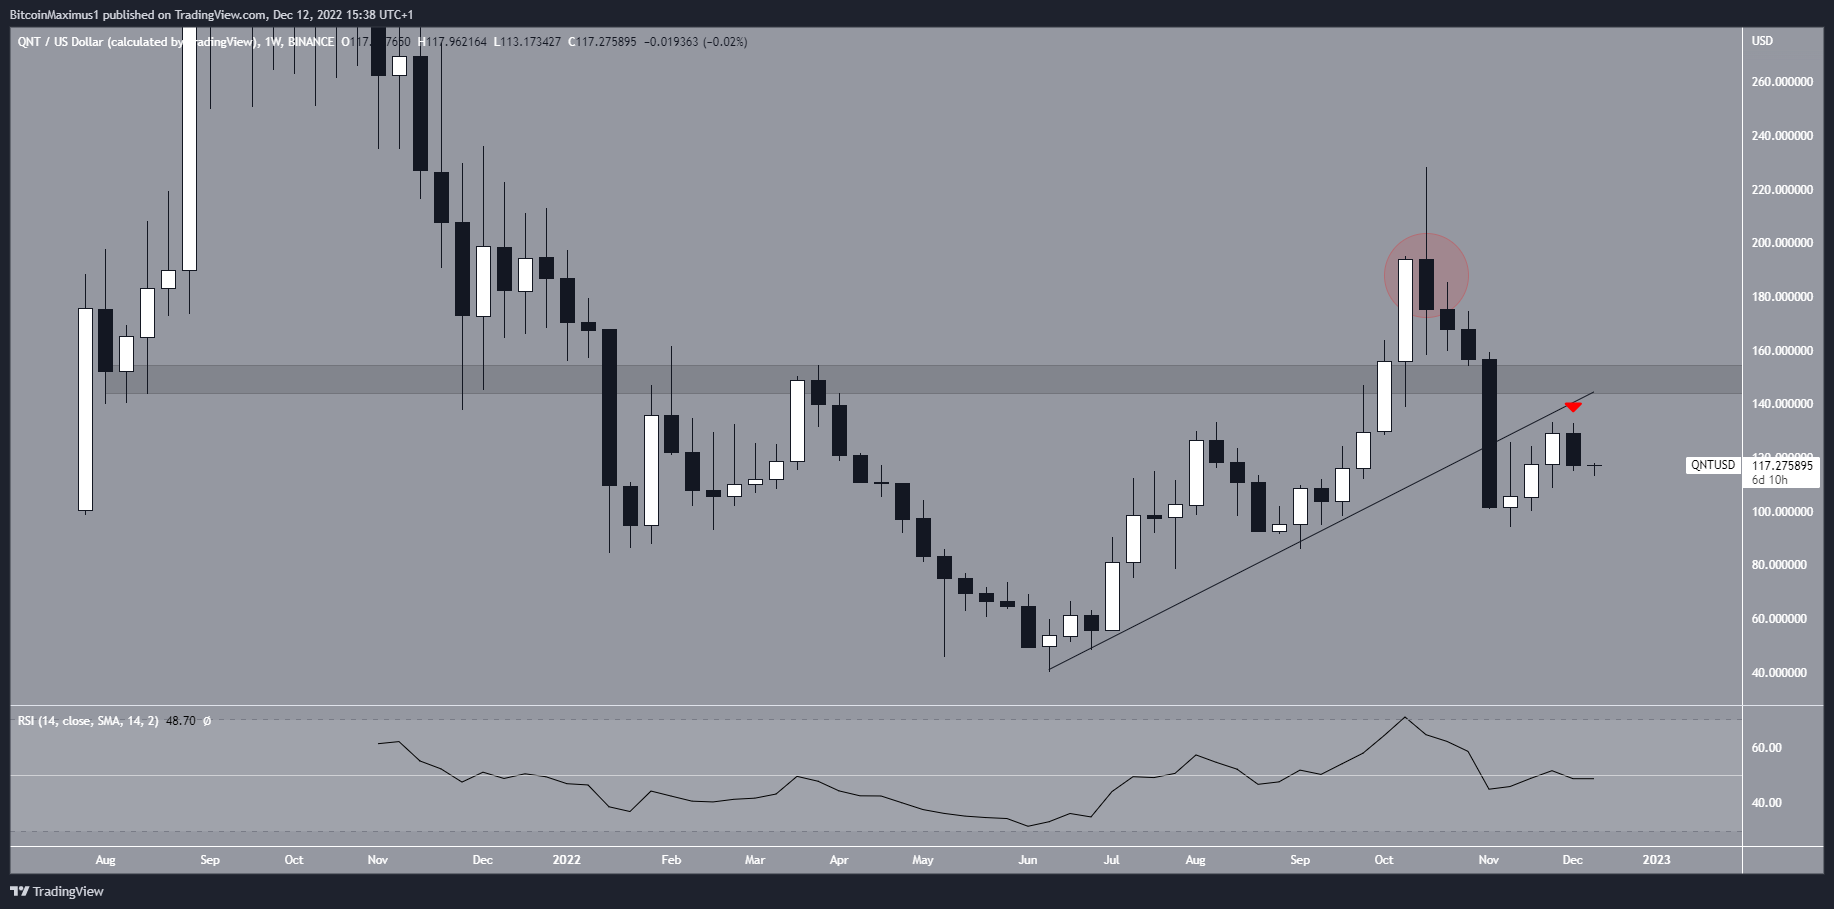
The QNT price has fallen since deviating above the $150 long-term resistance area at the end of Oct. (red circle). Shortly afterward, the Quant price broke down from an ascending support line. This was a sign that the upward movement that began in June had now ended. The QNT price validated the support line as resistance last week (red icon) before resuming its downward movement.
Furthermore, the weekly RSI has decreased below 50, another sign that the QNT price trend is bearish.
Quant Price Short-Term Breakdown
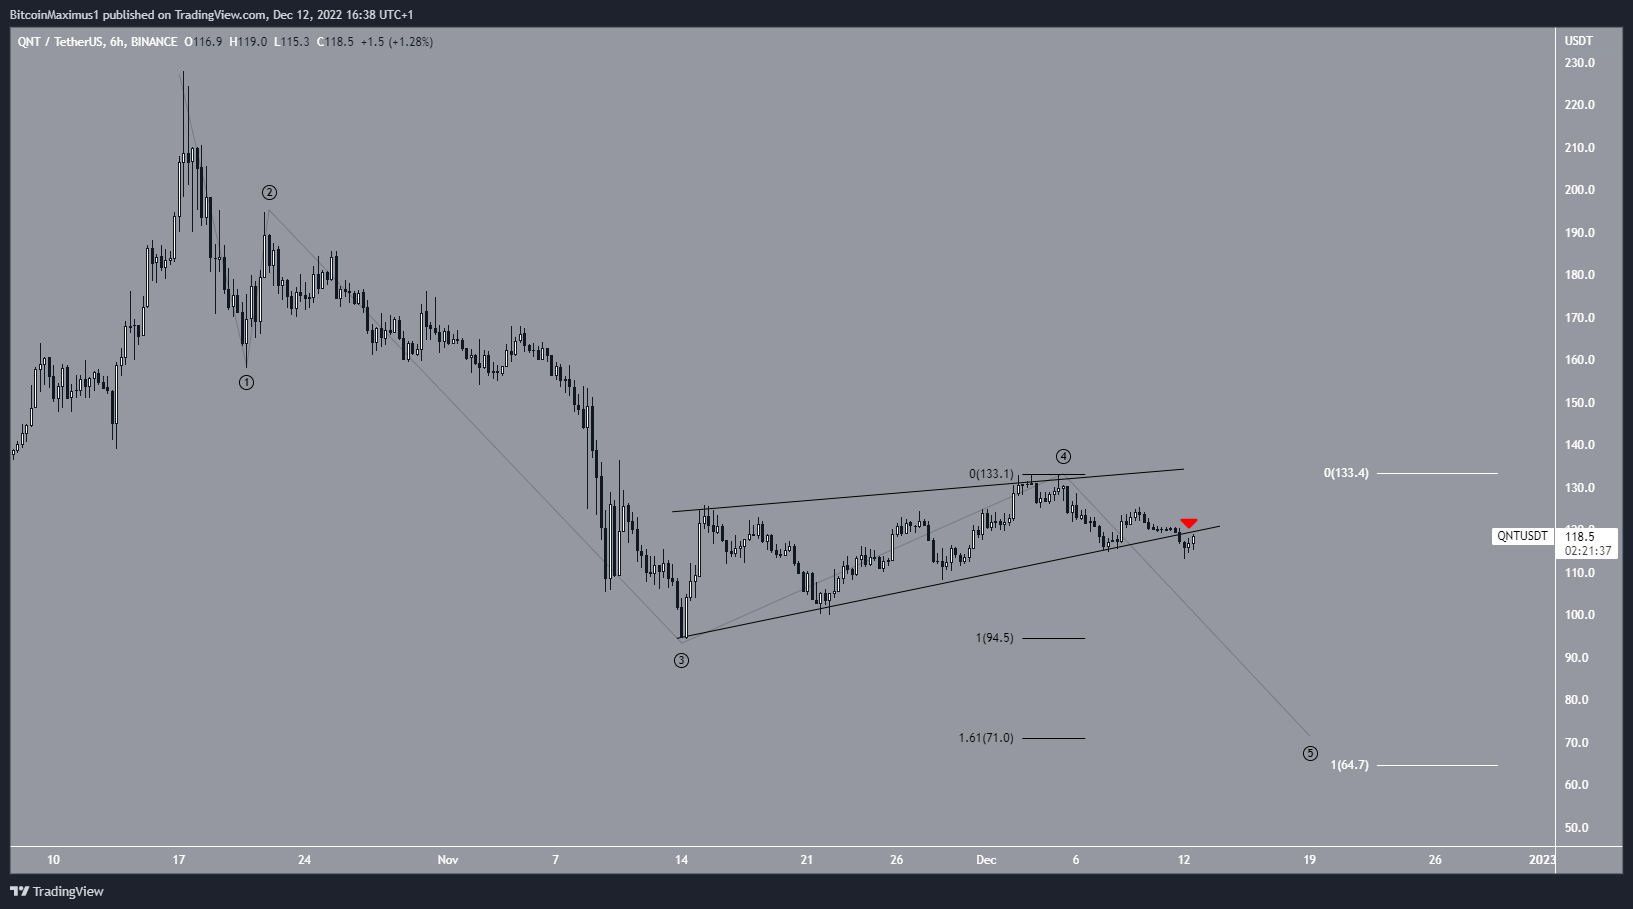
The short-term six-hour chart shows that the QNT price also broke down from an ascending wedge during the past 24 hours. Currently, it is in the process of validating the wedge as resistance (red icon).
When measuring from the Oct. high, it seems that the Quant price is mired in a five-wave downward movement. If correct, the breakdown from the wedge marked the beginning of the fifth and final wave.
The most likely target for the bottom of the movement is between $65-$71. The target is found using the 1.61 external retracement of wave four (black) and giving waves one and five a 1:1 ratio (white).
For BeInCrypto’s latest crypto market analysis, click here.



