
On May 31, 2019, the Quant price reached a low of 21,600 satoshis. A gradual upward move ensued, which is still continuing.
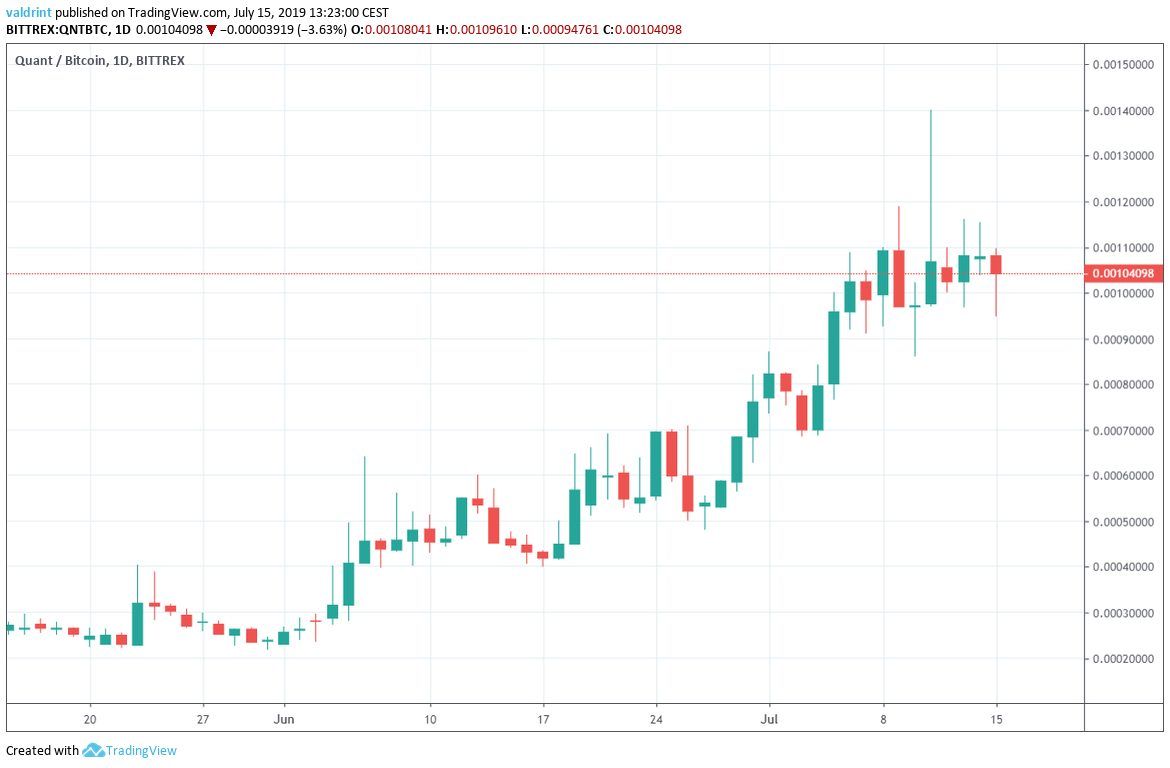
On July 11, QNT reached a high of 140,000 satoshis before decreasing to 100,000.
Where will the price go to next? In this article, we will analyze the QNT price in different time-frames alongside technical indicators in order to answer this question.
For a video analysis click below:
Quant Price: Trends and Highlights for July 15
- QNT/BTC has been following an ascending support line.
- It has found support above the 10-day moving average.
- In the daily time-frame, there is bearish divergence developing in the RSI.
- QNT is trading inside a short-term descending channel.
Ascending Support for QNT Price
Since reaching the aforementioned low on May 31, the QNT price has been following the ascending support line outlined below:
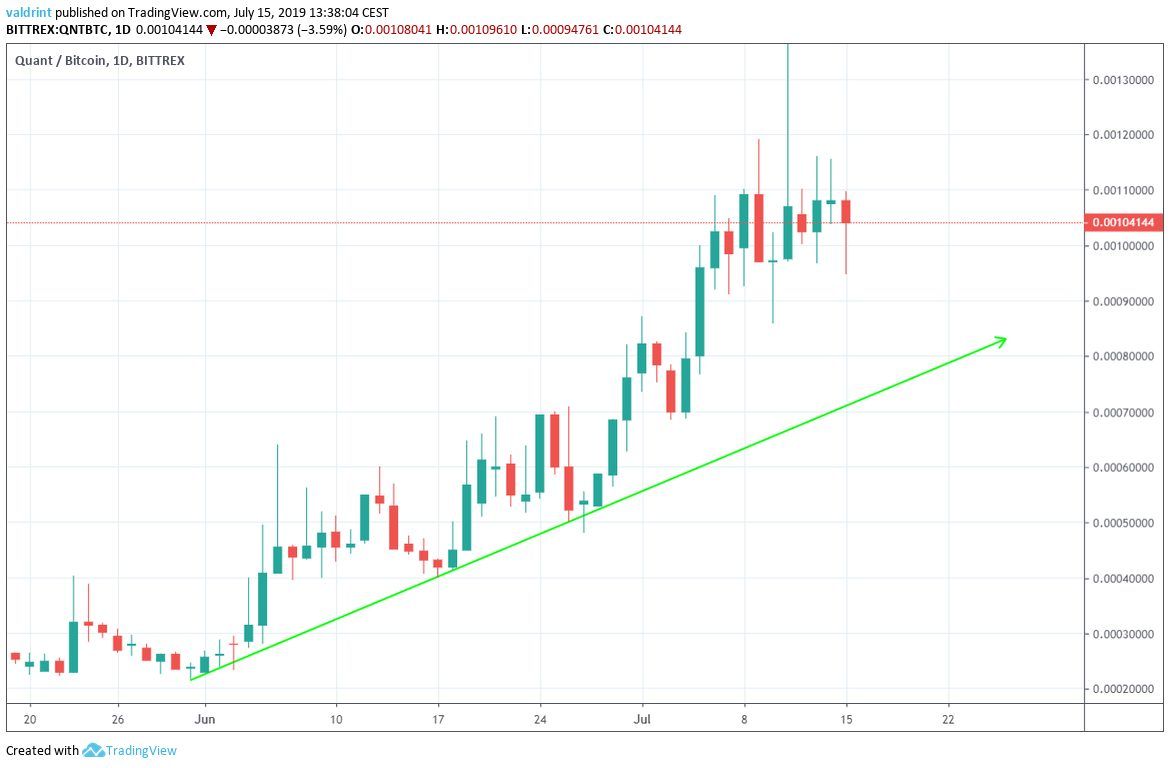
Initially, it increased at the rate predicted by this support line.
However, the rate of increase intensified on June 26.
Throughout this increase, the QNT price has found support several times above the 10-day moving average (MA).
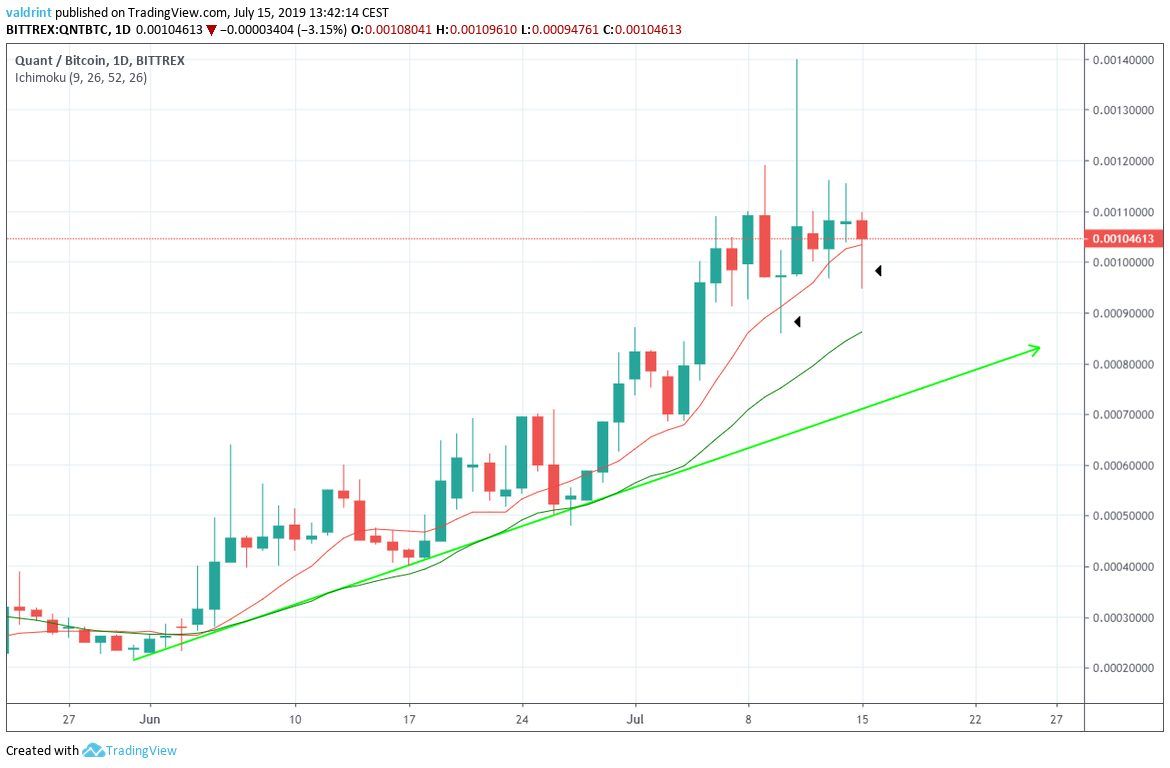
This was especially visible on July 10 and 15.
The price briefly dropped below the 10-day MA, before immediately bouncing and finding support above it.
This affirms the validity of the 10-day MA as an important support line.
Let’s take a look at momentum indicators to see if this support will be enough to propel the QNT price to new highs.
Bearish Divergence
First, we need to look at previous movement in order to identify important price areas.
Below, one resistance area is outlined. It was created by the highs of February 2019.
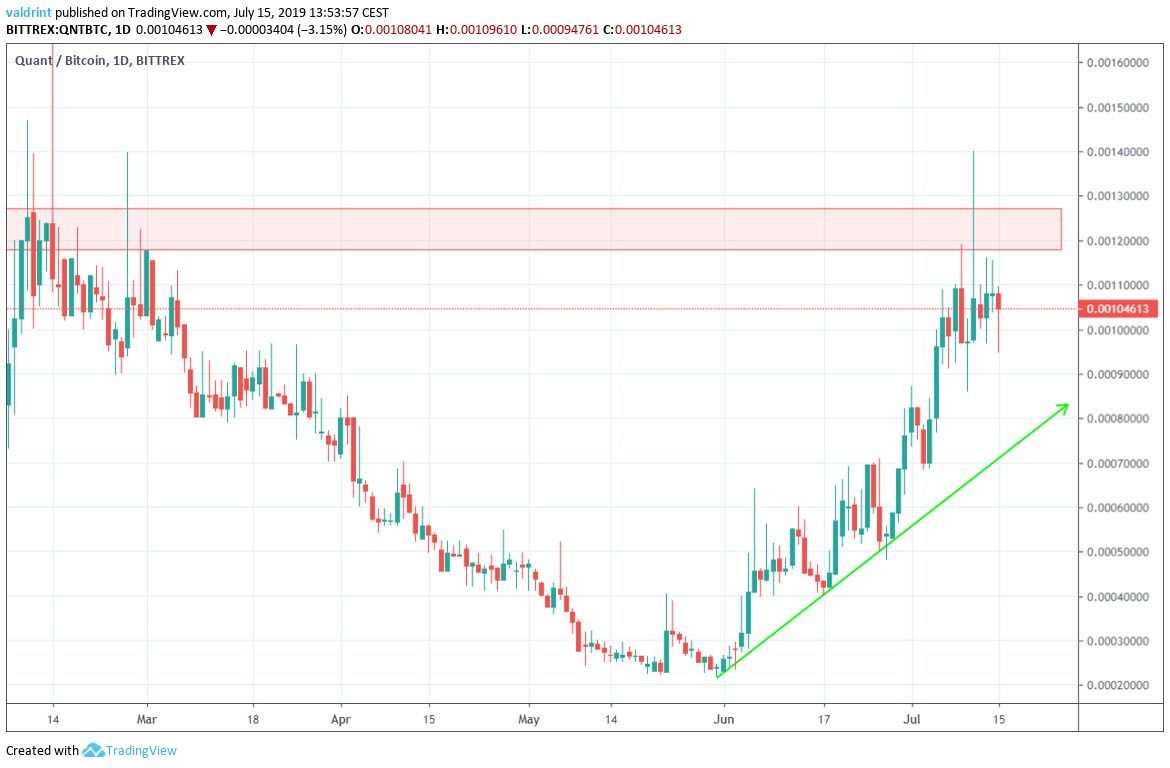
The area most recently provided resistance to the price on July 11.
While the QNT price may initiate other attempts at a breakout, according to the RSI, they will not be successful.
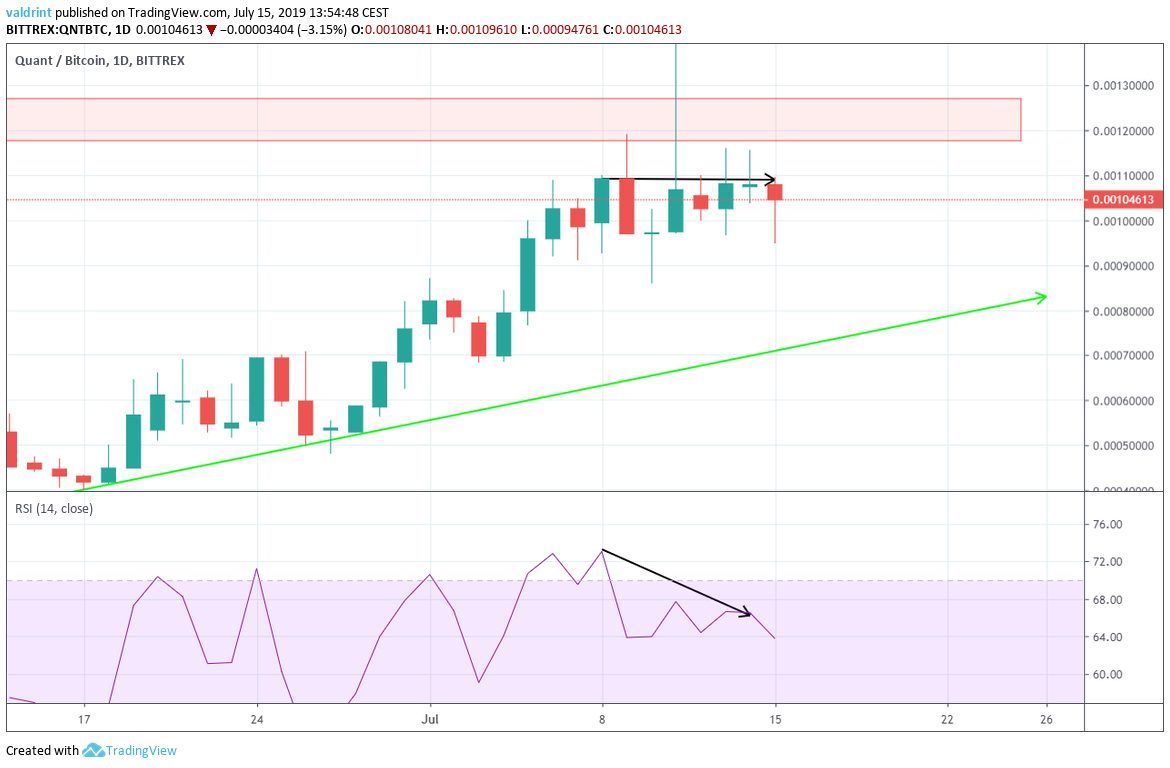
Since July 8, the RSI has been generating bearish divergence. While this divergence is not present in the RSI, it is occurring in a long-term time-frame.
Furthermore, it is occurring very close to a significant support area, further confirming its validity.
According to the use of these indicators, the QNT price is likely to decrease towards the support line, before possibly initiating another upward move.
Descending Channel
A closer look at the two-hour time-frame shows that the price has been trading inside a descending channel since July 11.
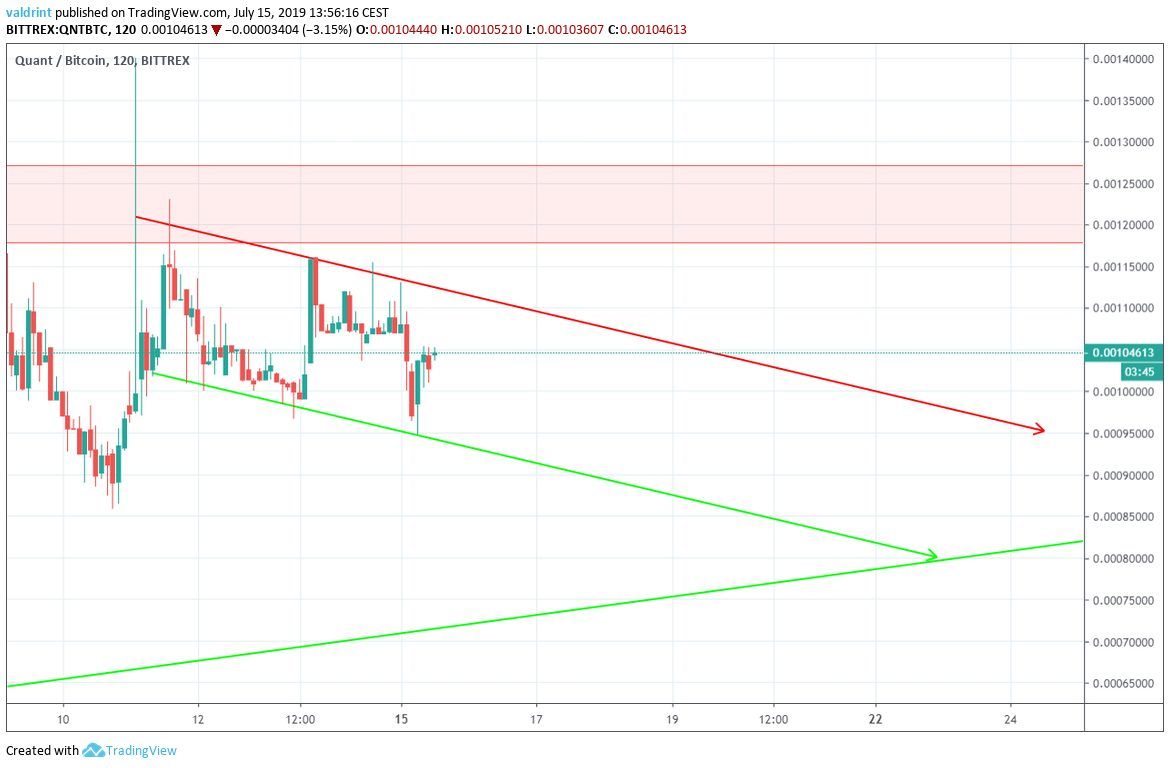
If QNT continues to decrease at the rate predicted by the channel, it should reach the support line by July 23.
An analysis of technical indicators suggests that this is likely to occur.
Summary
QNT has been following an ascending support line.
While doing so, it has reached a major resistance area.
According to our analysis, it is likely that it will decrease before initiating another attempt at a breakout above the resistance area.
The decrease should transpire at the rate predicted by the descending channel.
Do you think the Quant price will reach the support line? Let us know in the comments below.
Disclaimer: This article is not trading advice and should not be construed as such. Always consult a trained financial professional before investing in cryptocurrencies, as the market is particularly volatile.
Images are courtesy of Shutterstock, TradingView.
