A look into the current and potential price movements of QTUM, LIT & REN.
QTUM has broken out from a descending resistance line. Still, it is facing resistance at $5.65.
LIT has broken out from a descending resistance line. However, it was rejected by a horizontal resistance area afterwards.
REN is facing short-term resistance at $1.25. It is potentially trading inside a parallel channel.
Qtum (QTUM)
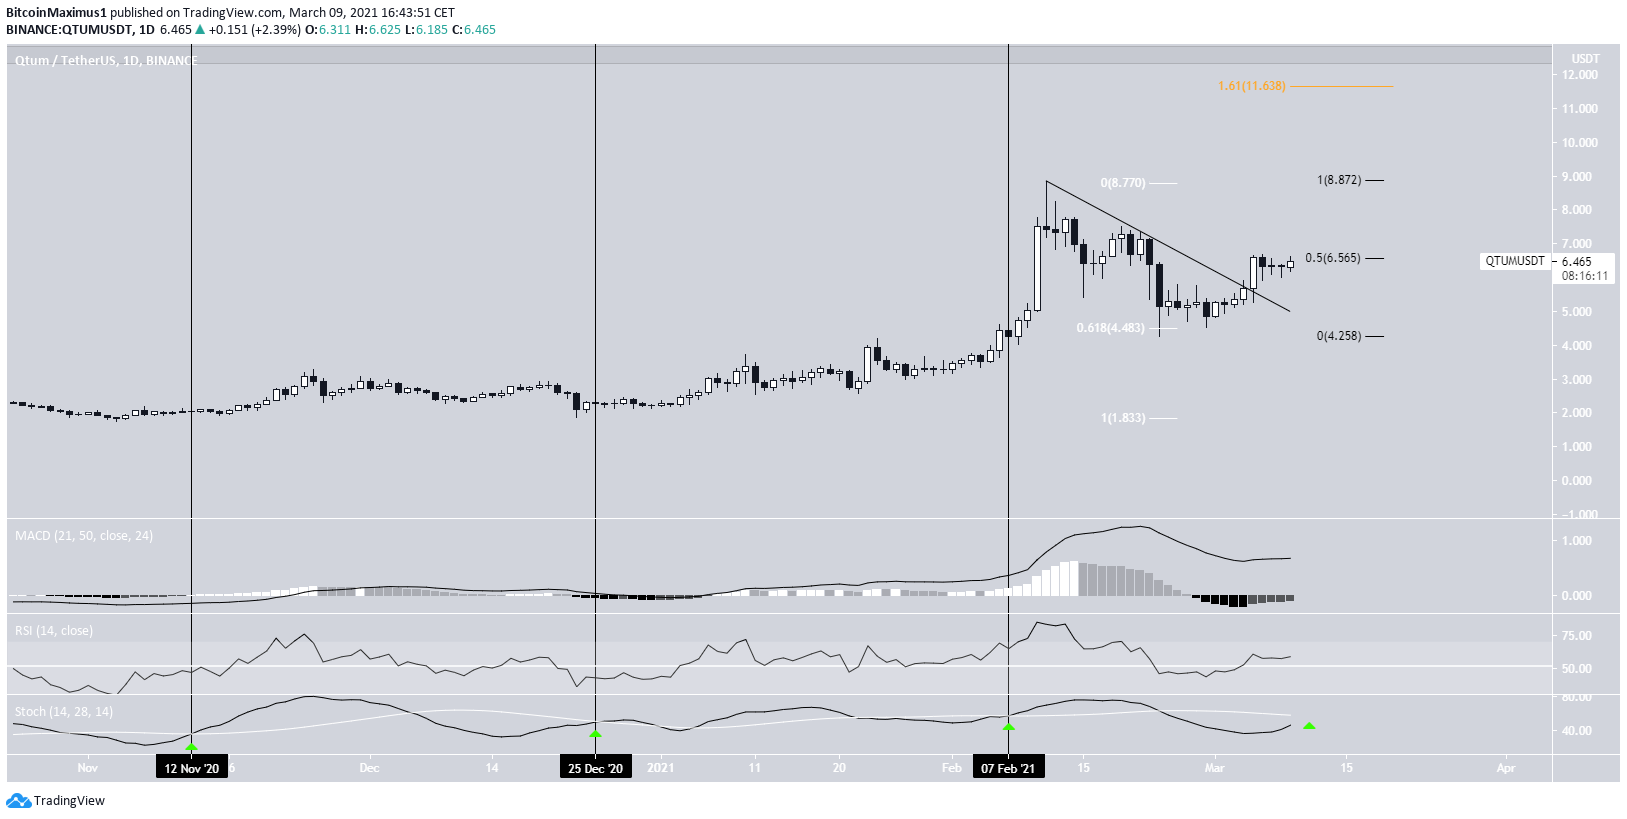
On Feb. 21, QTUM dropped sharply after attaining a high of $8.85. It reached a low of $4.24 two days later and bounced. It has been moving upwards since.
The bounce occurred right at the 0.618 Fib retracement of the entire upward move (white). It created a long lower wick, a sign of buying pressure. Afterward, QTUM broke out from a descending resistance line.
Technical indicators are bullish. The MACD has given a bullish reversal signal. The RSI has broken out above 50.
However, while the Stochastic oscillator is turning upwards, it has yet to make a bullish cross. The three previous crosses led to significant upward movements (shown with the green arrow in the image below).
The closest resistance area is found at $6.56 (black), just above the current price, followed by the February highs at $8.77. If a breakout were to occur, a potential target for the top of the movement is found at $11.63, using an external retracement (orange) on the most recent decrease.
Highlights
- QTUM has broken out from a descending resistance line.
- It is facing resistance at $6.56.
Litentry (LIT)
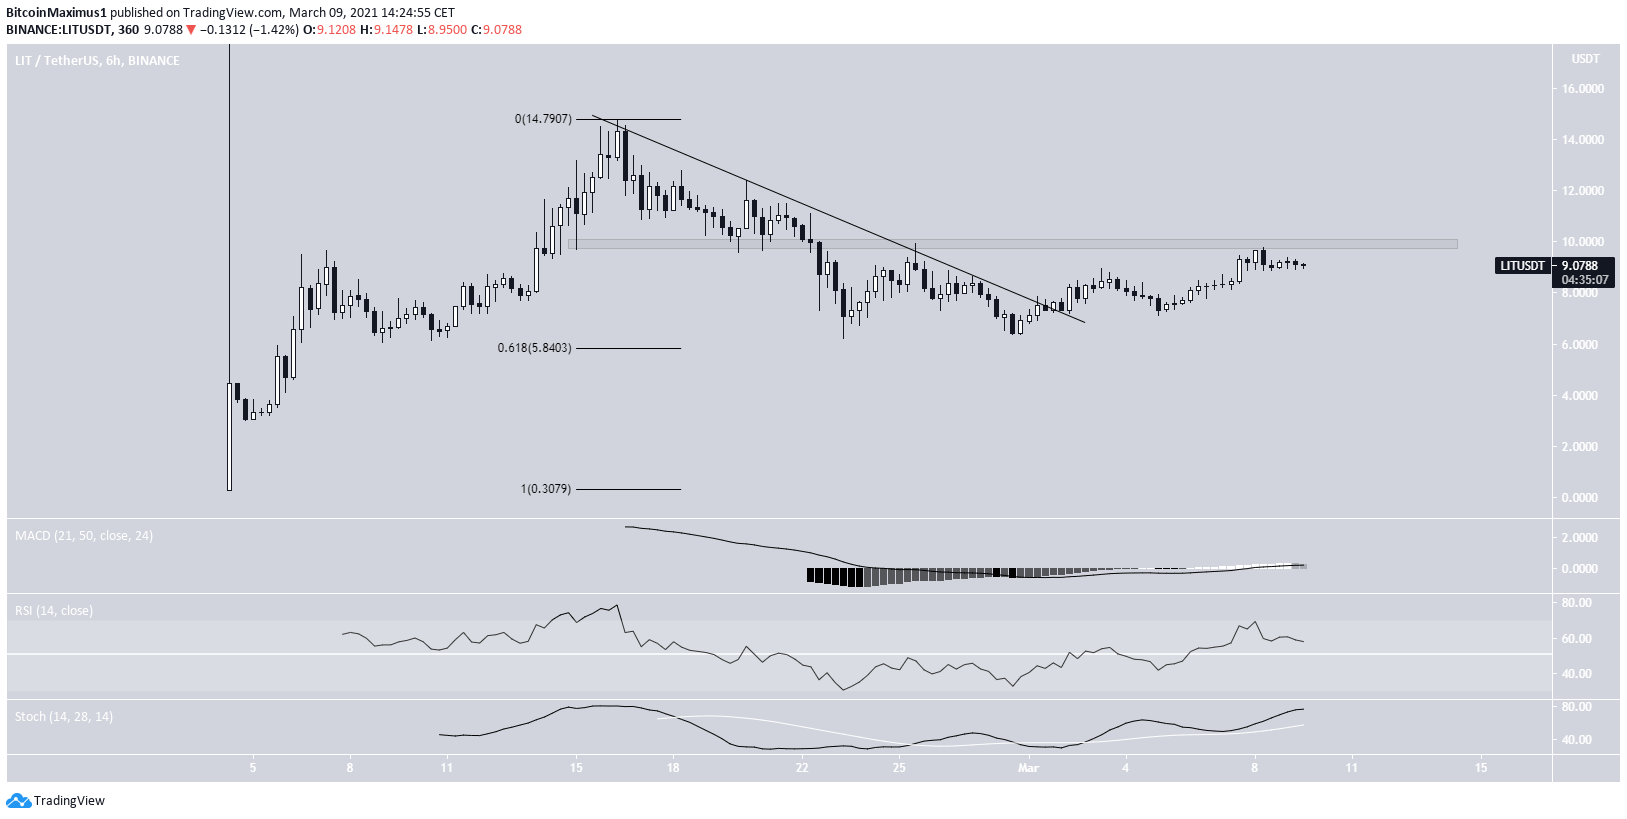
LIT has been decreasing since reaching an all-time high price of $14.78 on Feb. 16. The decrease stopped once LIT reached the 0.618 Fib retracement level at $5.84 on Feb. 23. It has been increasing since.
On March 2, LIT broke out from a descending resistance line. However, it was rejected by the $10 resistance area on March 8.
While technical indicators are bullish, both the RSI & MACD are showing weakness.
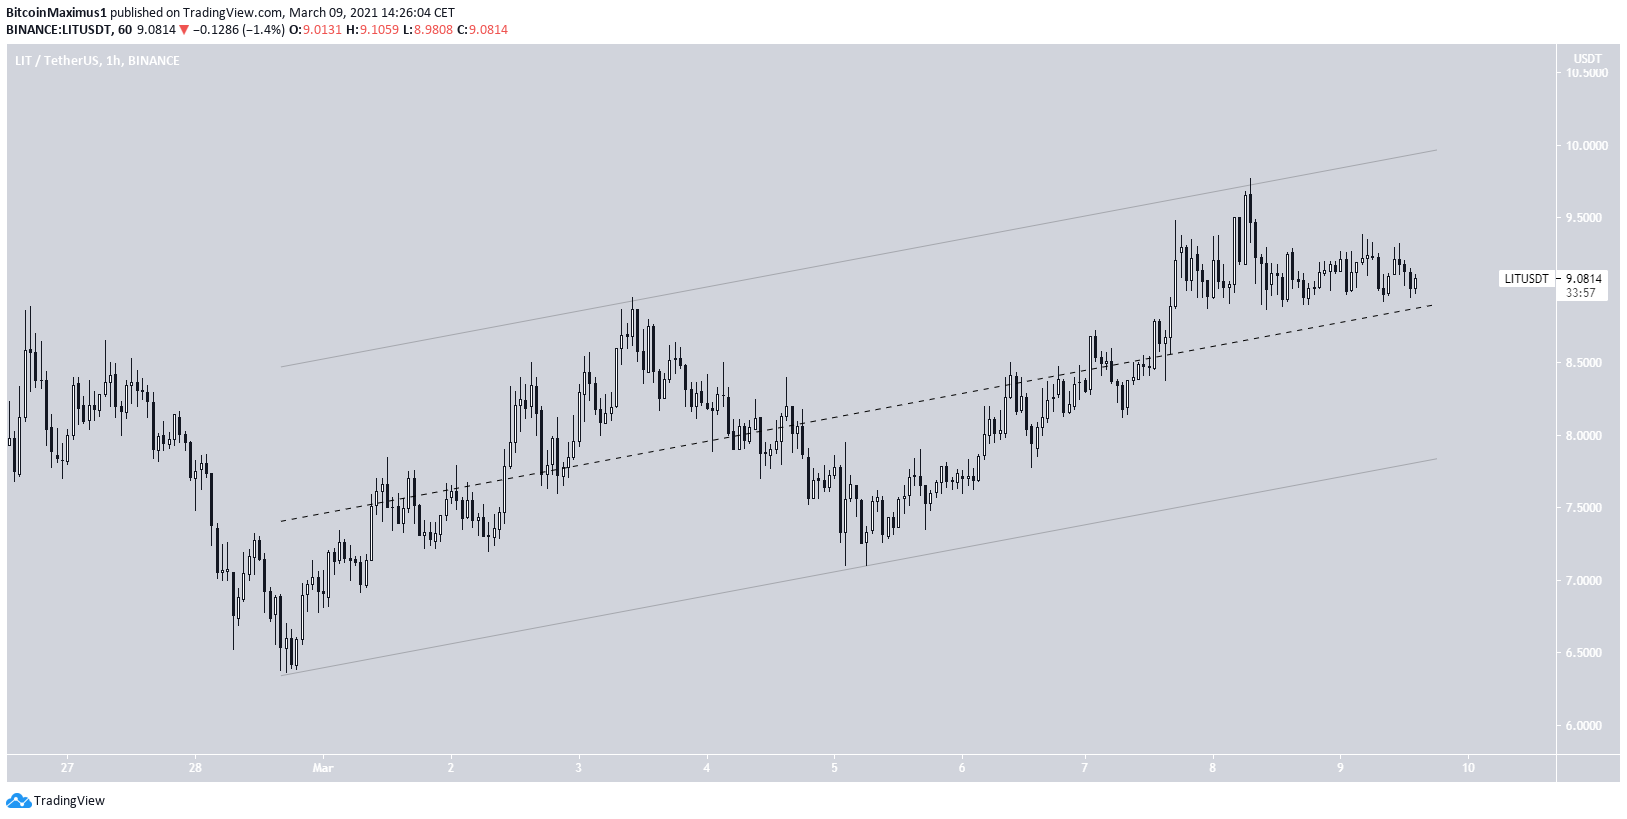
A closer look at the movement shows that LIT is trading inside a parallel ascending channel.
Movement contained inside parallel lines is often corrective. Furthermore, the resistance line of the channel coincides with the previously outlined resistance at $10.
Therefore, until LIT manages to break it, we cannot consider the trend bullish.
Highlights
- LIT has broken out from a descending resistance line.
- It is facing resistance at $10.
Ren (REN)
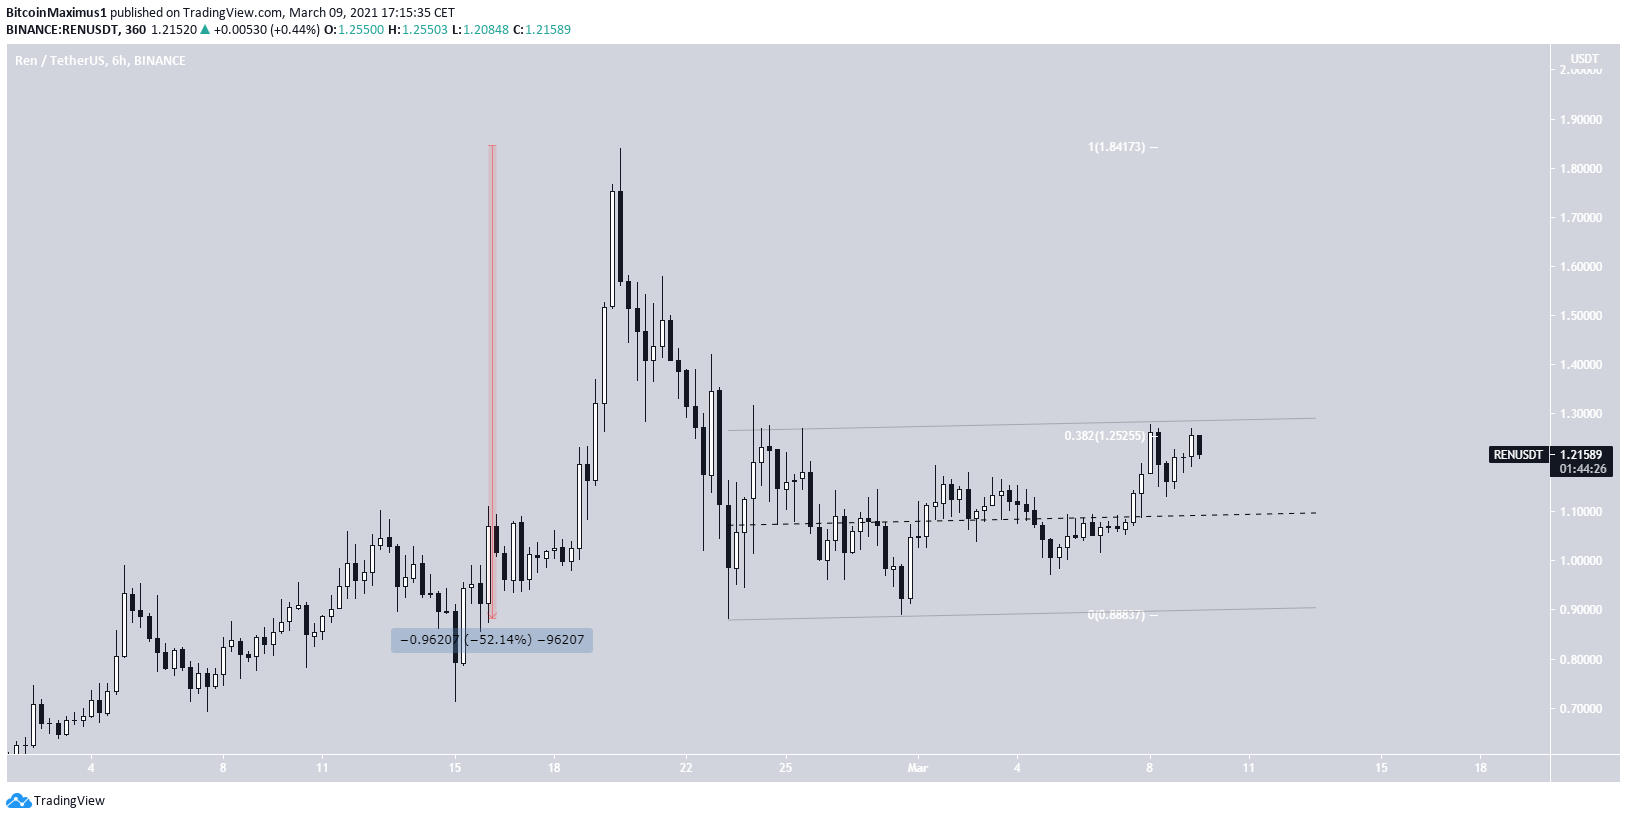
From Feb. 20 to Feb. 23, REN dropped from a high of $1.84 to a low of $0.88. This measured a decrease of 52%.
While REN has been increasing since the upward move has been weak. REN has yet to move above the 0.382 Fib retracement level of the most recent decrease at $1.25. having been rejected twice.
Furthermore, REN is potentially trading inside an ascending parallel channel. If the channel is confirmed, it would mean that this is likely a corrective structure, from which it would expect a breakdown.
Highlights
- REN is facing resistance at $1.25.
- It is potentially trading inside a parallel ascending channel.
For BeInCrypto’s latest Bitcoin (BTC) analysis, click here.
Disclaimer
In line with the Trust Project guidelines, this price analysis article is for informational purposes only and should not be considered financial or investment advice. BeInCrypto is committed to accurate, unbiased reporting, but market conditions are subject to change without notice. Always conduct your own research and consult with a professional before making any financial decisions. Please note that our Terms and Conditions, Privacy Policy, and Disclaimers have been updated.


