

The main goal of the Quant project is Quant Network. It is a technology that uses an operating system in order to automate trust functions between several blockchains. The project has reached several significant partnerships — most notably with Oracle, Amazon Web Services, and Nvidia.
On August 18, 2019, it reached a partnership with AX Trading — with the aim of enabling “Interoperable and Regulatory-Compliant Digital Assets and Security Tokens in Capital Markets and Exchange Infrastructure” by integrating Quant’s technology into the AX Trading network.
The network uses its own tokens called QNT. Their main role is to provide access applications inside the Quant platform.
As of September 2019, there is a circulating supply of 12,072,738 QNT in circulation out of the 14,612,493 total supply. Additionally, QNT coin has a market cap of $77,528,138 — ranking #59.
In 2019, it has been listed on several exchanges — most recently, on the Switcheo exchange on July 30.
With this in mind, let’s take a look at the price action since its inception, do quantitative analysis, and make a prediction about the price at the end of 2019, 2020, and 2024.
Important Highs and Lows
| Highs | Lows |
| $5.02 – October 24, 2018 | $0.69 – November 24, 2018 |
| $5.86 – February 10, 2019 | $1.68 – May 10, 2019 |
| $15.59 – July 9, 2019 | $4.96 – September 1, 2019 |
Outlook
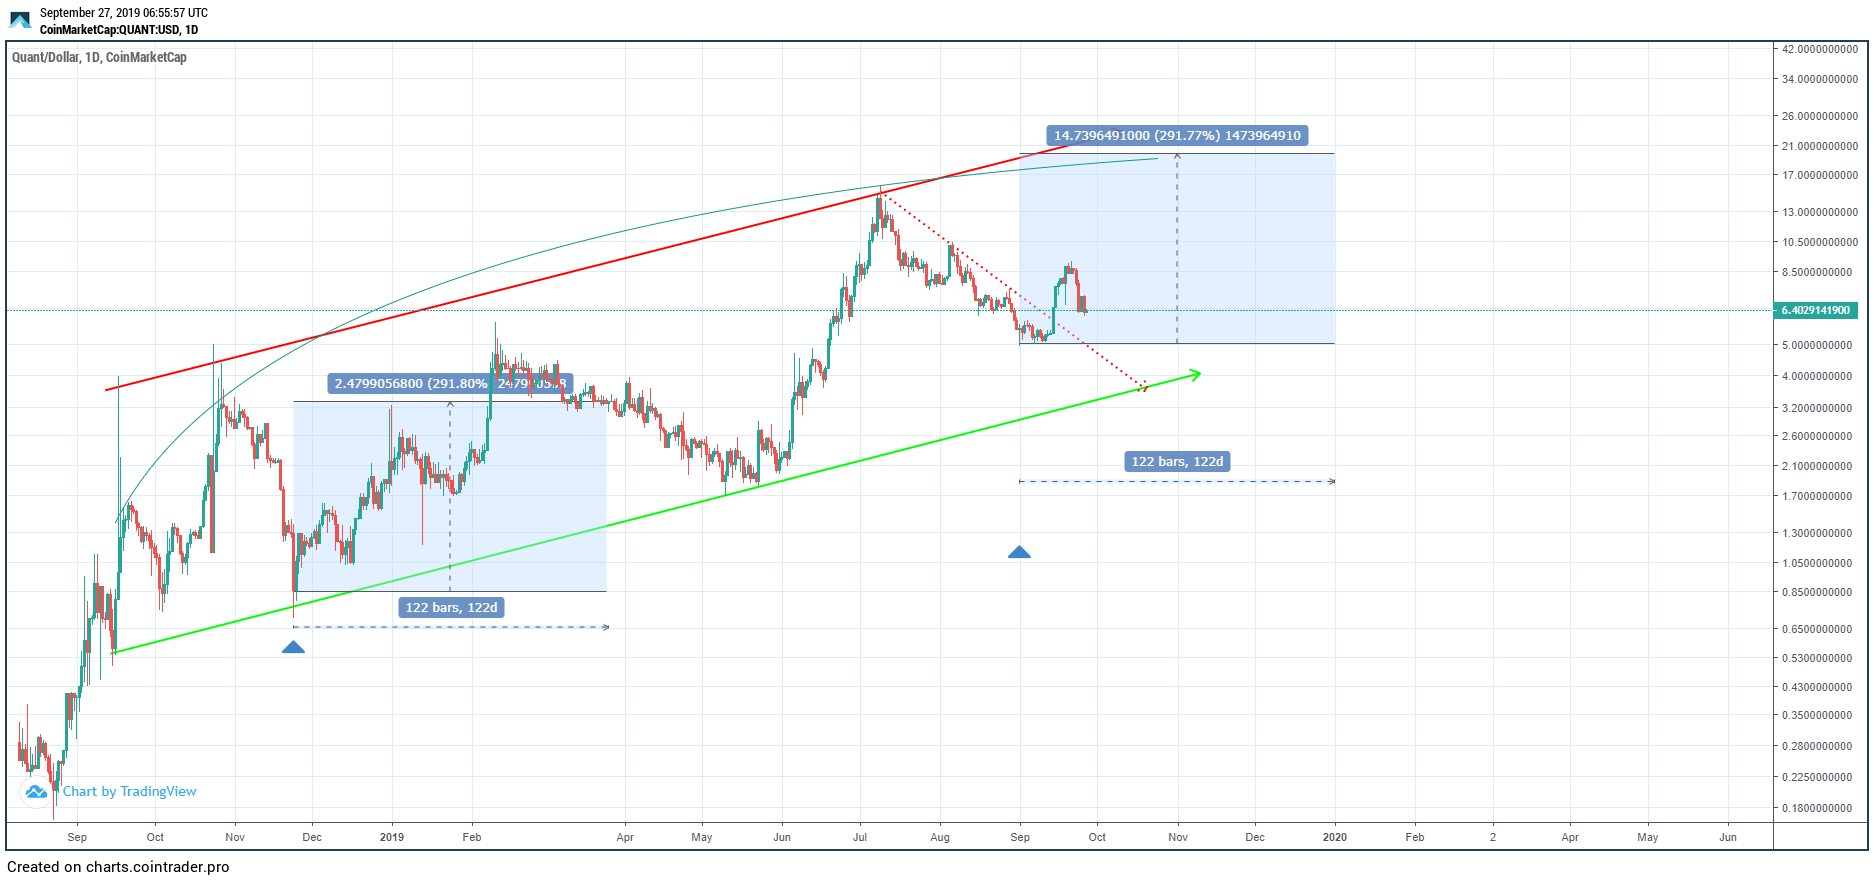
The QNT price has had significant movement since October 2018, when it was first launched. What immediately pops up is the strong support area found at $5.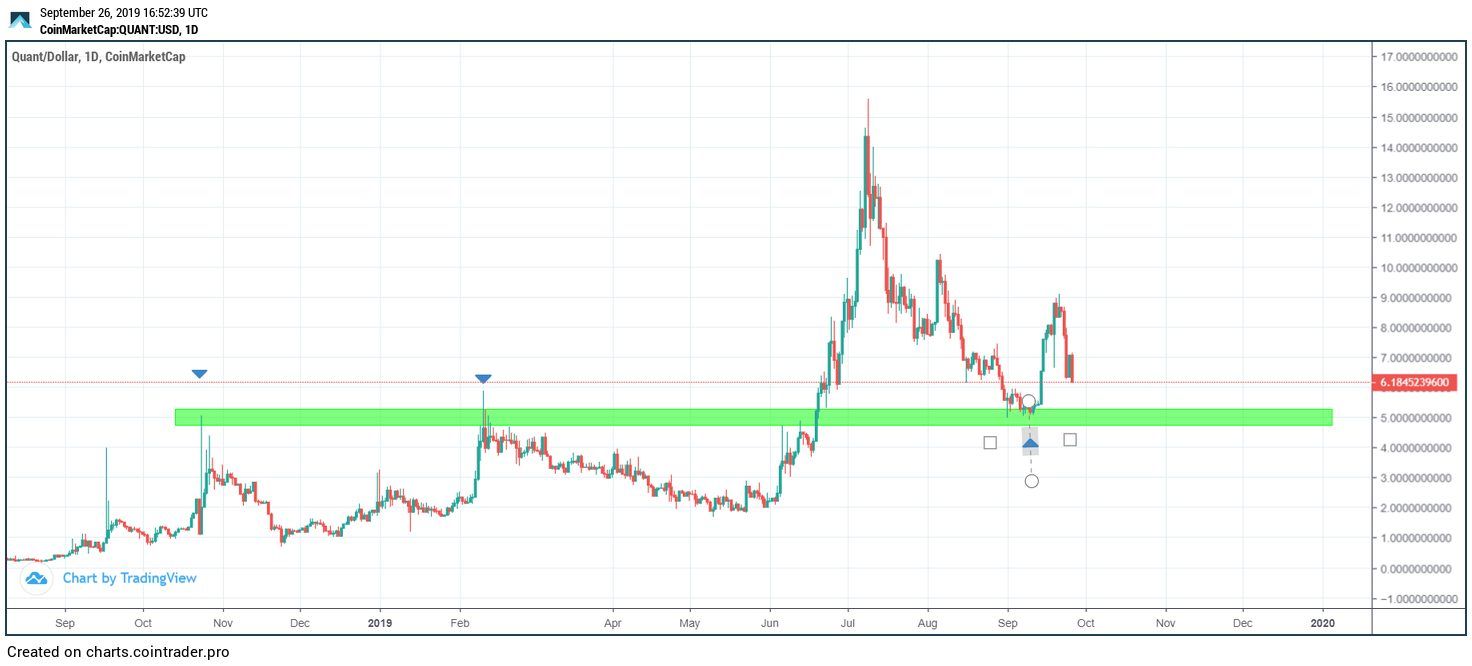 This area previously acted as resistance until June 2019. After finally breaking out, the price retraced and validated it as support on September.
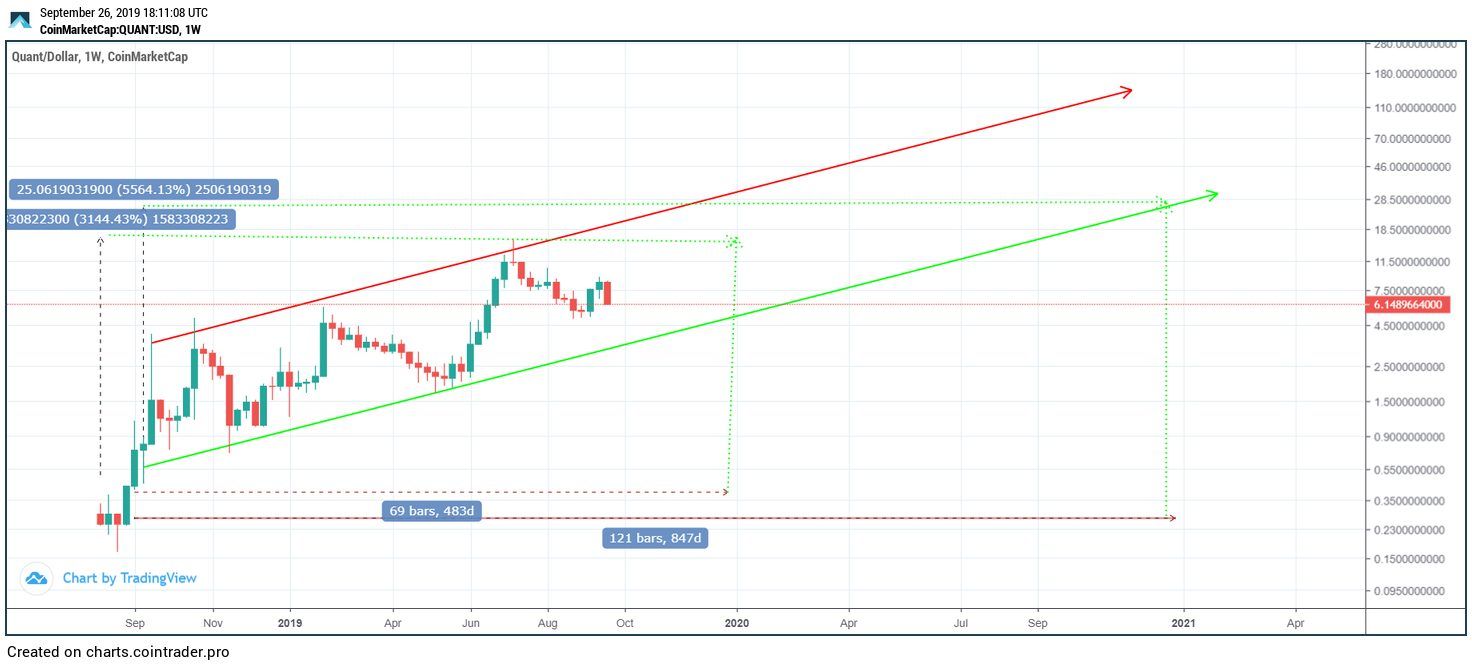
Additionally, using the logarithmic chart, we can see that almost the entire price movement of QNT (until now) can be contained inside an ascending channel. The resistance and support lines present good levels to sell and buy, respectively.
Every time the price has touched the resistance line, it did not reach it again without first falling to support.
In our price predictions, we will operate with the assumption that this will continue.
This area previously acted as resistance until June 2019. After finally breaking out, the price retraced and validated it as support on September.
Additionally, using the logarithmic chart, we can see that almost the entire price movement of QNT (until now) can be contained inside an ascending channel. The resistance and support lines present good levels to sell and buy, respectively.
Every time the price has touched the resistance line, it did not reach it again without first falling to support.
In our price predictions, we will operate with the assumption that this will continue.
 Most recently, the price touched the resistance line when it reached a high of $15.59 on July 9. Since then, it has yet to reach the support line.
While it is likely it will do so, the support line is currently below the support area at $5 — which we do not believe will be broken. It is likely that the price will touch the support line after November 10, around which date the support line will move above the support area.
Most recently, the price touched the resistance line when it reached a high of $15.59 on July 9. Since then, it has yet to reach the support line.
While it is likely it will do so, the support line is currently below the support area at $5 — which we do not believe will be broken. It is likely that the price will touch the support line after November 10, around which date the support line will move above the support area.
Average Rate of Increase
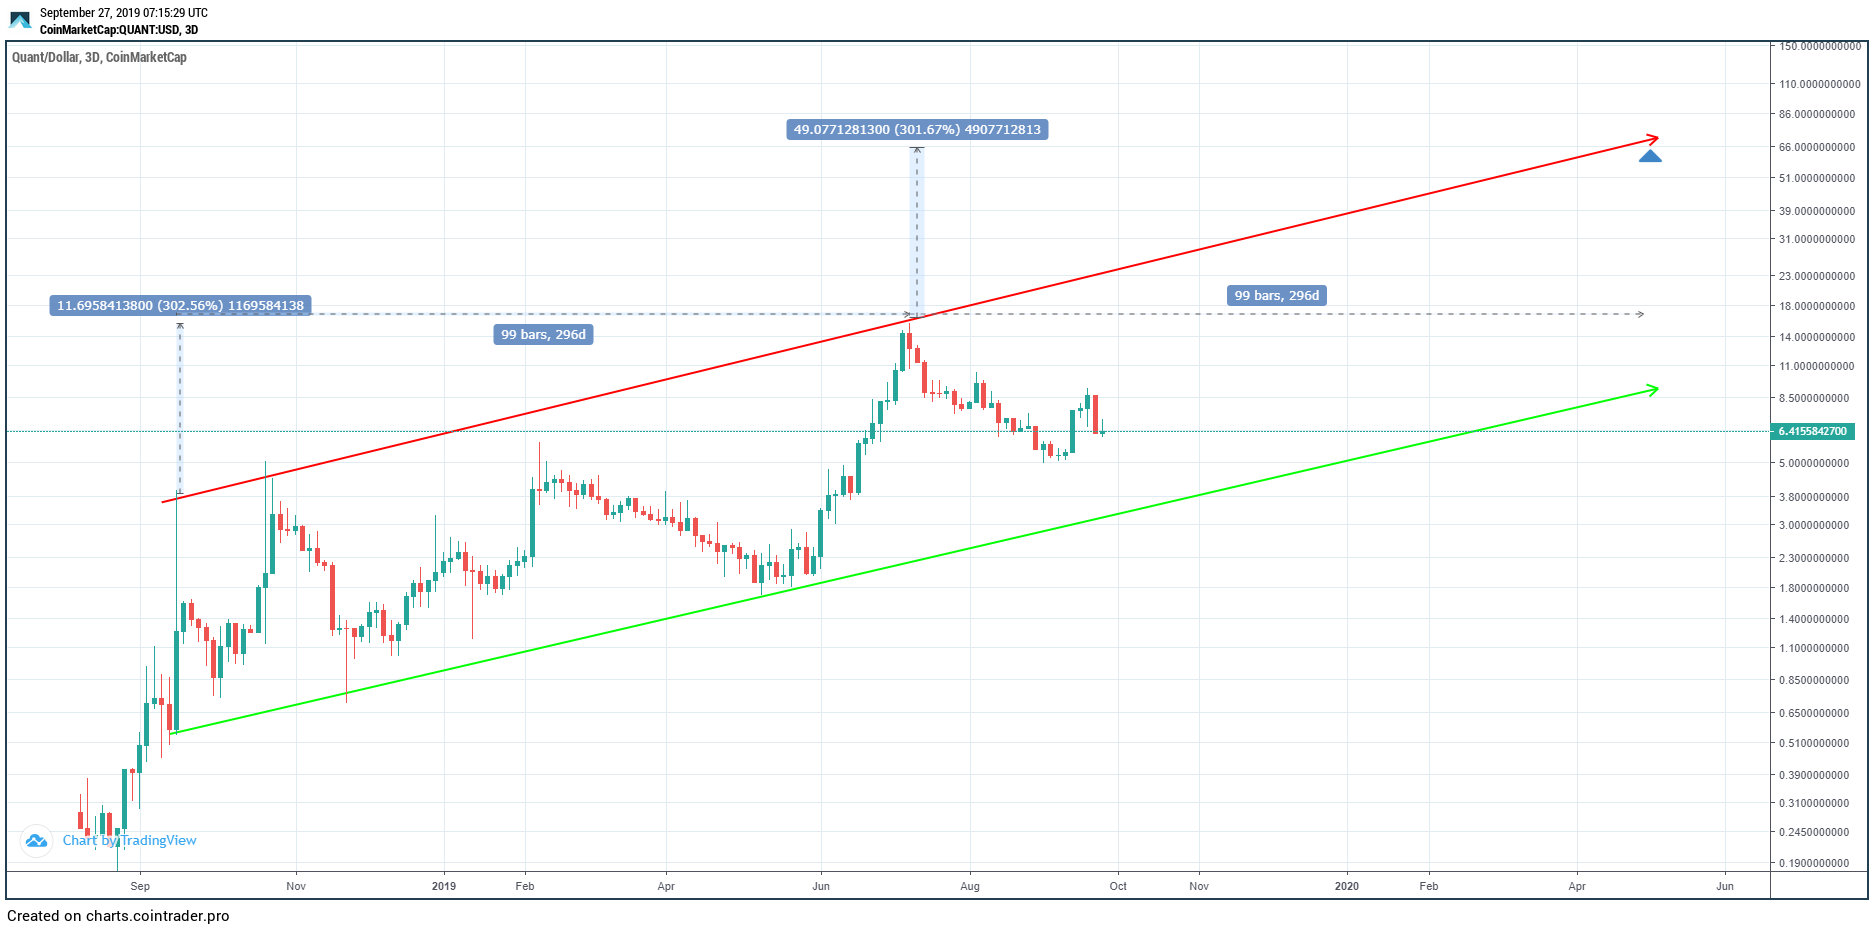
The price has been trading inside the channel for 387 days. While in it, it has increased by 1248 percent. In order to measure an average rate of increase, we will measure the rate of increase and the time period from the initiation of the channel until the times the price has reached the resistance and support lines, respectively. The first time the price reached the resistance line was October 24, 2018. This occurred after 50 days, marking an increase of 695 percent. This amounts to an average increase of 13.84 percent per day. The first time QNT touched the support line was November 24, 2018. This occurred after 81 days and marked an increase of 52 percent. This amounts to an average increase of 0.64 percent. The second time the price touched the resistance line was on July 9, 2019. This occurred after 308 days and marked an increase of 3262 percent. This amounts to an average increase of 10.5 percent per day. Lastly, the second time the price touched the support line was on May 10, 2019. This occurred after 248 days and marked an increase of 263 percent. This amounts to an average increase of 1.06 percent per day. The average of the four average rates of increase (13.84, 10.5, 0.64 and 1.06) is 6.51. Therefore, while inside the channel, the price has increased by an average of 6.51 percent per 24 hours.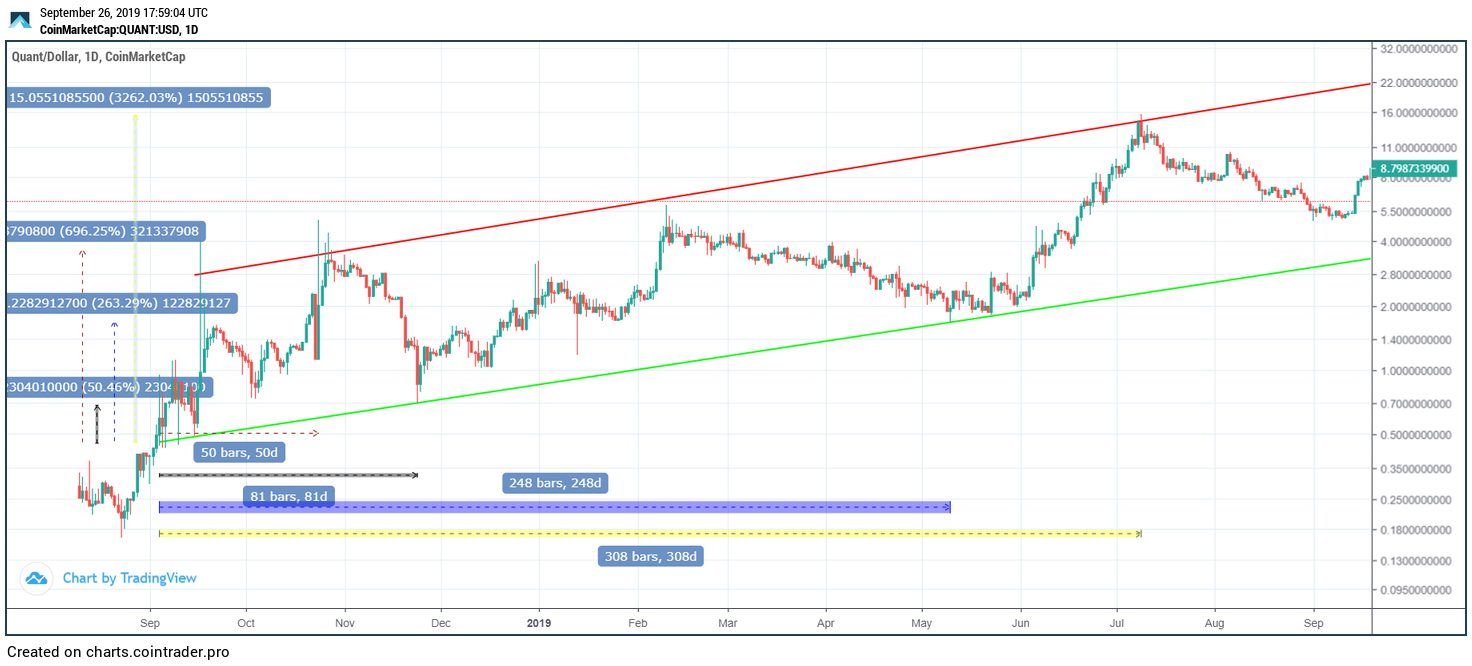 Using this same ratio gives us a price of $16.3 on December 31, 2019, and $26.2 on December 21, 2020.
However, the drawback of using this method is that it only measures the average rate of increase. Since the actual price increase is not linear, it can be extremely inaccurate when trying to measure the price on a certain day. However, it works a lot better when trying to measure the average price of the period.
Using this same ratio gives us a price of $16.3 on December 31, 2019, and $26.2 on December 21, 2020.
However, the drawback of using this method is that it only measures the average rate of increase. Since the actual price increase is not linear, it can be extremely inaccurate when trying to measure the price on a certain day. However, it works a lot better when trying to measure the average price of the period.
 So, while the prediction for the end of 2020 seems reasonable, the one for 2019 seems somewhat off. A significant bull-trend would have to occur for it to be reached. Additionally, it marks an all-time high price.
Therefore, we will try a different method of predicting the price and see if we get similar results.
So, while the prediction for the end of 2020 seems reasonable, the one for 2019 seems somewhat off. A significant bull-trend would have to occur for it to be reached. Additionally, it marks an all-time high price.
Therefore, we will try a different method of predicting the price and see if we get similar results.
RSI
We will use the RSI and moving averages — since they are tools used in a large number of trading strategies. Looking at the 12-hour RSI, we can see that there have only been two occasions in which it fell below 30 — namely, on November 24, 2018, and September 1, 2019. Furthermore, on these two dates, the price was below both the 50- and 100-day moving averages (MA) — which had not yet made a bearish cross.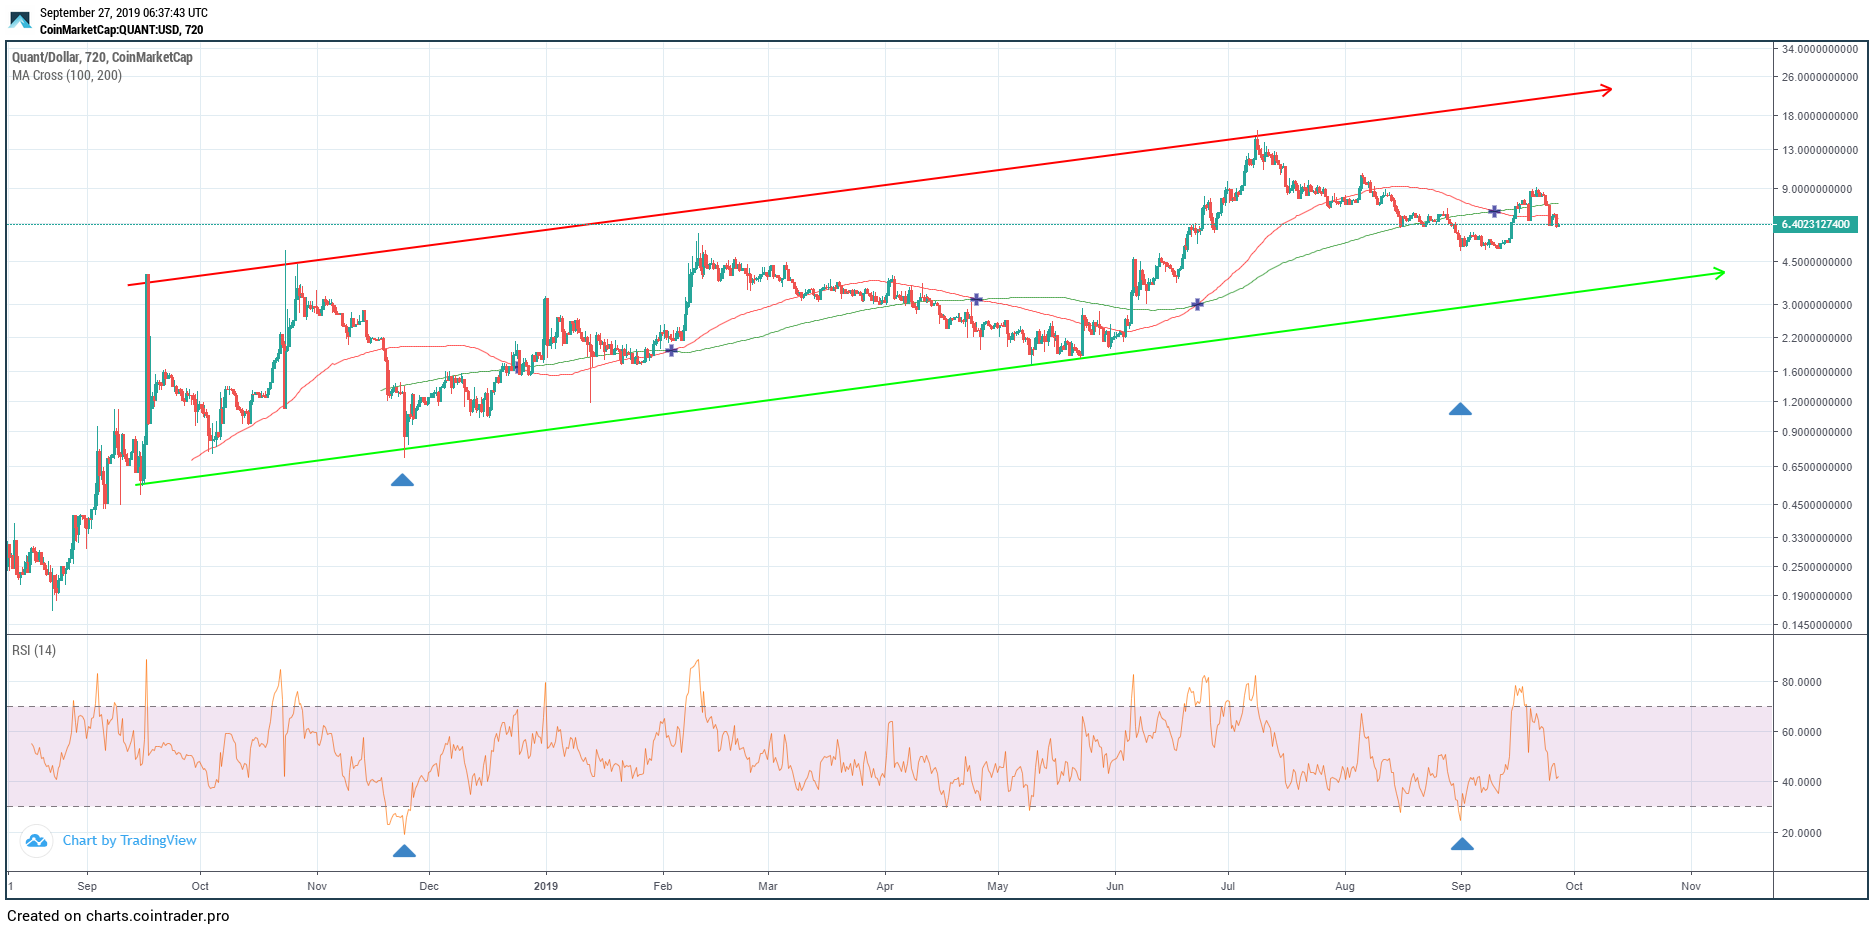 So, we are going to make the assumption that on these dates the price was at similar points in its market cycle.
Doing so, and projecting the same rate of increase gives us a price of $19.7 on December 31, 2019.
So, we are going to make the assumption that on these dates the price was at similar points in its market cycle.
Doing so, and projecting the same rate of increase gives us a price of $19.7 on December 31, 2019.
 This price fits inside the channel. Interestingly, it is even higher than that of our first projection.
Using the same method in the three-day RSI, we can see that it has been above 85 only twice — on September 15, 2018, and July 9, 2019.
During these two times, the price was right on the resistance line.
This price fits inside the channel. Interestingly, it is even higher than that of our first projection.
Using the same method in the three-day RSI, we can see that it has been above 85 only twice — on September 15, 2018, and July 9, 2019.
During these two times, the price was right on the resistance line.
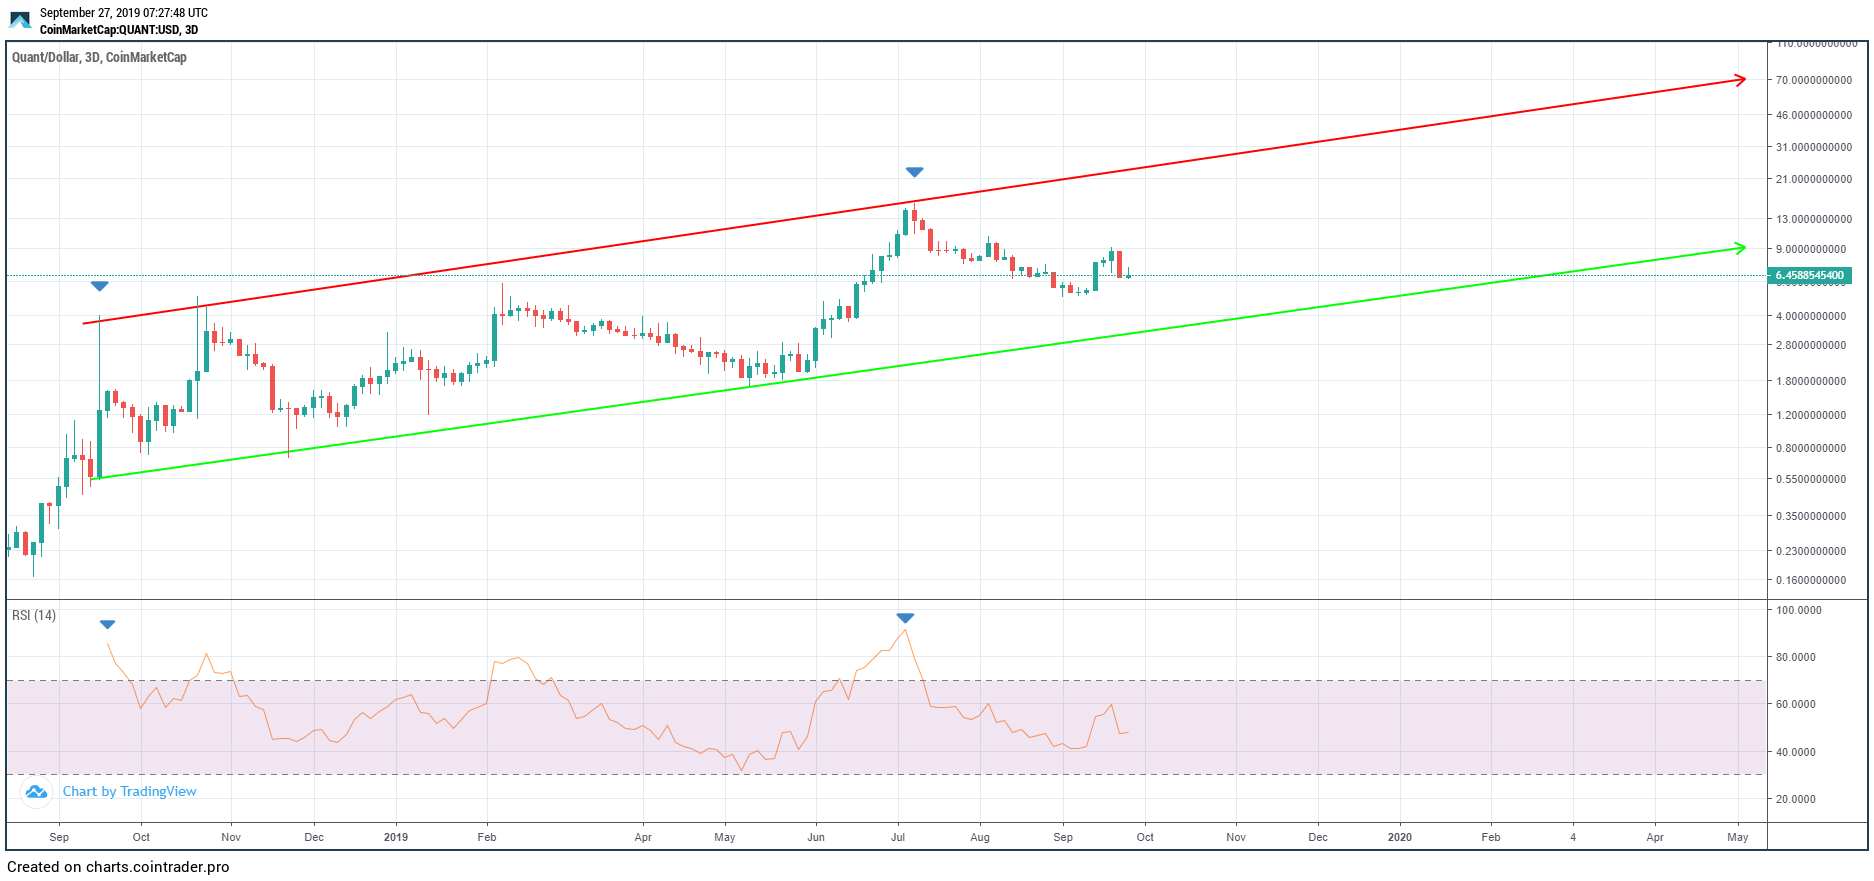 Assuming that the price was in similar places in the market cycles during these two dates, we can predict the next time this occurs.
Projecting the same rate of increase, we get a price of $66.2 on May 3, 2020.
Interestingly enough, this falls right on the resistance line of the channel — increasing the validity of this prediction.
Assuming that the price was in similar places in the market cycles during these two dates, we can predict the next time this occurs.
Projecting the same rate of increase, we get a price of $66.2 on May 3, 2020.
Interestingly enough, this falls right on the resistance line of the channel — increasing the validity of this prediction.
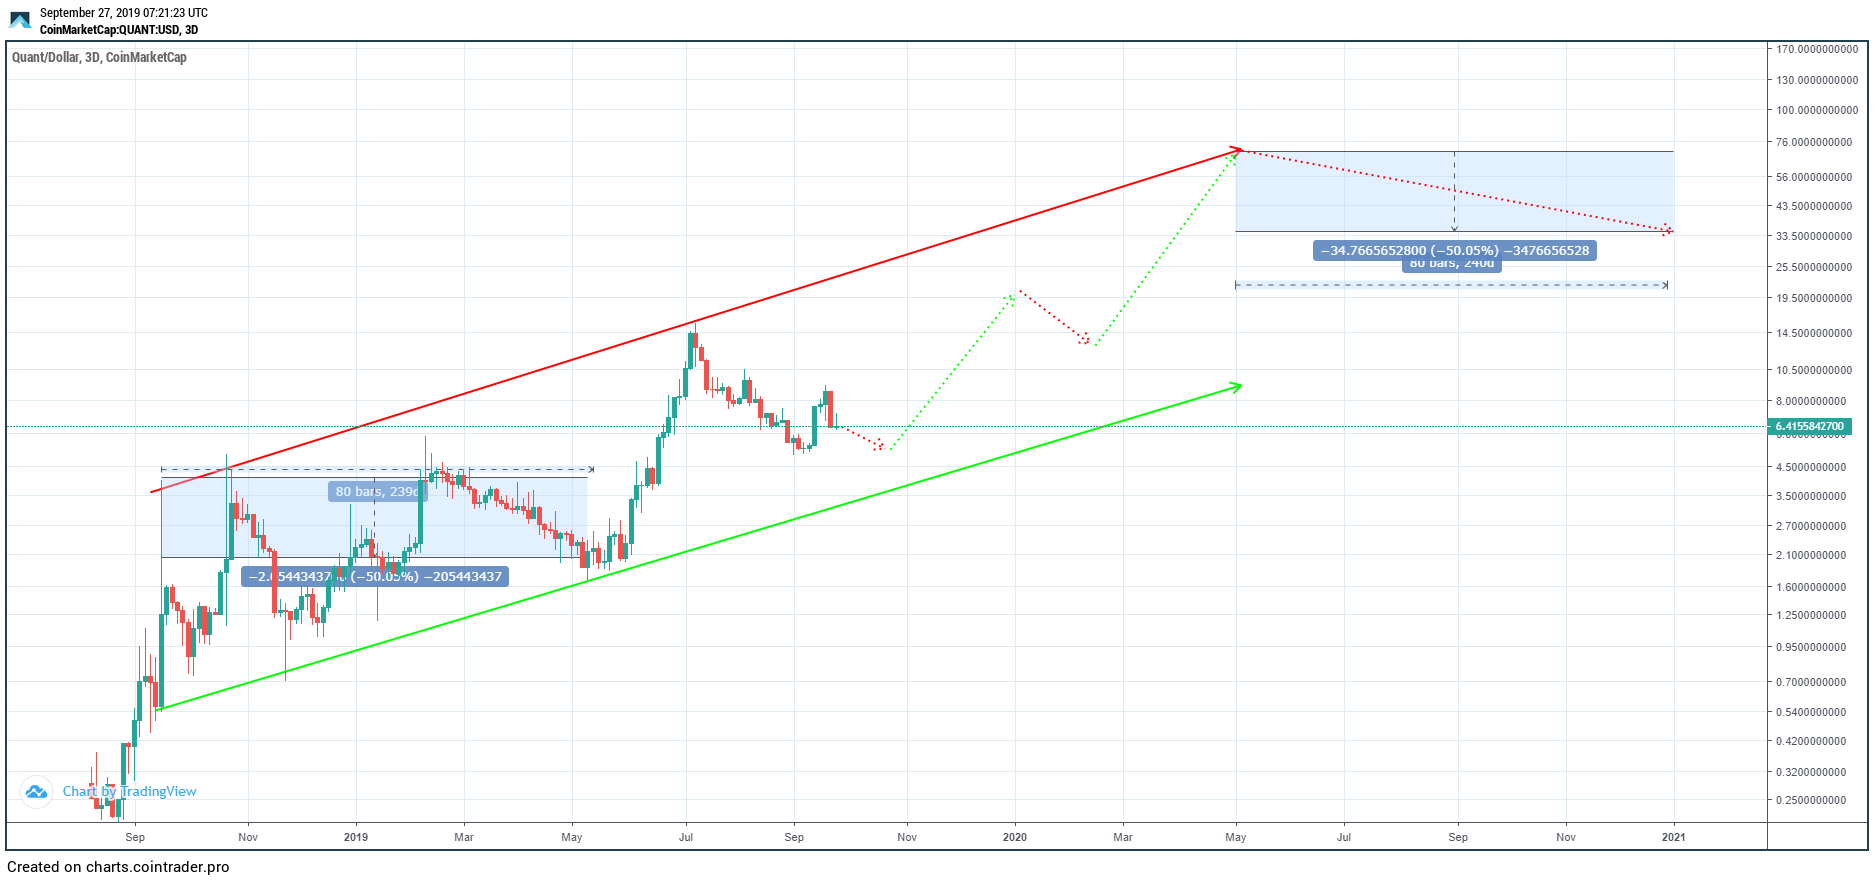
 This should be a high of 2020. Afterward, the price is likely to decrease. Using the same rate of decrease as after September 15, 2018, gives us a price of $34.1 on December 31, 2020.
Quant Price Prediction 2019
For the price at the end of 2019, we get a slightly different price of $16.2 and $19.3 using different methods. However, the price movement should be similar. QNT is likely to decrease in October, possibly reaching the support line, before initiating a rapid upward move.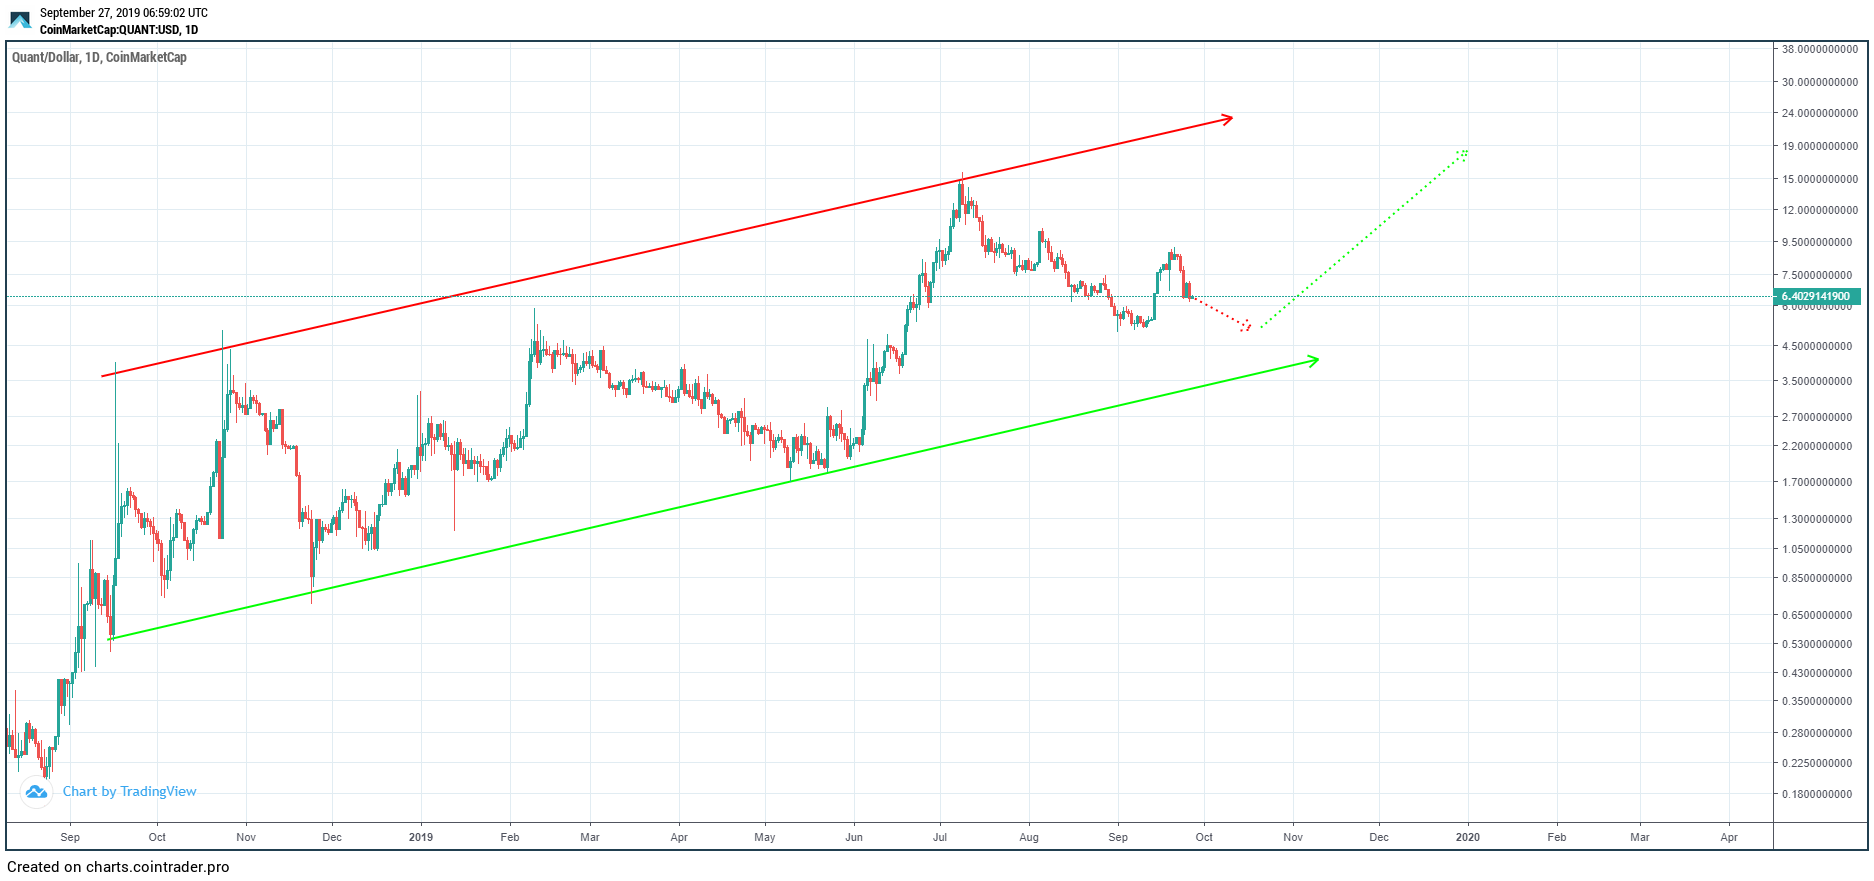
Quant Price Prediction 2020
For 2020, we get a price of $26.2 and $34.1 respectively. If the price continues trading within the channel, the $34.1 price on December 31, 2020 falls right on the support line. For the $26.2 prediction to be validated QNT would have to break down from the channel.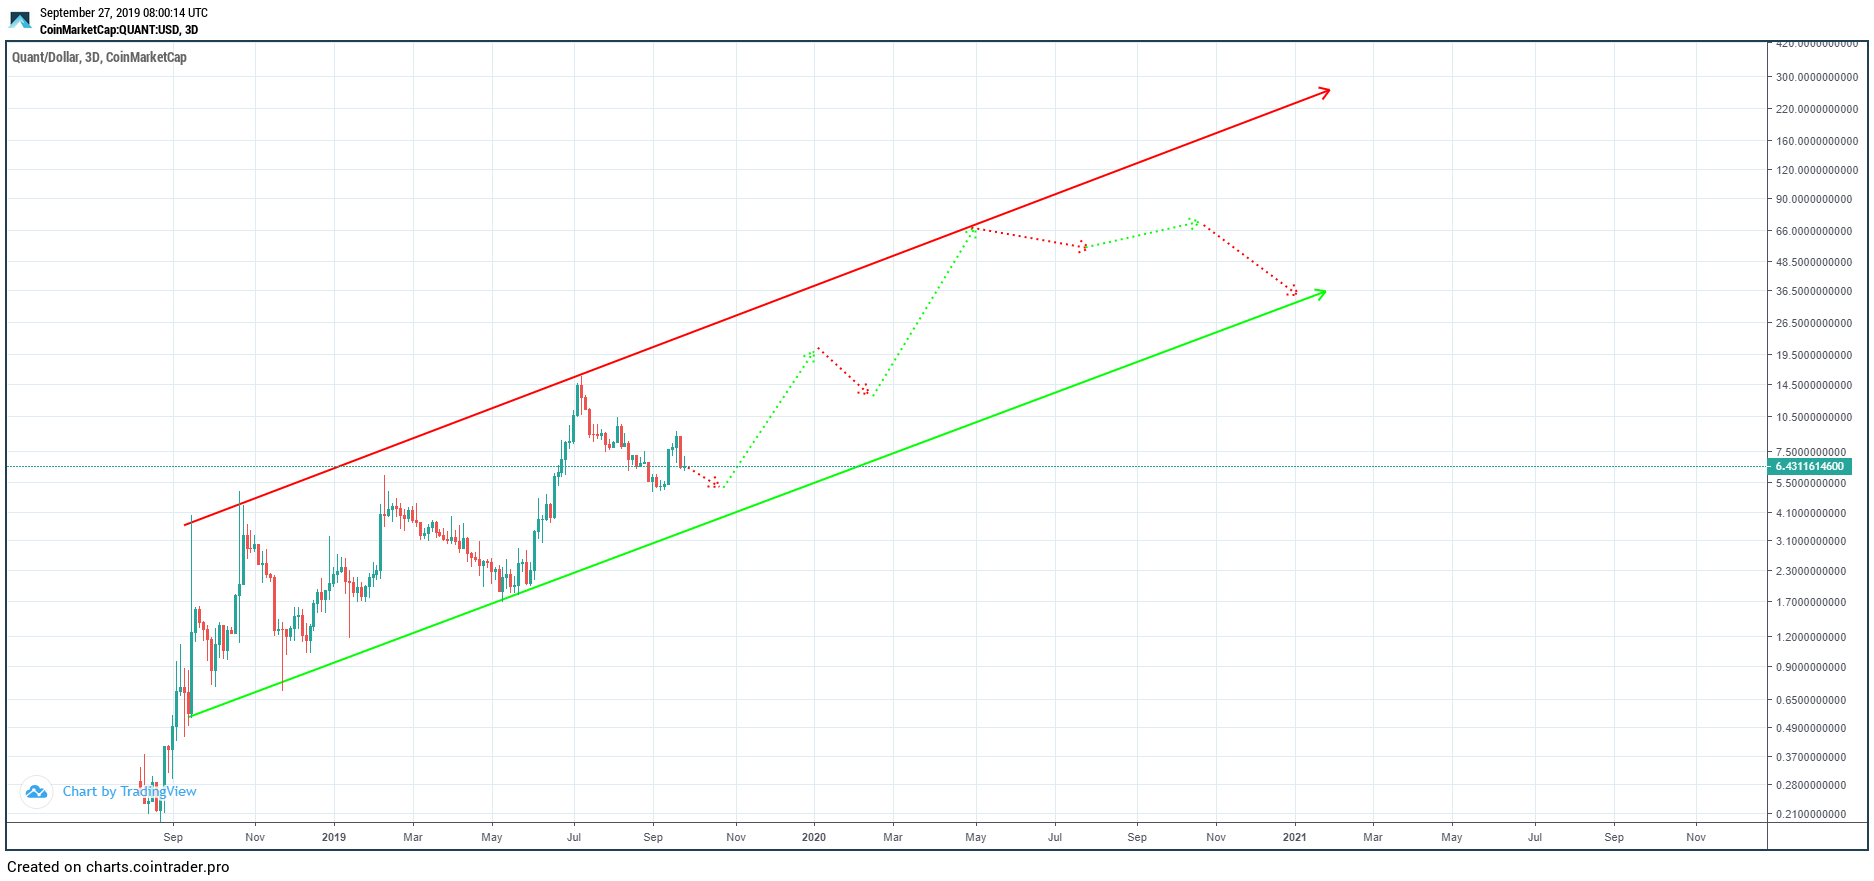
Quant Price Prediction 2024
For the prediction five years from now, we will use the average rate of increase only. We stated above that the price has increased by 6.51 percent per day while inside the channel. Assuming that the rate of increase holds constant, we get a price of $698.1 on December 31, 2024. A very rough outline of how the price might move is given below. In order for that price to be reached, however, QNT would have to break down from the channel.
This would likely alter its average rate of increase.
However, this is a prediction made five years in advance with only one year of data — thus, it is not likely to be very accurate.
The full results are shown in the table below:
In order for that price to be reached, however, QNT would have to break down from the channel.
This would likely alter its average rate of increase.
However, this is a prediction made five years in advance with only one year of data — thus, it is not likely to be very accurate.
The full results are shown in the table below:
| Average Price | RSI | |
| December 31, 2019 | $16.3 | $19.2 |
| December 31, 2020 | $26.2 | $34.1 |
| December 31, 2024 |
$689.1 |
|
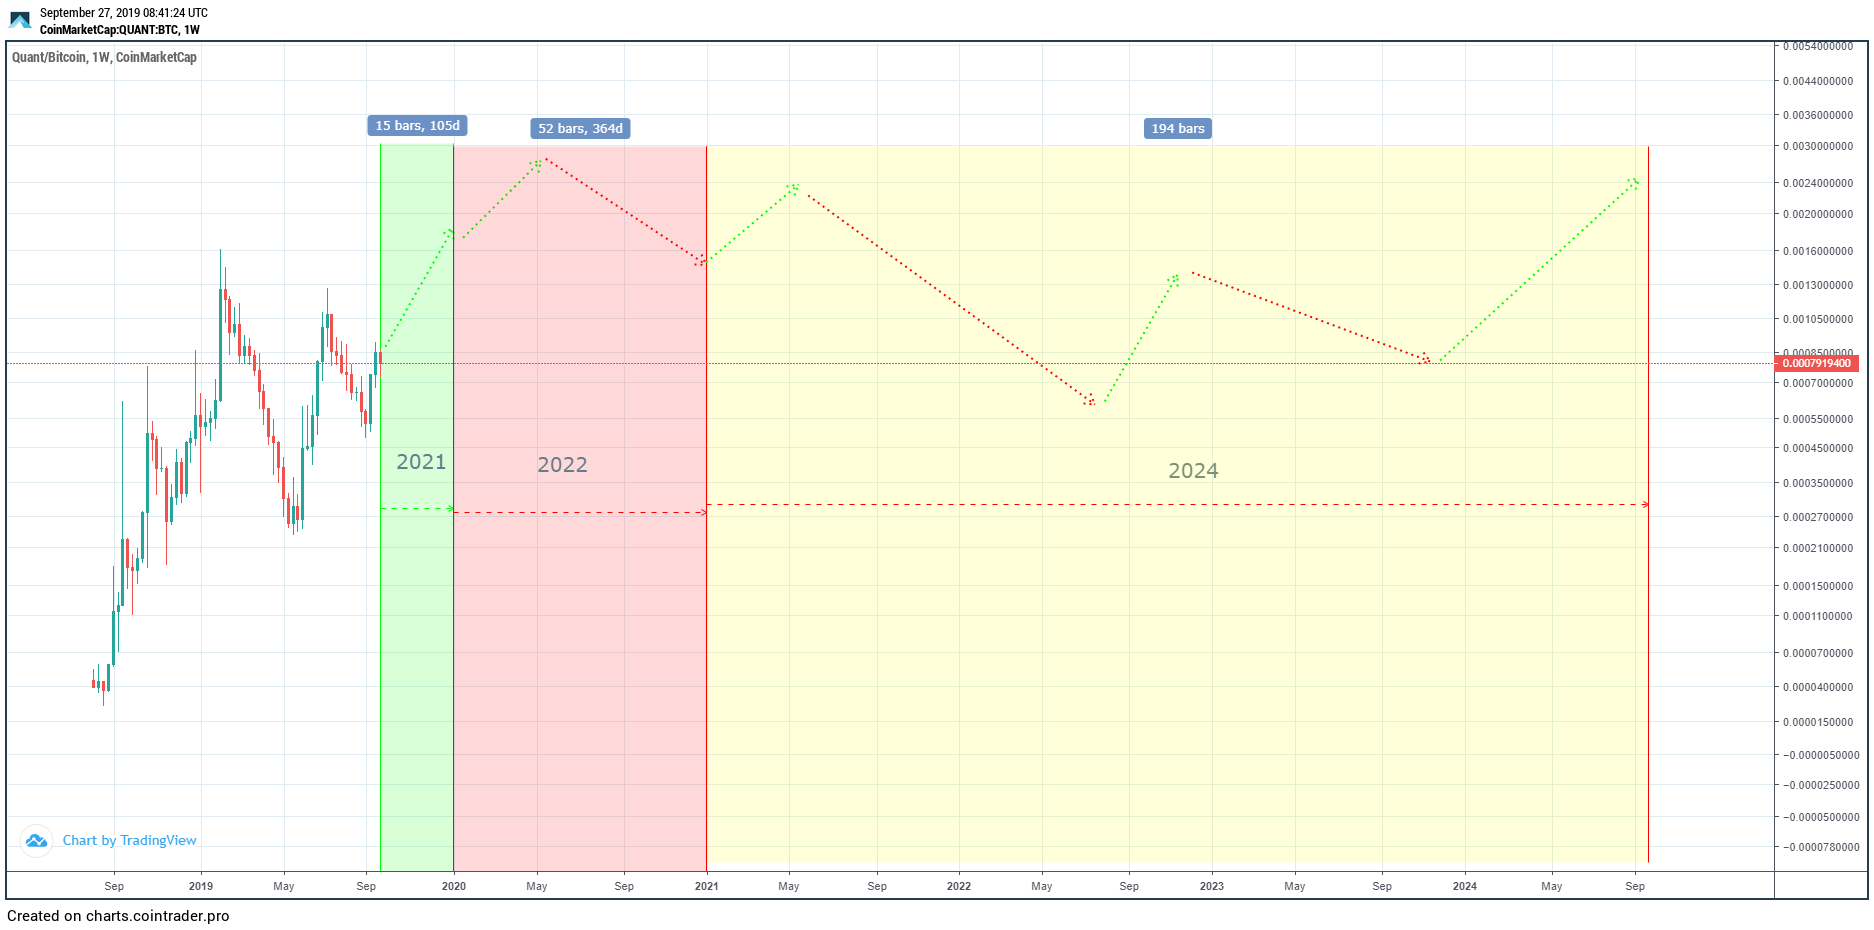
QNT/BTC Predictions
We have the QNT/USD prediction for the next five years. Additionally, we have done the same for the price of Bitcoin. Since a high number of traders use QNT/BTC, we will use their respective prices to find the QNT/BTC price. For Bitcoin, we predicted a price between $8780 and $10,600 for 2019, between $20,200 and $21,000 for 2020 and between $180,000-$380,000 for 2025. Using the QNT/USD prices, we get:- December 31, 2019: ₿0.00183694
- December 31, 2020: ₿0.00146253
- December 31, 2024: ₿0.00246071
 Do you think our Quant predictions are accurate? What are your thoughts on the methods used to reach our conclusions? Let us know in the comments below.
Disclaimer: This article is not trading advice and should not be construed as such. It is only to be used for informational purposes. Always consult a trained financial professional and apply proper risk management strategies before investing in cryptocurrencies, as the market is particularly volatile. Images are courtesy of Shutterstock, TradingView.
Top crypto platforms in the US
Disclaimer
In line with the Trust Project guidelines, this price analysis article is for informational purposes only and should not be considered financial or investment advice. BeInCrypto is committed to accurate, unbiased reporting, but market conditions are subject to change without notice. Always conduct your own research and consult with a professional before making any financial decisions. Please note that our Terms and Conditions, Privacy Policy, and Disclaimers have been updated.

Valdrin Tahiri
Valdrin discovered cryptocurrencies while he was getting his MSc in Financial Markets from the Barcelona School of Economics. Shortly after graduating, he began writing for several different cryptocurrency related websites as a freelancer before eventually taking on the role of BeInCrypto's Senior Analyst.
(I do not have a discord and will not contact you first there. Beware of scammers)
READ FULL BIO
Sponsored
Sponsored