
The network’s decision to replace its native token with a new one should typically spark a positive response. However, since Polygon confirmed the September 4 date for migrating its native token MATIC to POL, it has faced a series of problems.
User activity has declined, and large holders have steadily offloaded their tokens, putting downward pressure on MATIC’s price. Now that the migration is complete, these issues remain and could persist for an extended period.
Polygon’s New Token Name Will Not Save Its Falling Value
Yesterday, Polygon completed the 1:1 migration of its native token from MATIC to POL, making it the network’s gas and staking token. Since then, the price problems that faced MATIC have begun to trail POL.
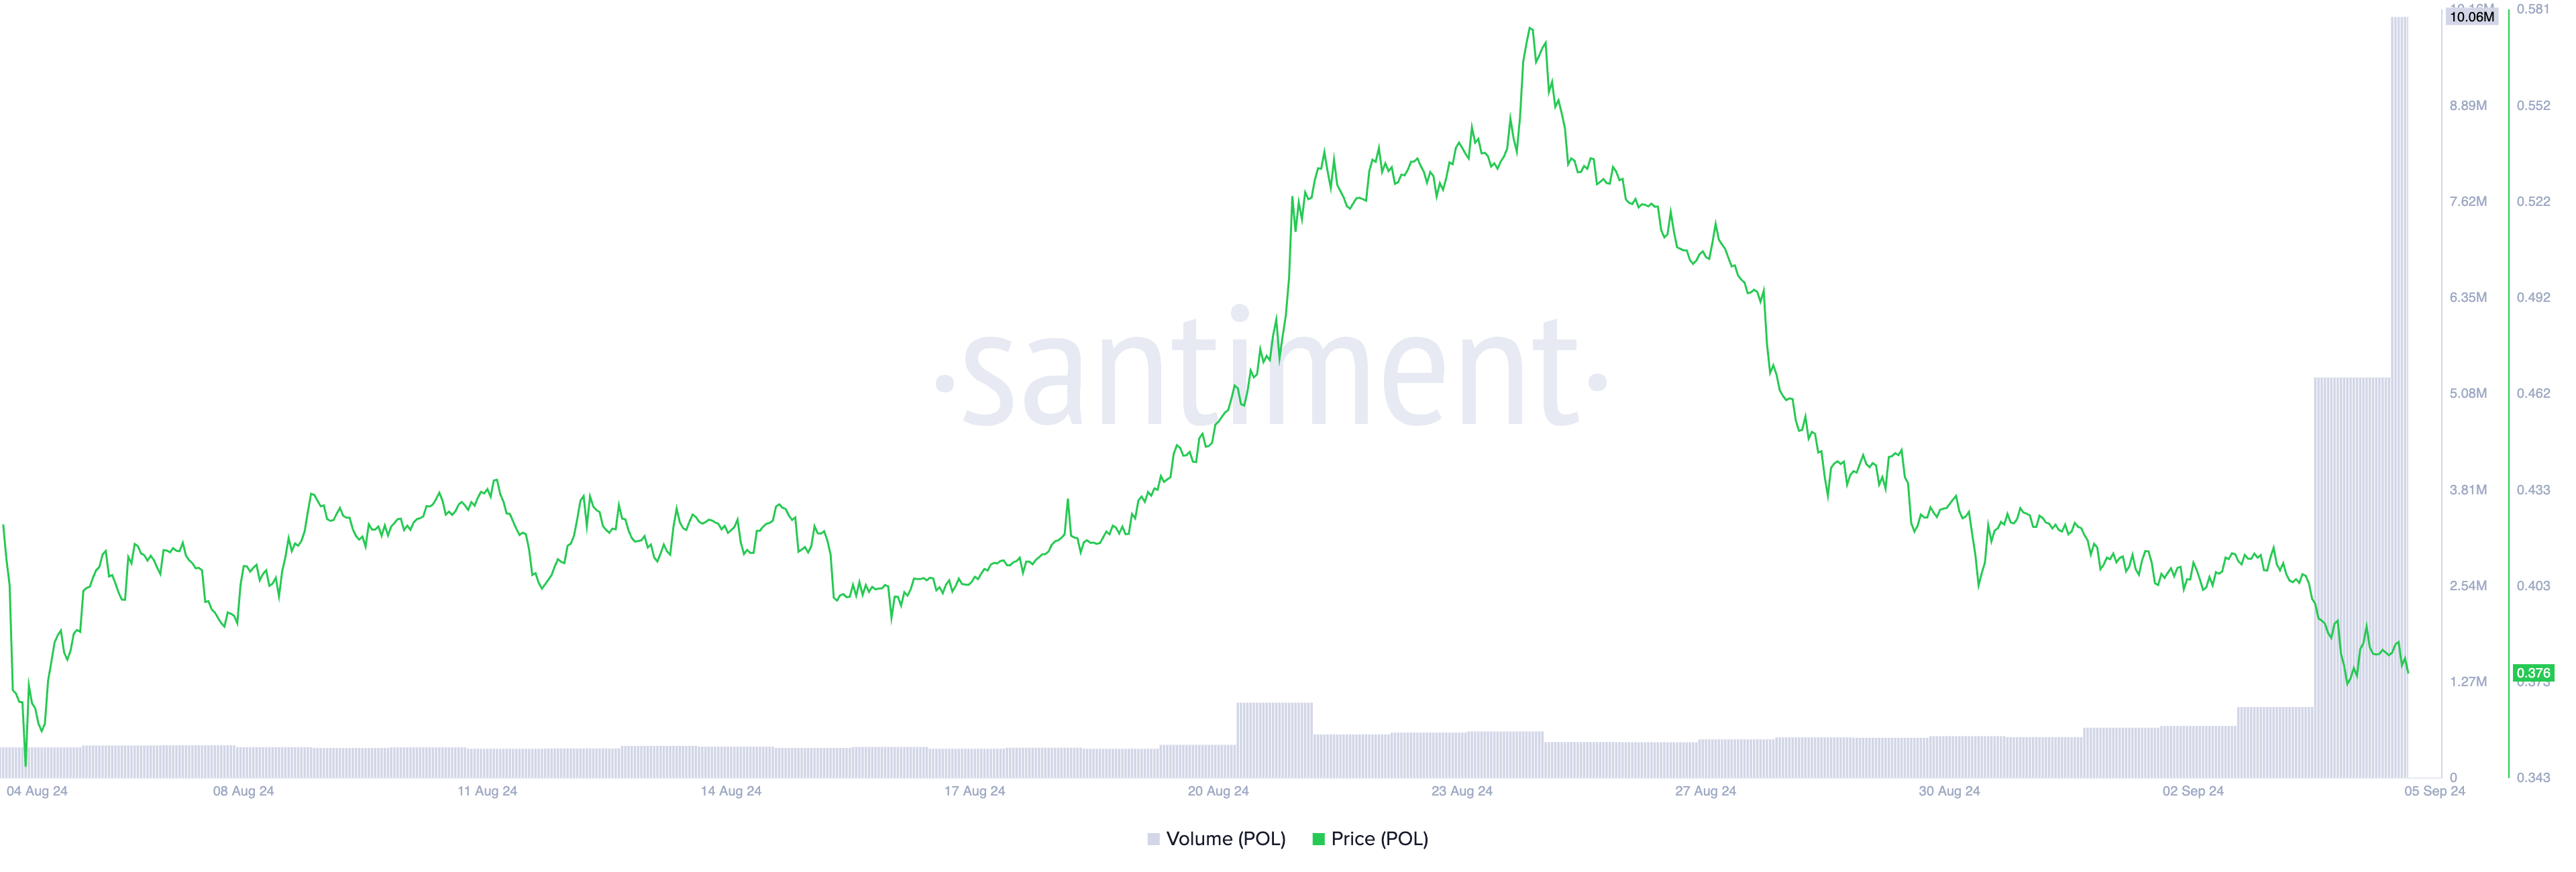
POL trades at $0.37 at press time, witnessing a muted reaction to the token upgrade. Over the past 24 hours, the token’s price has plummeted by 3%. However, its trading volume has skyrocketed by 925% during that period.
Each time an asset’s price drops while its trading volume spikes, there is heightened market activity driven by strong selling pressure. The market may be experiencing a panic-selling phase, where fear and uncertainty dominate due to various factors, such as a network upgrade, as seen in POL’s case, or significant shifts in broader market trends. These factors can intensify selling pressure as investors react to perceived risks.
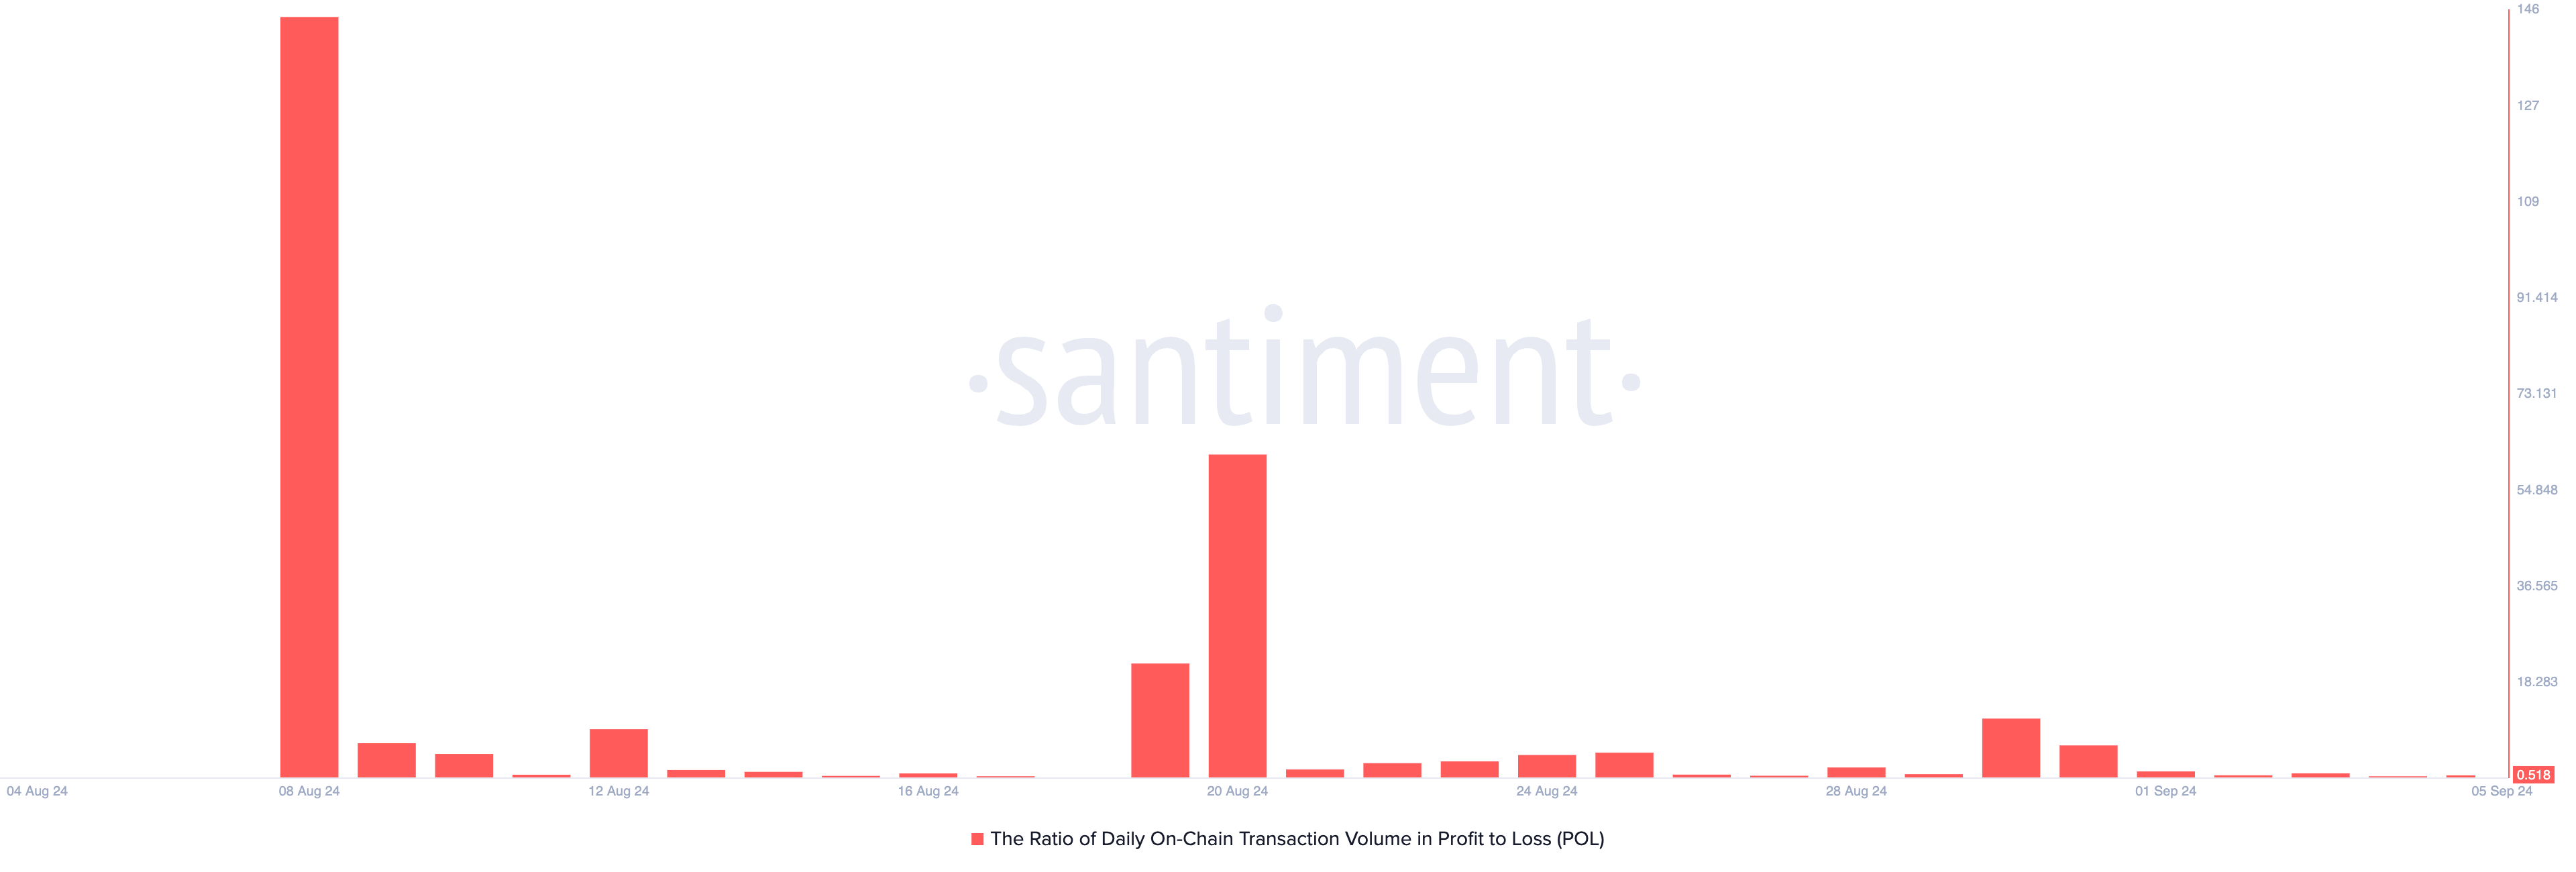
Unfortunately, many POL holders have been forced to sell their tokens at a loss. BeInCrypto’s analysis of the token’s ratio of daily transaction volume in profit to loss reveals that Thursday has seen more transactions ending in a loss than those yielding a profit.
As of this writing, this ratio stands at 0.51, indicating that for every POL transaction that has ended in a loss, only 0.51 transactions have returned a profit.
Read more: 15 Best Polygon (MATIC) Wallets in 2024
POL Price Prediction: More Decline Ahead
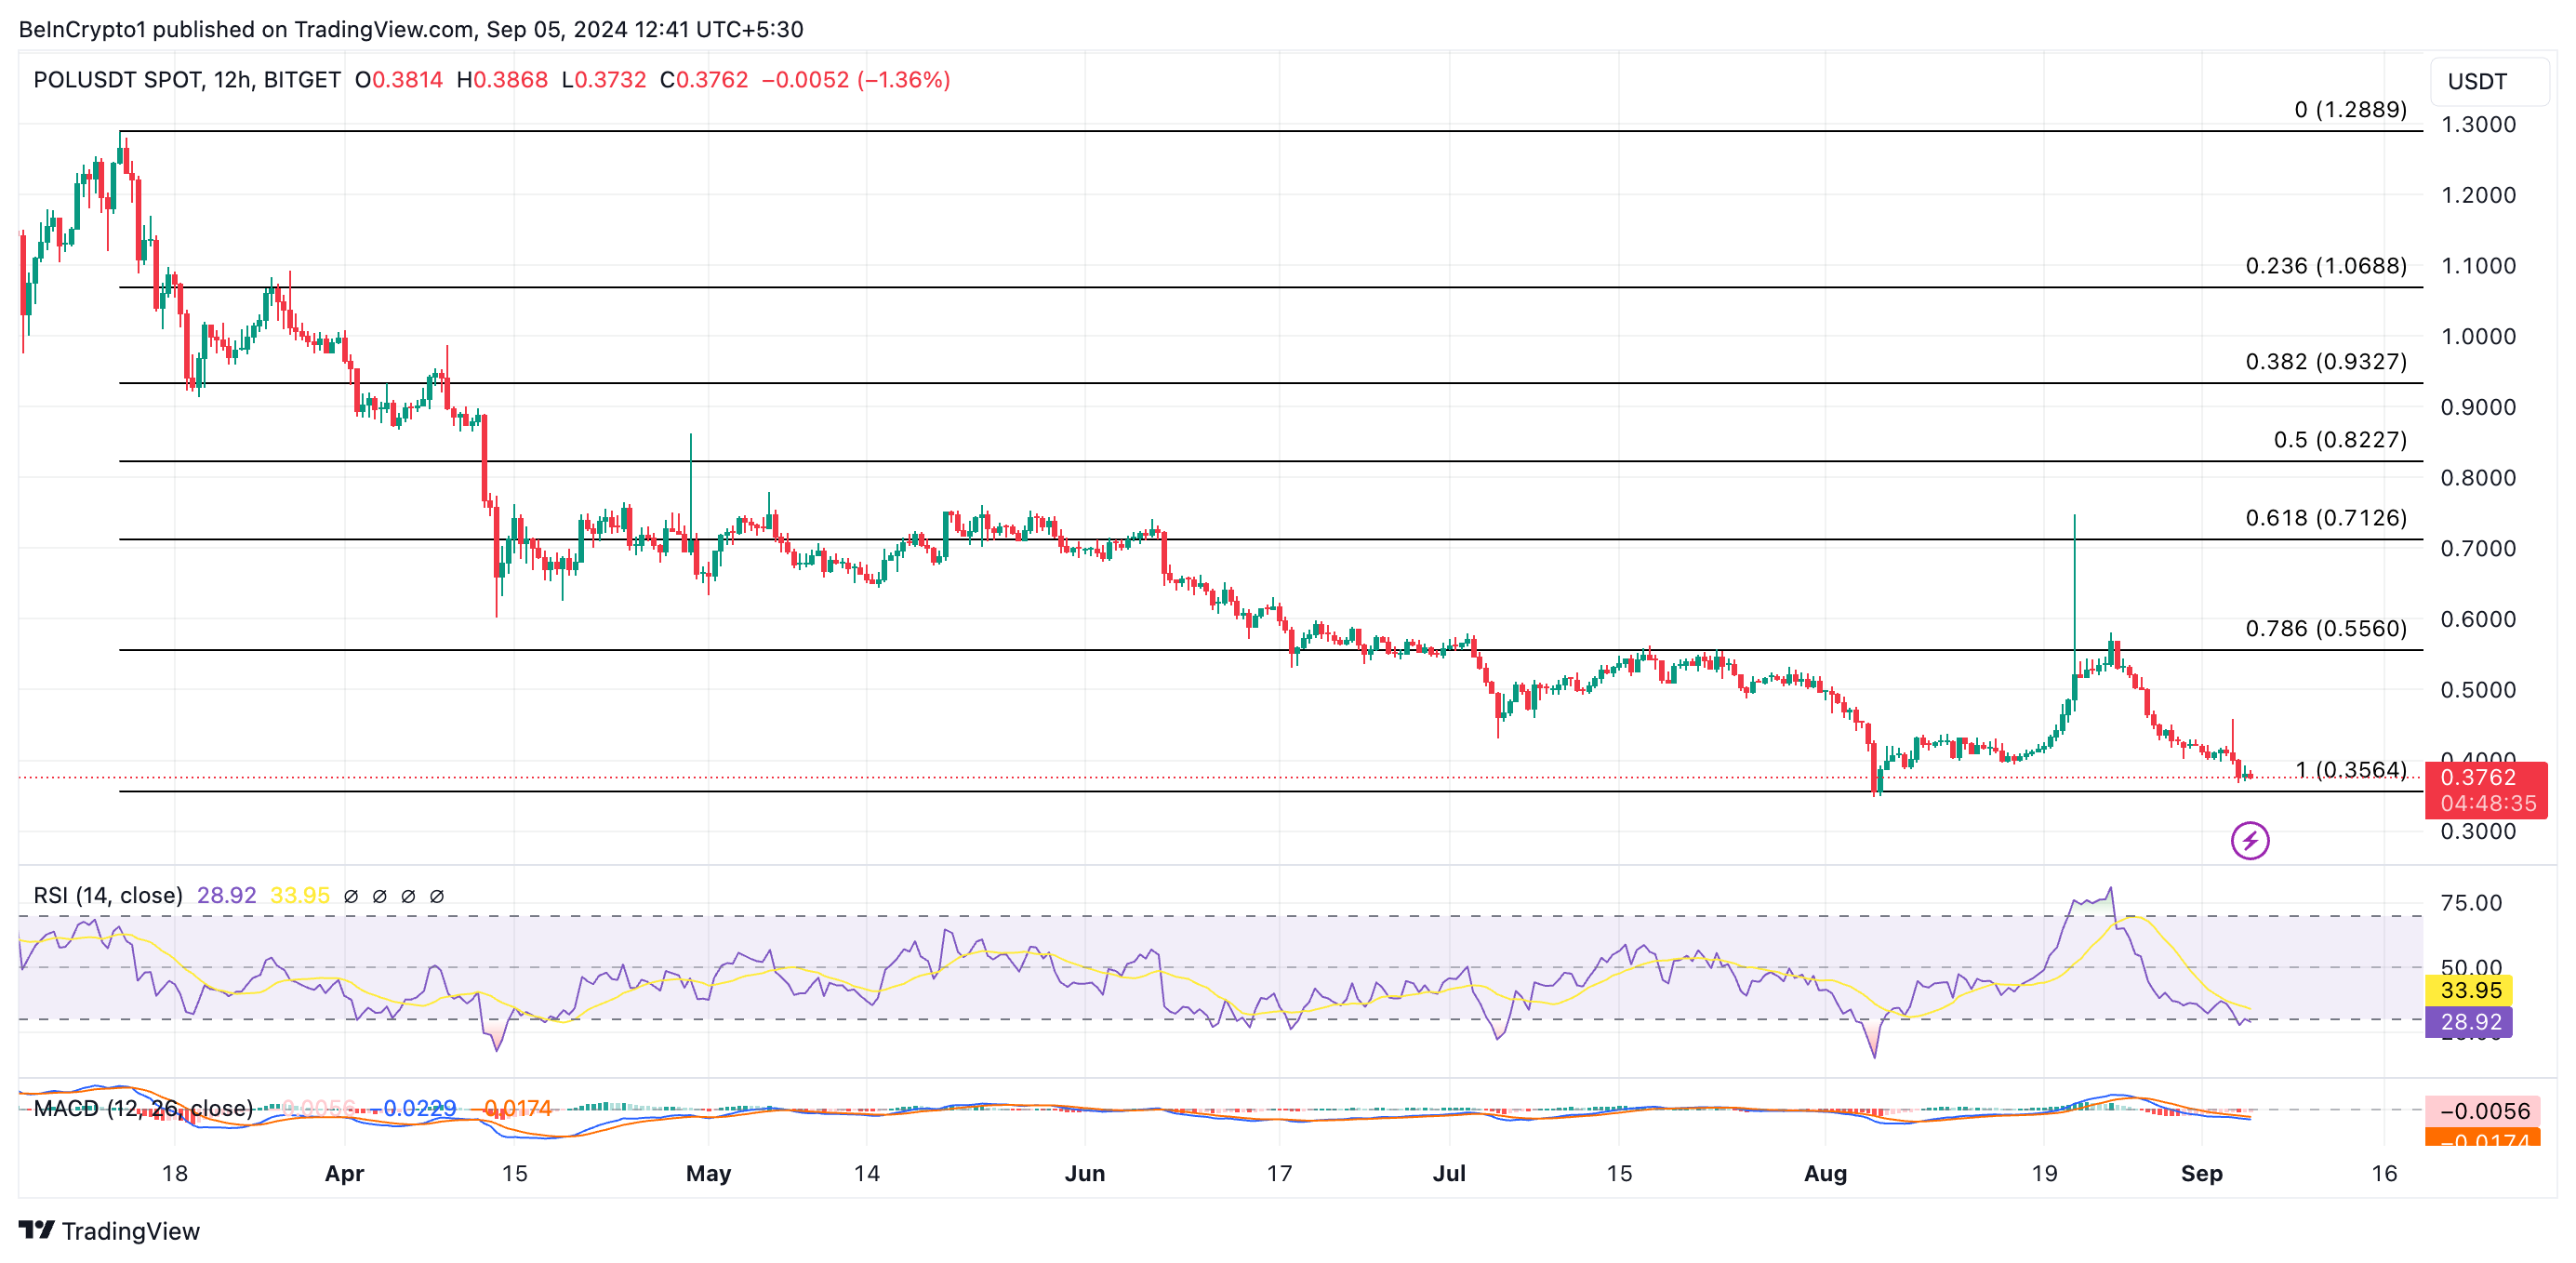
POL’s technical setup on a 12-hour chart suggests that its price may witness a further downturn. For example, readings from its Moving Average Convergence/Divergence (MACD) indicator show its MACD line (blue) resting below its signal (orange) and zero lines.
This indicator identifies an asset’s trend direction, changes, and potential price reversal points. When it’s set up this way, the downtrend is strong. Traders view this as a sign to exit long positions and take short positions.
However, all hope is not lost, as POL’s Relative Strength Index (RSI) suggests that a potential price rebound may be imminent. As of this writing, the indicator’s value is 28.67. An RSI value below 30 indicates an asset is oversold and may be due for a rebound.
Read more: Polygon (MATIC) Price Prediction 2024/2025/2030
For this to happen, POL must witness a resurgence in new demand, which will change the course of the current trend. If the demand for the token spikes, it may drive a price uptick, causing it to exchange hands at $0.55.
However, if POL selloffs intensify, its price will fall further to $0.35, invalidating the bullish thesis above.
