


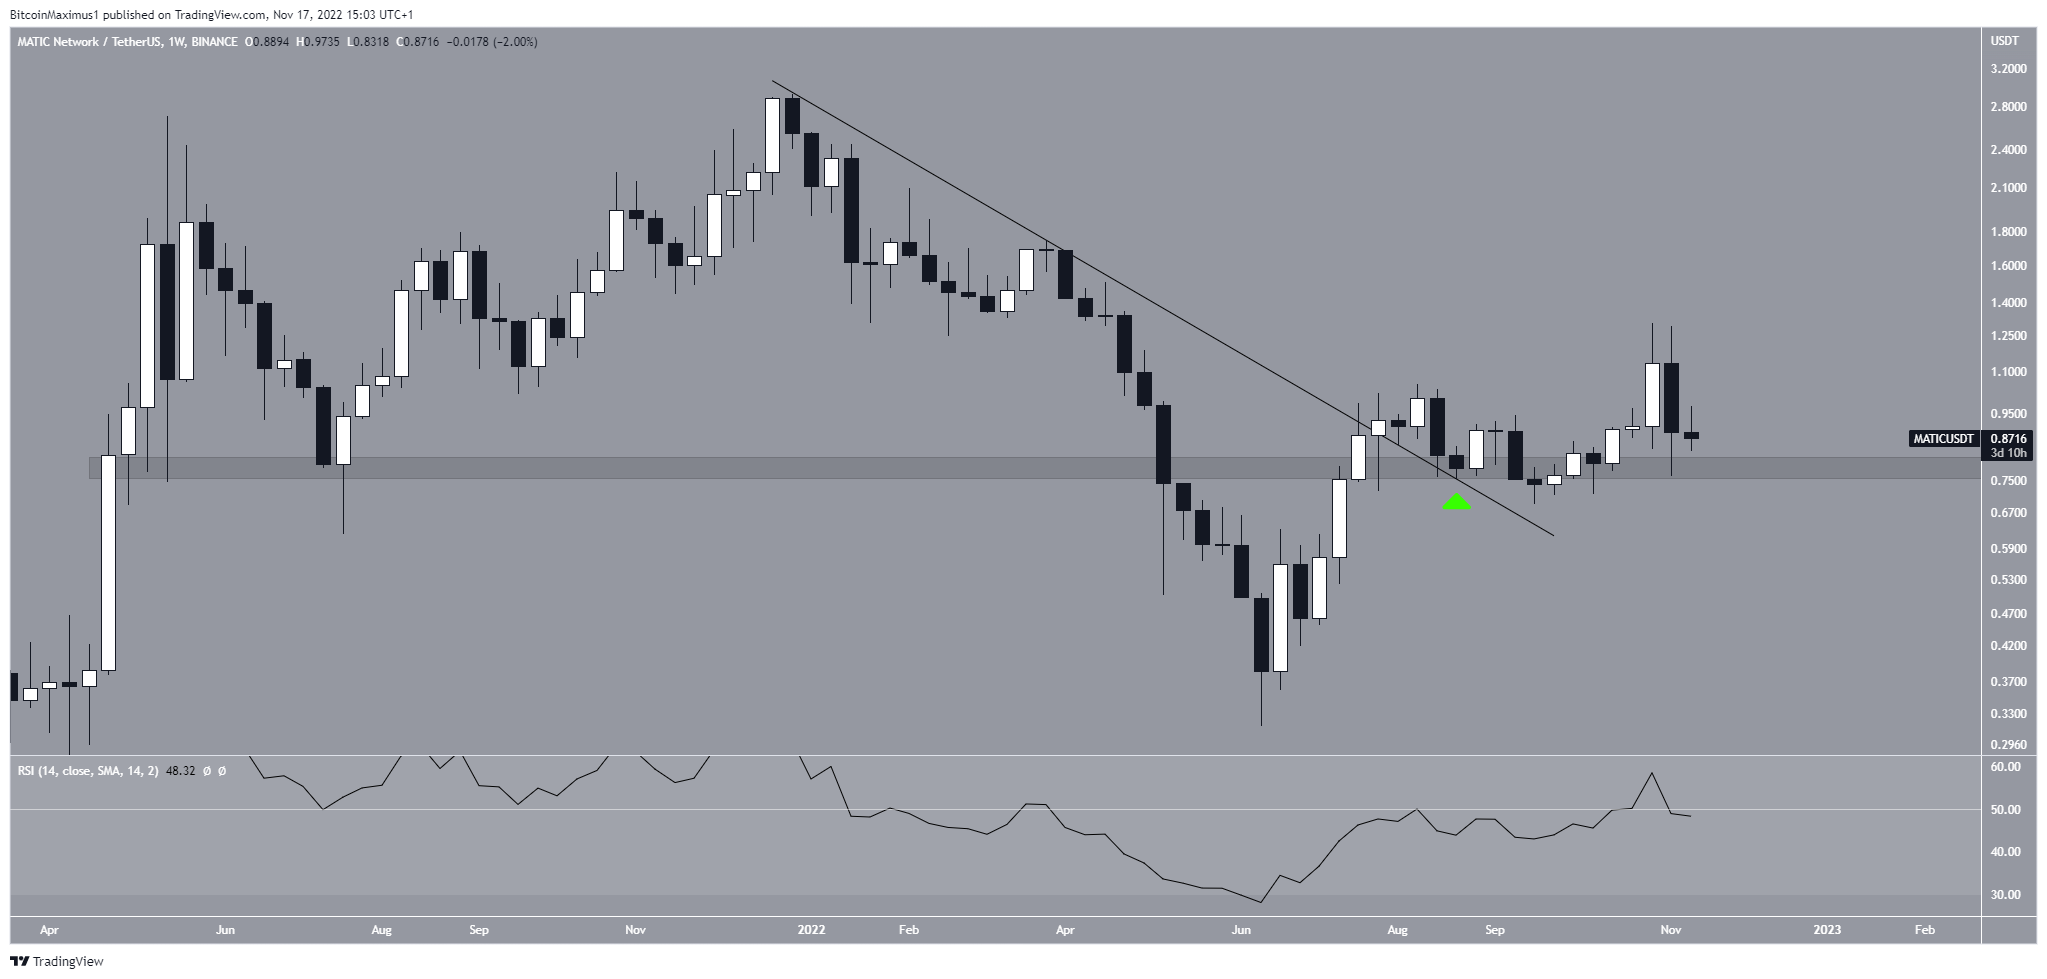
The Polygon (MATIC) price is trading above the long-term $0.80 horizontal support area. However, a lack of conviction from the price action and RSI means the future direction of movement is unclear.
The MATIC price fell below a descending resistance line since reaching an all-time high price of $2.92 in Dec. 2021. The decrease led to a low of $0.31 in June 2022.
Afterward, the Polygon price began an upward movement and broke out from the resistance line in July. Doing so also reclaimed the $0.80 horizontal support area. This is a crucial area since, except for the May to July deviation (red circle), it has been in place since May 2021.
The Polygon price validated the line/area as support in Aug. (green icon) and has been moving upward since. It returned to the $0.80 area once more in Nov. The weekly RSI is undecided, since it is trading right at 50.
So, a breakdown from the $0.80 support area would have numerous bearish implications, since it would also cause an RSI breakdown below 50.
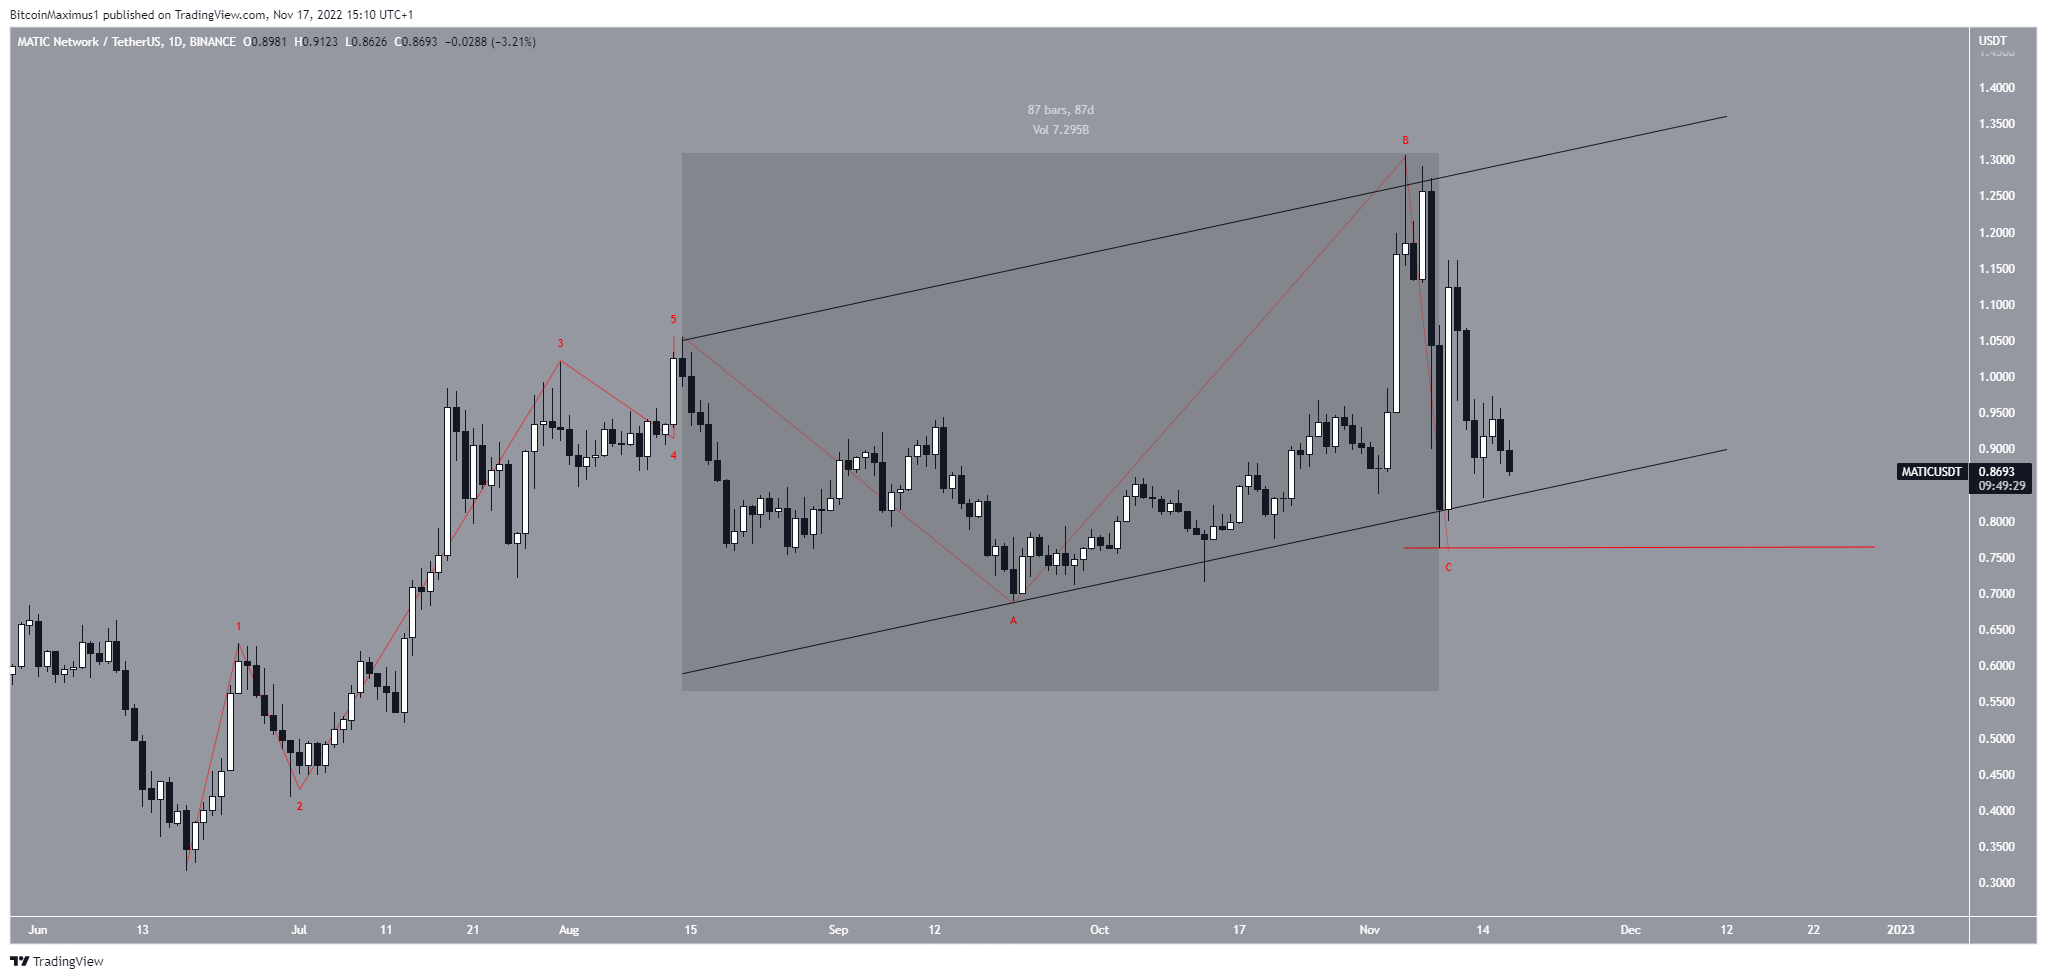
Polygon Price Prediction: Bullish and Bearish Counts in Play
Two potential counts are still valid.
The bullish count suggests that the Polygon price began a bullish reversal on June 18. Afterward, it completed an irregular flat correction between Aug. 14 and Nov. 9 (highlighted).
If so, the MATIC token price will continue increasing toward new highs. The count is still valid despite a slight decrease over the past 24 hours. However, a drop below $0.76 would invalidate it (red line).
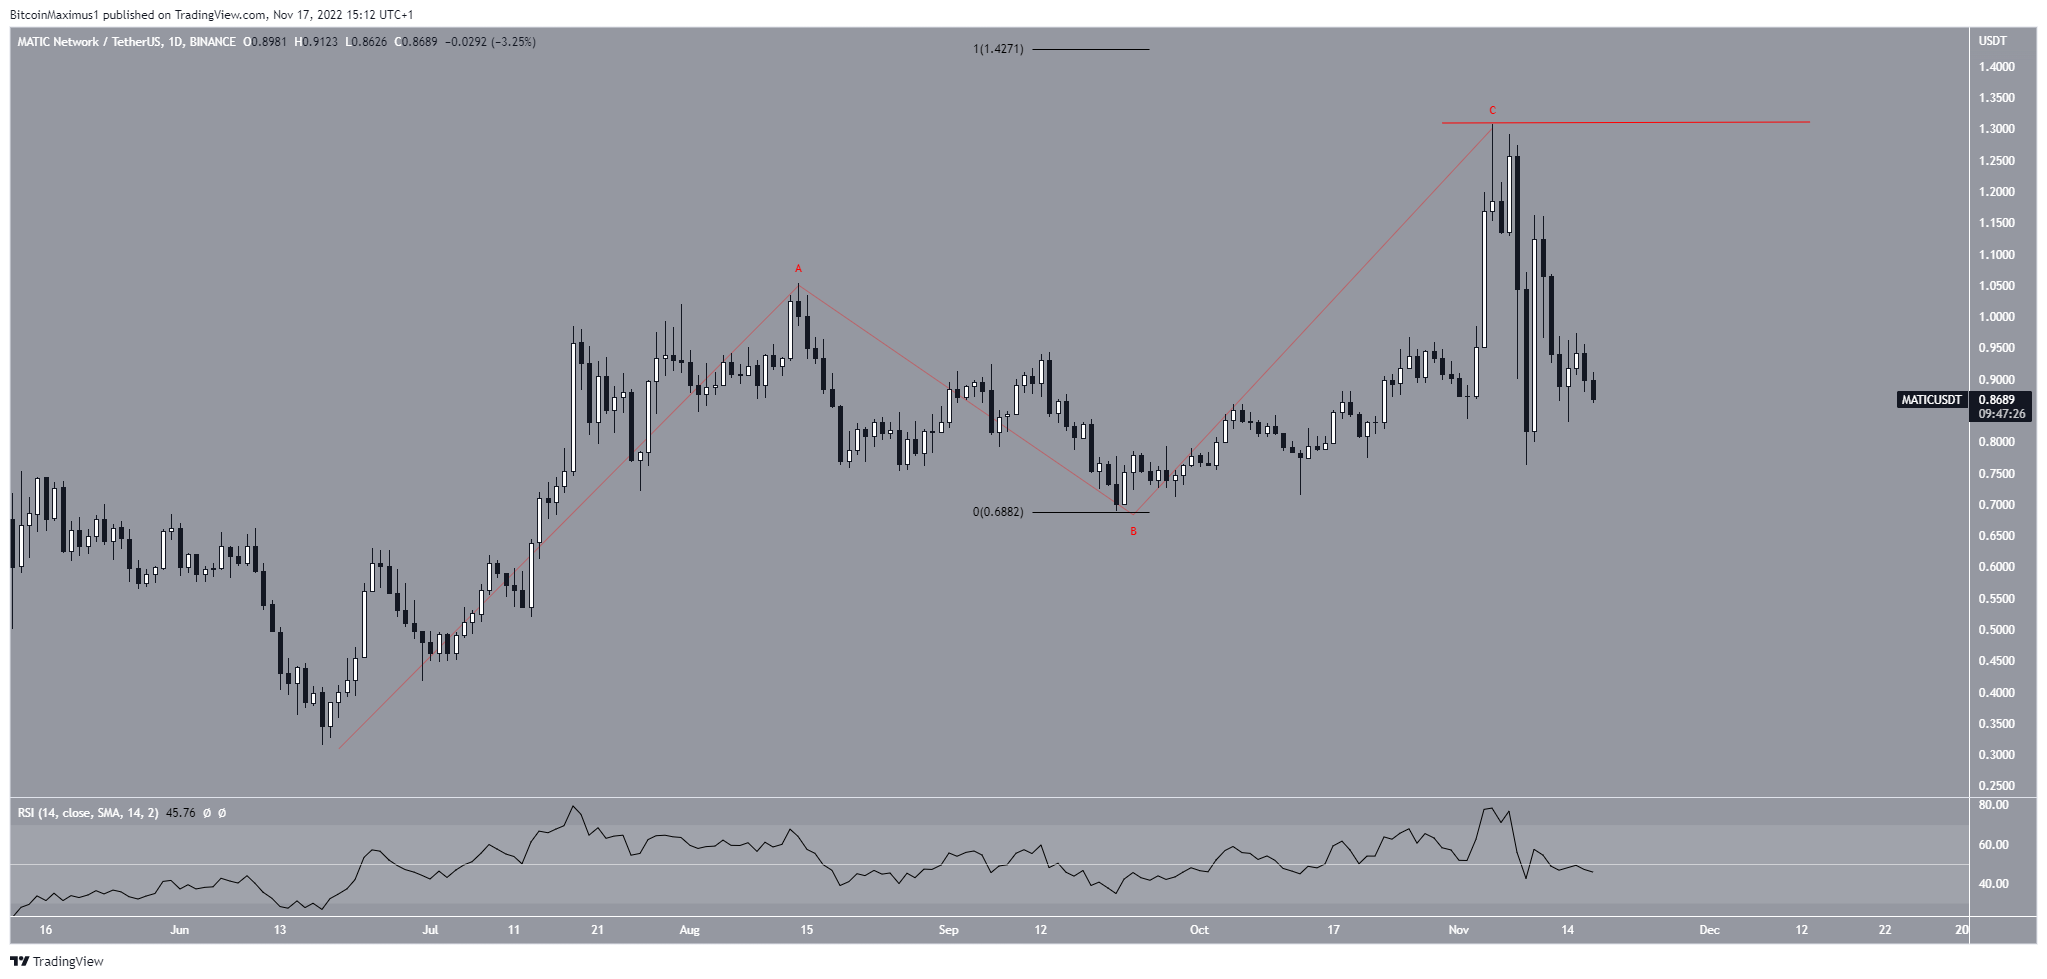
The bearish count suggests that MATIC has completed an A-B-C corrective structure. In it, waves A:C had a slightly less than 1:1 ratio. If correct, it would mean the price will fall to a new yearly low. The count would be invalidated with an increase above the wave C high at $1.30 (red line).
Similar to the weekly time frame, the RSI is at the 50 line, indicating an undetermined trend. As a result, the direction of the future movement still needs to be determined.
For BeInCrypto’s latest Bitcoin (BTC) analysis, click here.
Disclaimer: BeInCrypto strives to provide accurate and up-to-date information, but it will not be responsible for any missing facts or inaccurate information. You comply and understand that you should use any of this information at your own risk. Cryptocurrencies are highly volatile financial assets, so research and make your own financial decisions.
