
The price of MATIC, the token that powers the leading Layer 2 (L2) platform Polygon, has declined significantly since it climbed to its year-to-date high of $1.22 on March 14.
After consolidating within a range between April 14 and June 7, it broke below the lower line (support level) of the horizontal channel and has since declined by 33%.
Polygon Trades at a 24-month Low
At press time, the L2 token trades at $0.44. The last time the altcoin traded at this price level was in July 2022.
An on-chain assessment of MATIC’s price performance reveals a significant decline in the demand for altcoin among market participants. This is partly based on readings from the token’s Price-Daily Active Address (DAA) Divergence.
This metric compares an asset’s price movements with the changes in its number of daily active addresses. It tracks whether an asset’s price movement is supported by corresponding activity on its network.
As of this writing, MATIC’s Price-DAA Divergence returns a negative value of -35.59%. For context, this metric last exceeded zero on October 24, 2023.
Read More: How To Buy Polygon (MATIC) and Everything You Need To Know

When this metric returns a value below zero, it suggests that fewer daily active addresses trading an asset. A value of -35.59% marks a significant decline in active address count, a bearish signal for any asset.
A combined reading of MATIC’s price decline and its negative Price DAA Divergence suggests that both the token’s price and network activity on Polygon are decreasing.
Further, MATIC’s Relative Strength Index (RSI) is 21.17, lending credence to the above position. This indicator measures an asset’s overbought and oversold market conditions. It ranges between 0 and 100, with values above 70 signaling that the asset is overbought and due a correction, while values below 30 suggest that the asset is oversold and may be poised for a rebound.
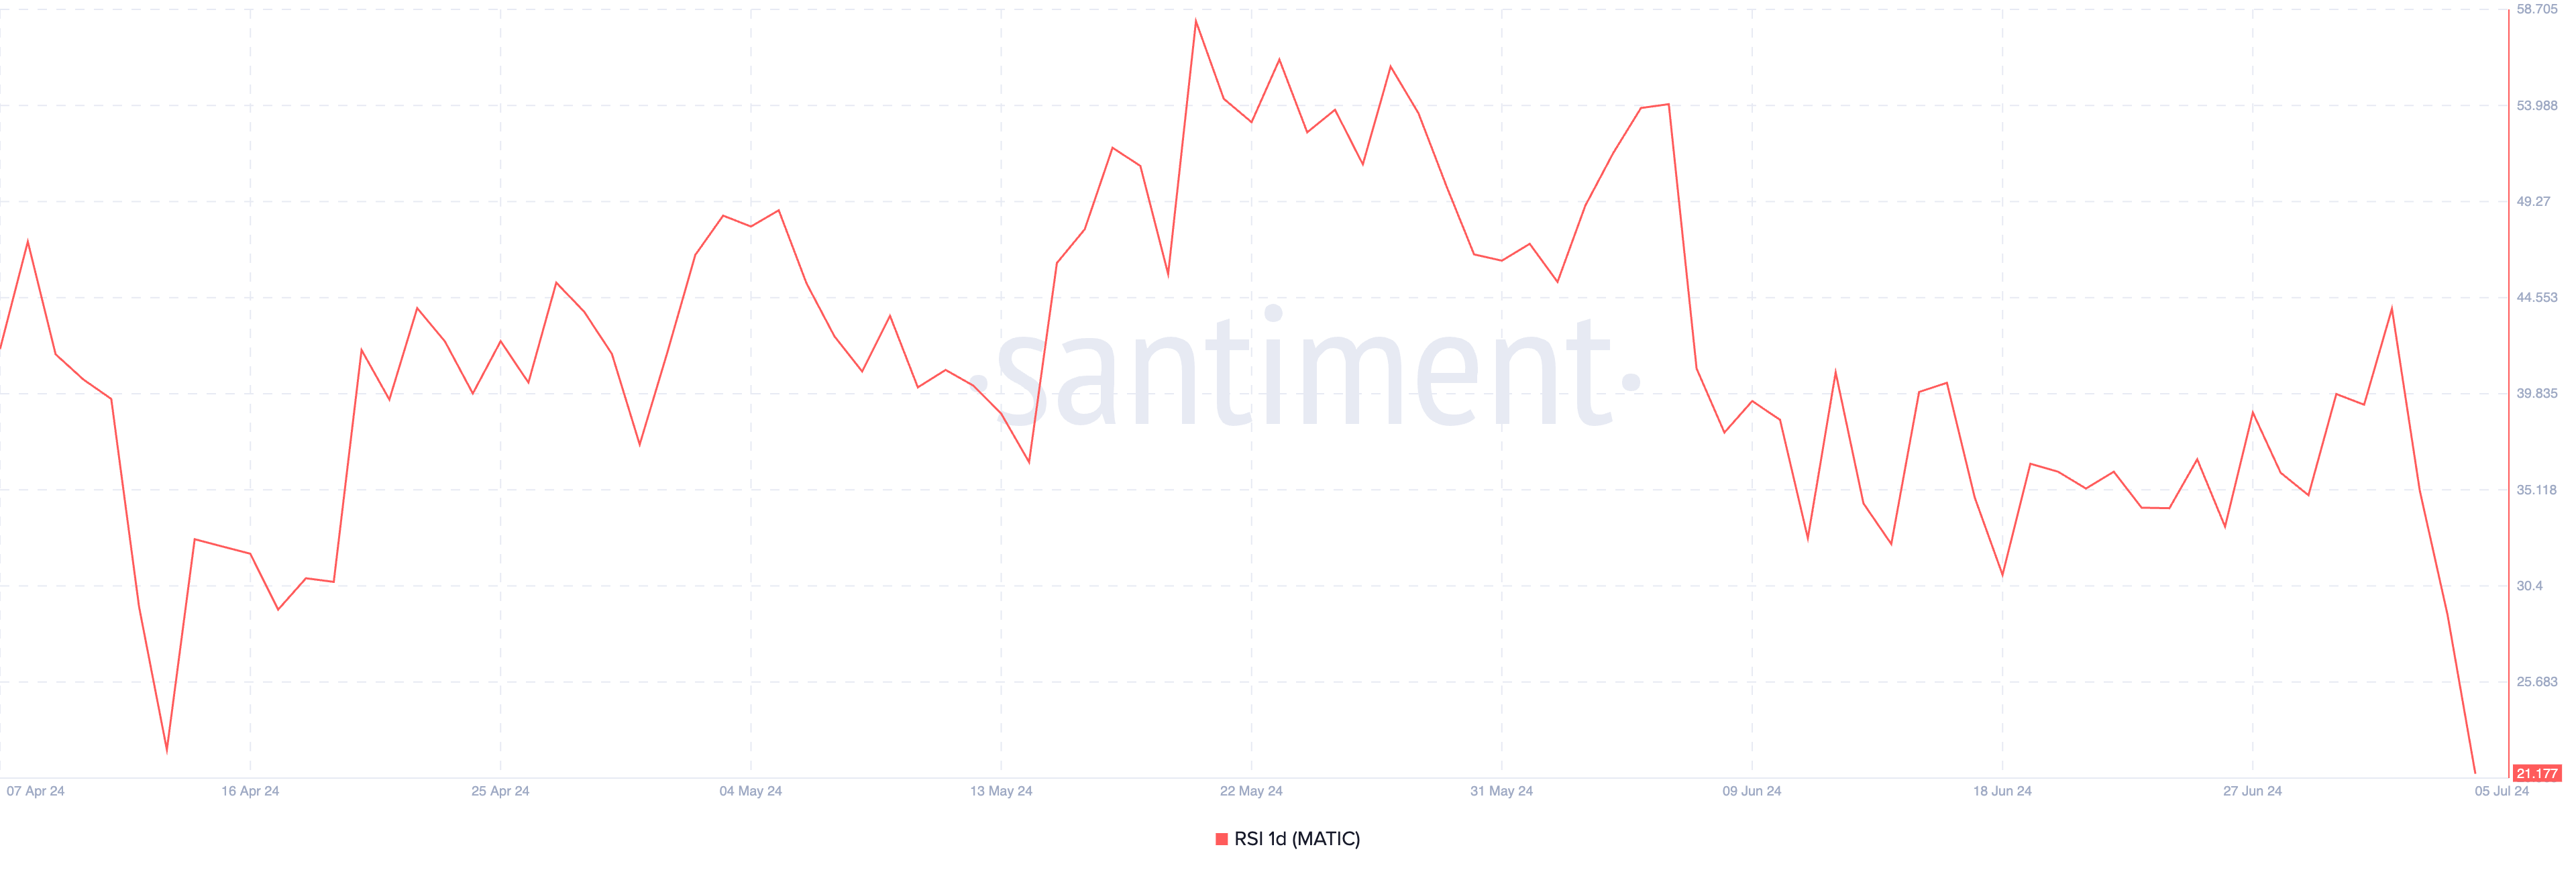
While MATIC’s RSI suggests that it may be primed for a price uptick, the significant bearish bias that currently trails it might prevent this from happening.
MATIC Price Prediction: The Decline to Multi-Year Lows Might Continue
MATIC’s price decline may continue as bearish bias towards the altcoin continues to gain momentum. According to its Elder-Ray Index, the indicator’s value has been negative since the decline began on June 7.
This indicator measures the relationship between the strength of buyers and sellers in the market. When its value is negative, bear power dominates the market.
As of this writing, the value of MATIC’s Elder-Ray Index is -0.15.
Read More: Polygon (MATIC) Price Prediction 2024/2025/2030
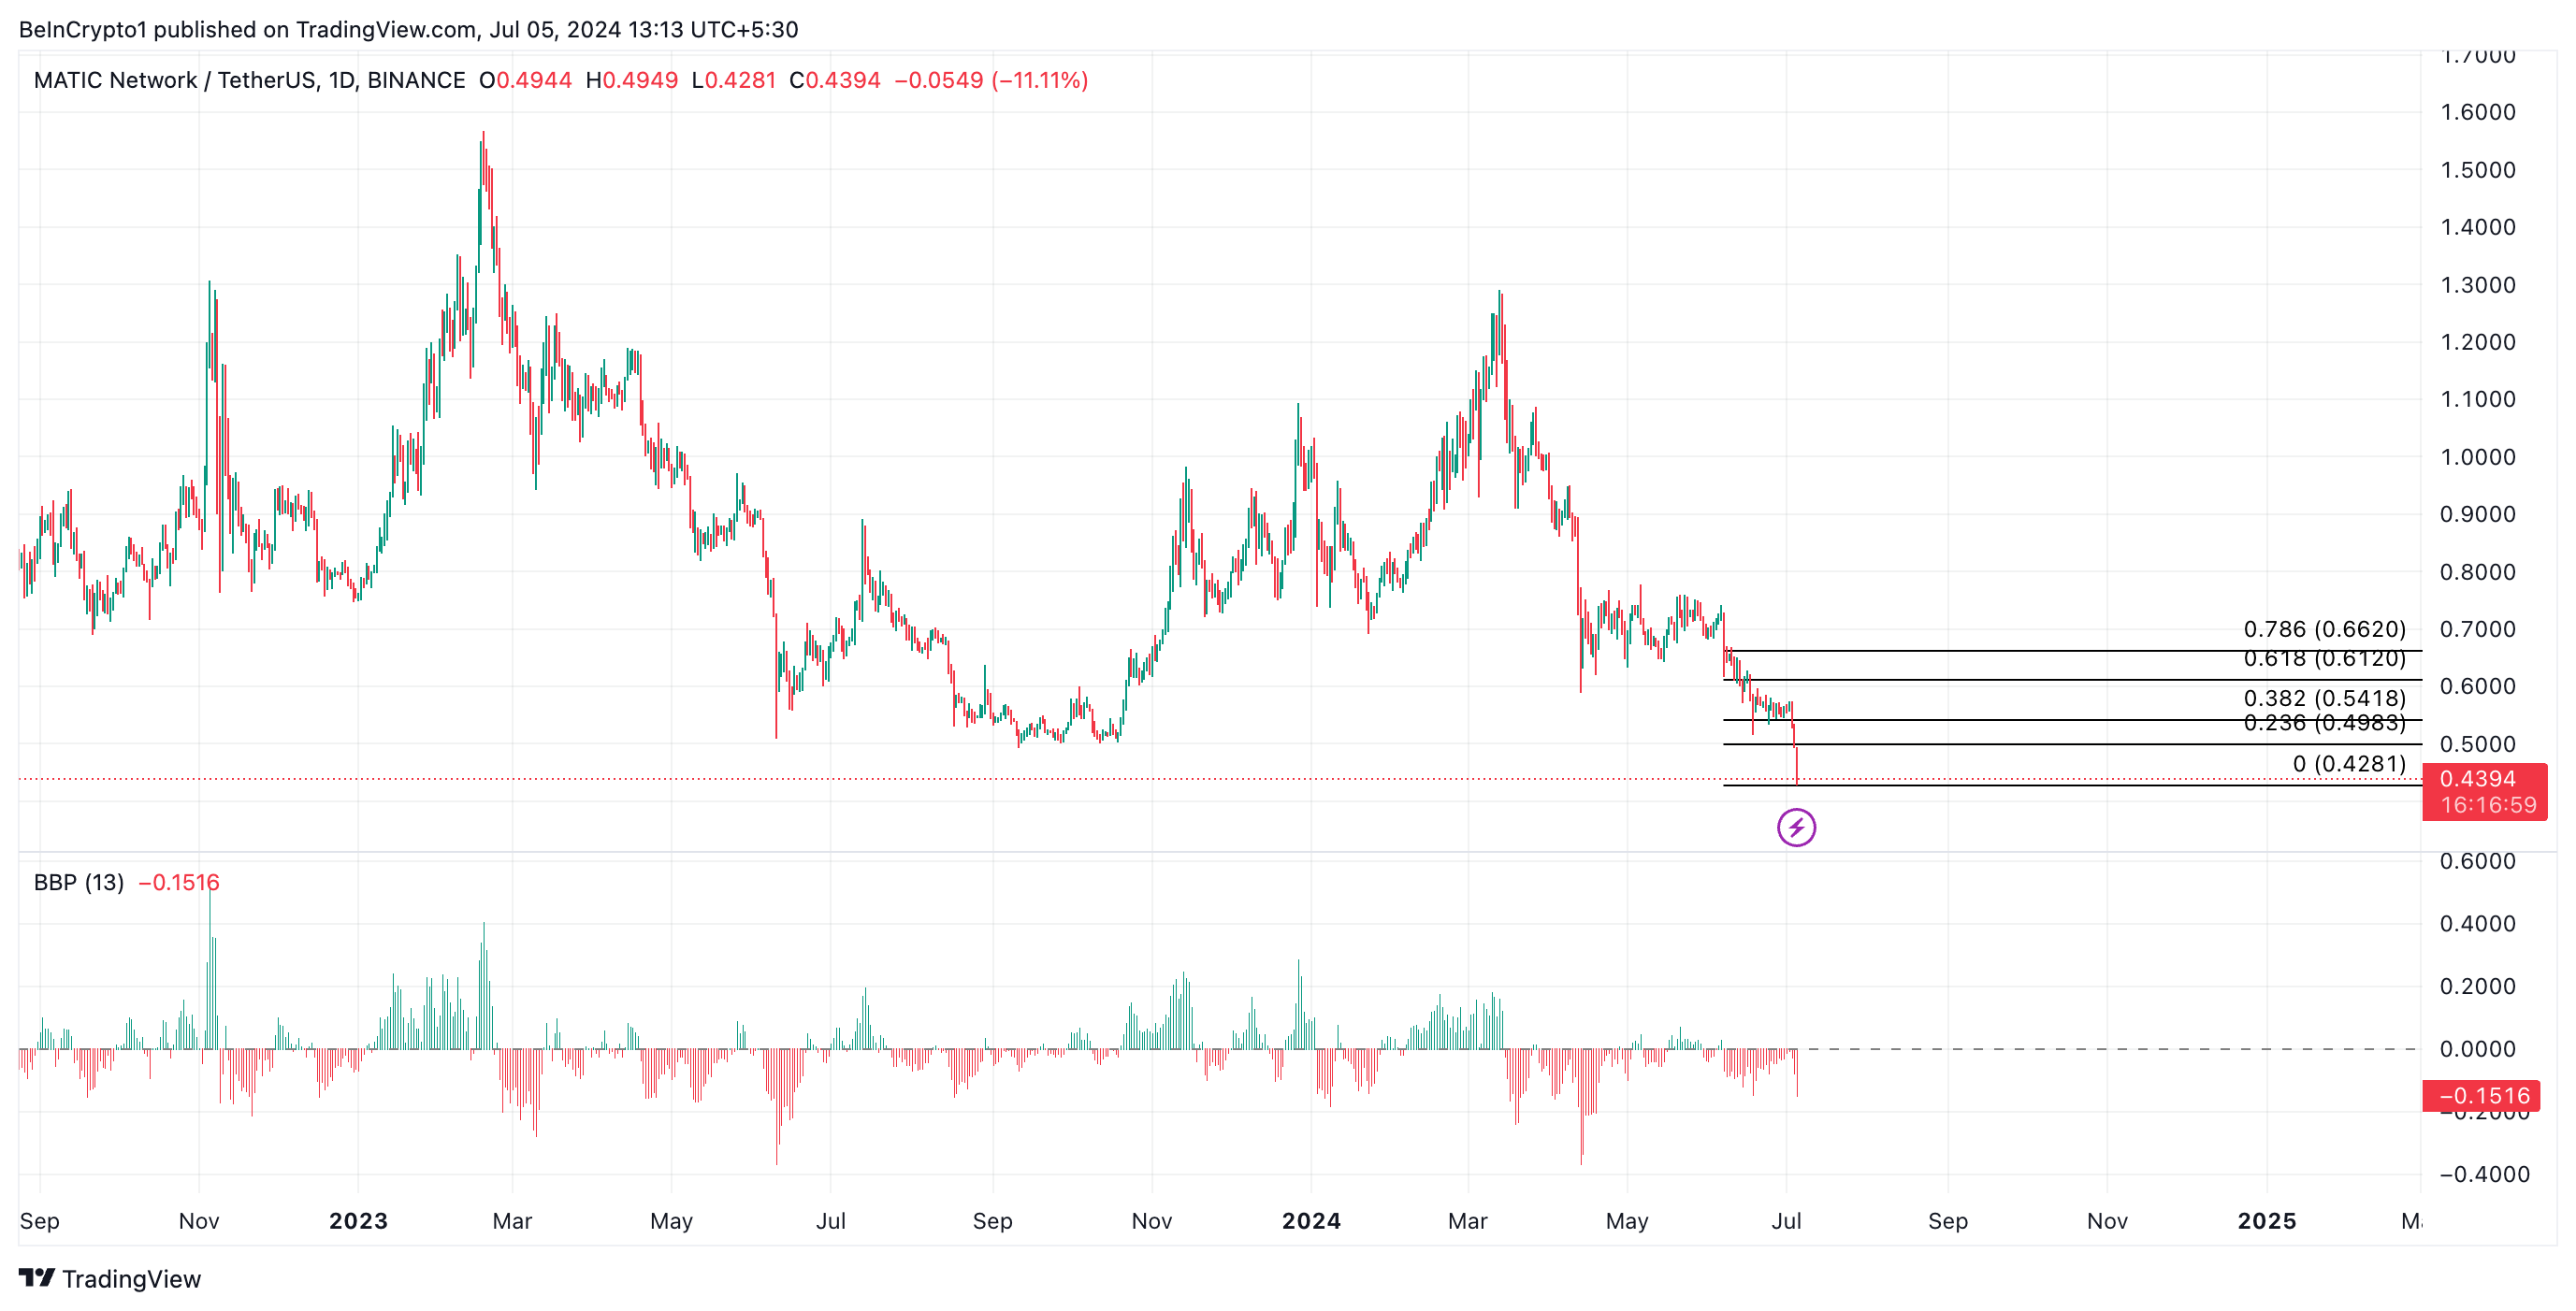
If the bears remain in market control, they will force the token’s price to trend lower. It may fall as low as $0.42.
However, if traders take advantage of the dip and buying pressure spikes, MATIC’s price might rally toward $0.49.
