
The Polygon (MATIC) price shows signs of weakness after increasing for the entirety of Jan. A correction could follow.
This week brought positive Polygon news regarding both the MATIC price and the activity on the network. The daily active users on Polygon have finally surpassed those of Ethereum. The Polygon network now has 340,000 users, slightly more than Ethereum blockchain at 320,000. The metric has increased by 21% in only two weeks.
Next, the MATIC price moved into the top 10 crypto assets ranked by their market capitalization, surpassing Solana (SOL).
Polygon Grinds Toward Long-Term Resistance
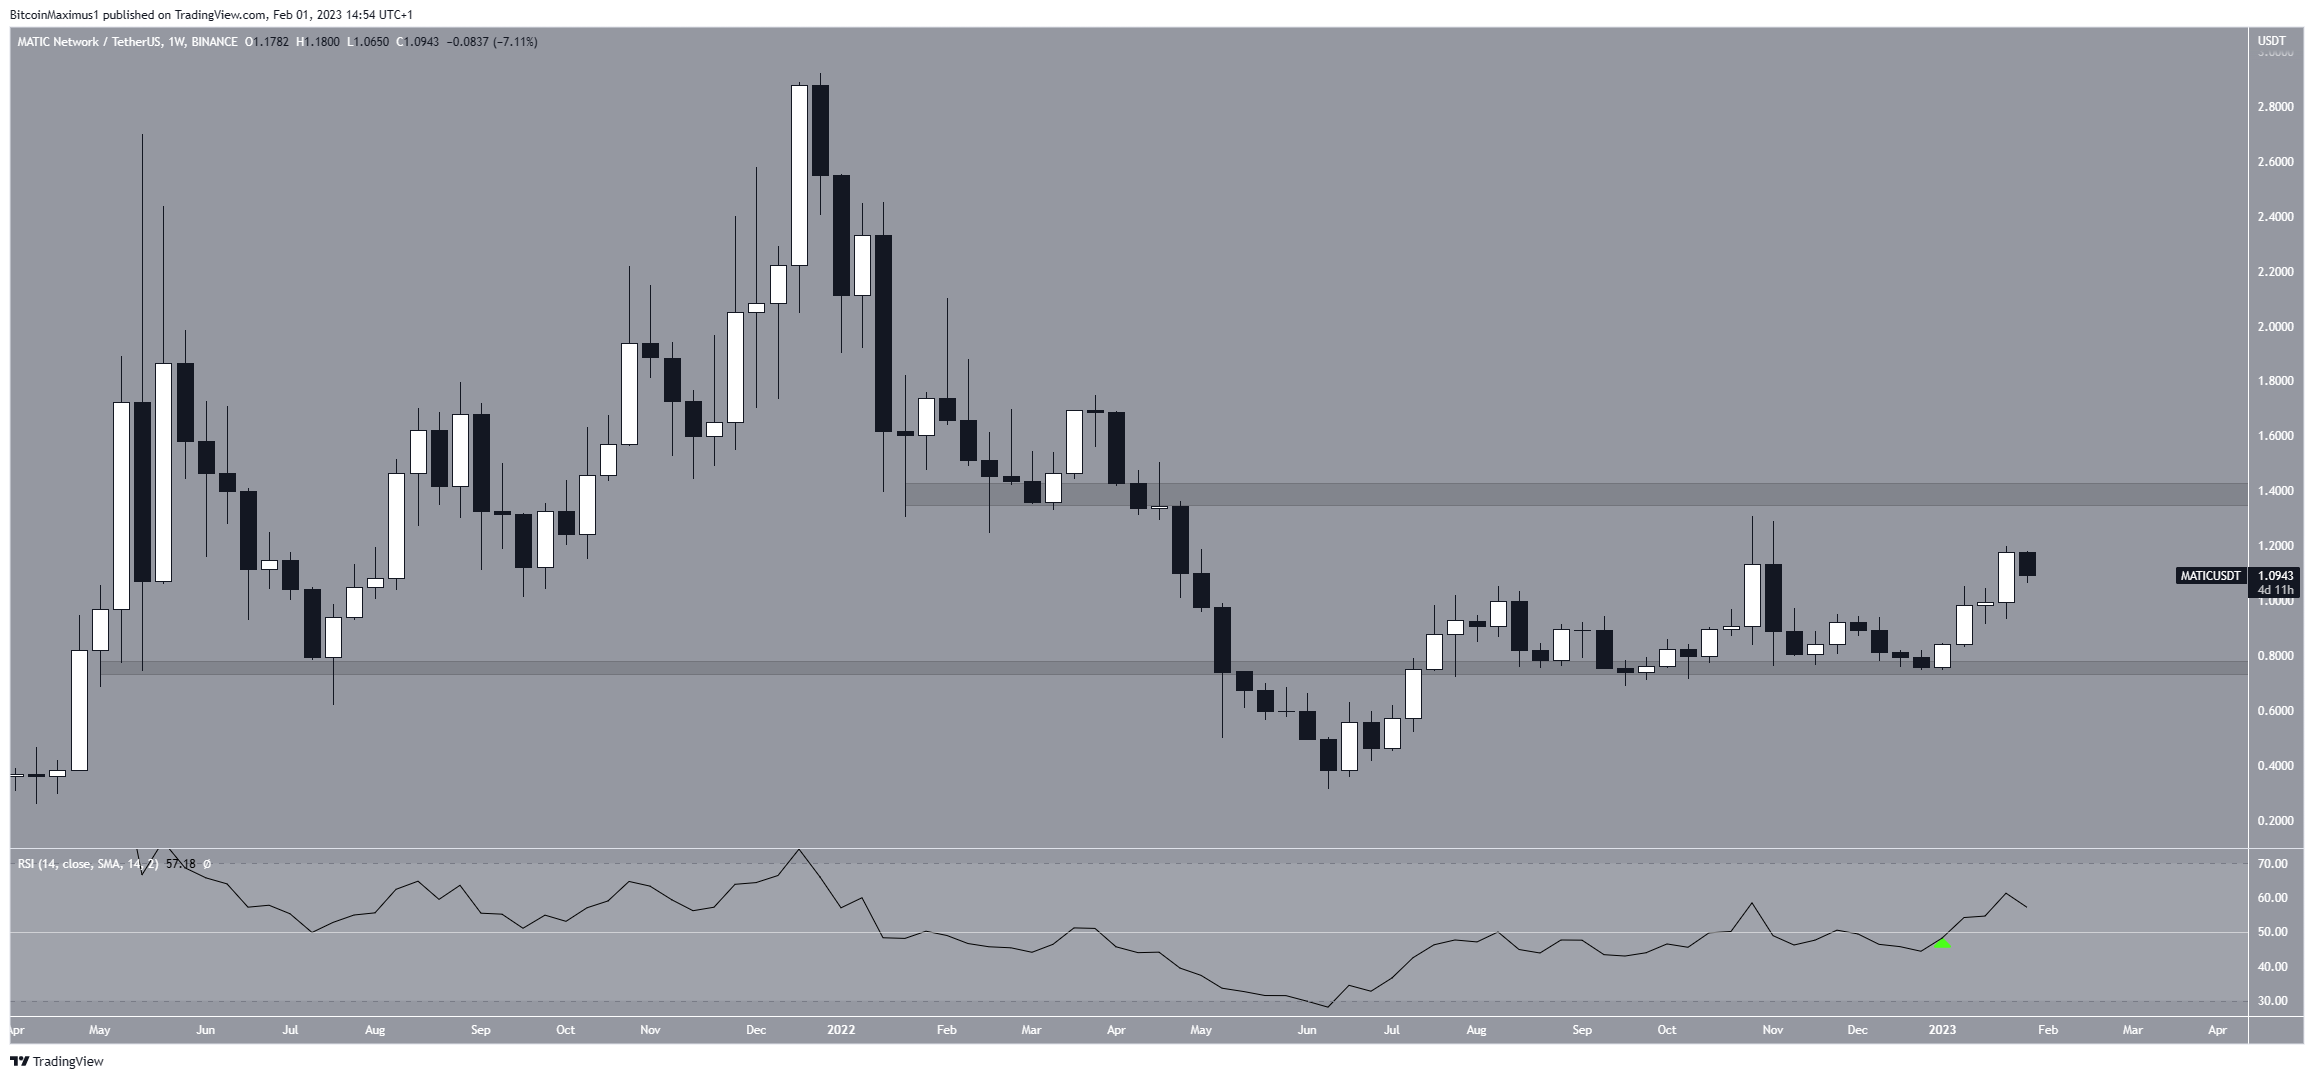
The MATIC price reclaimed the $0.77 horizontal resistance area in Sept. 2022. This was a crucial development since except for a deviation in June, the area has been in place for nearly two years.
Afterward, the MATIC token price bounced twice above it (green icons), resulting in higher lows. Since the second bounce in December, the price of Polygon has increased sharply.
Weekly time frame readings of the RSI give a positive outlook. The indicator rose above 50 (green icon) and has validated the line as support. This is considered a strong sign of a bearish trend.
Therefore, indicator readings paired with the price action encourage the rise toward the next resistance region at $1.38. A weekly closure below $0.77 would invalidate this optimistic price analysis. If this occurs, it could send the price down to $0.40.
MATIC Price Runs out of Steam
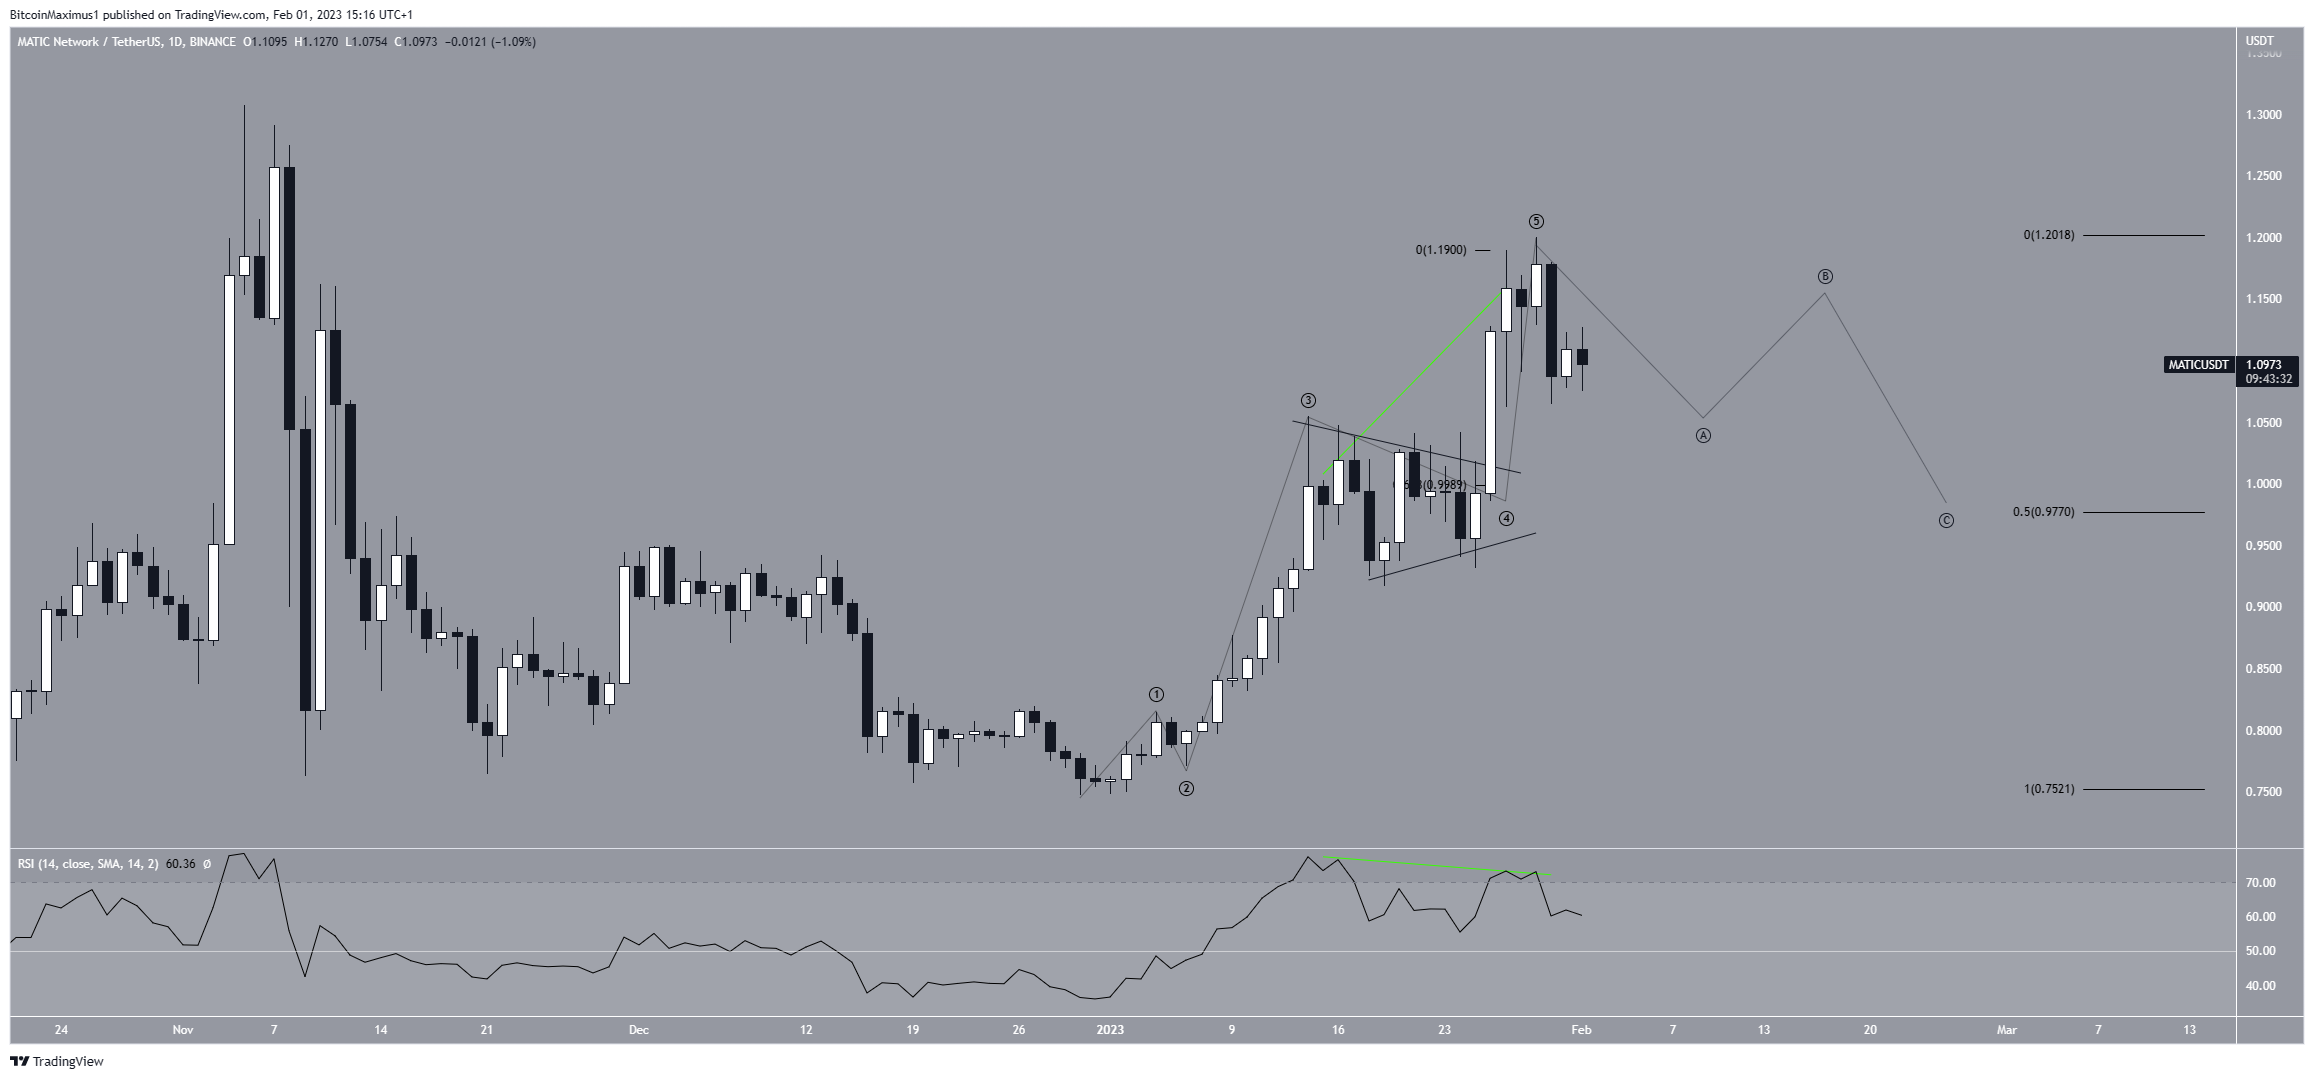
A closer look at the daily time frame shows that the Polygon price completed a five-wave upward movement (black), in which wave four took the shape of a symmetrical triangle. Wave four had 0.618 times the length of waves one and three combined, which is common in such structures.
Moreover, the daily RSI has generated bearish divergence (green line), further solidifying the possibility that a downward movement will follow. Finally, the price created a bearish engulfing candlestick on Jan. 30 and has not bounced in the 24 hours since then.
So, the MATIC price could correct toward the 0.5 Fib retracement support level at $0.98. Since this is also the region of wave four, the correction will likely end there.
On the other hand, a movement above the Jan. 29 high of $1.20 would likely take the MATIC price to the long-term resistance at $1.38.
For BeInCrypto’s latest crypto market analysis, click here.
