


Polygon (MATIC) is trading inside a short-term bearish pattern. The Polygon price is expected to break down from it and re-test the $0.74 horizontal support area.
MATIC is the native token of the Polygon network, which improves the scalability and infrastructure of the Ethereum blockchain. MATIC uses the proof-of-stake consensus mechanism and mainly deals with smart contract functionality and decentralized applications. It can be considered a Layer 2 scaling solution.
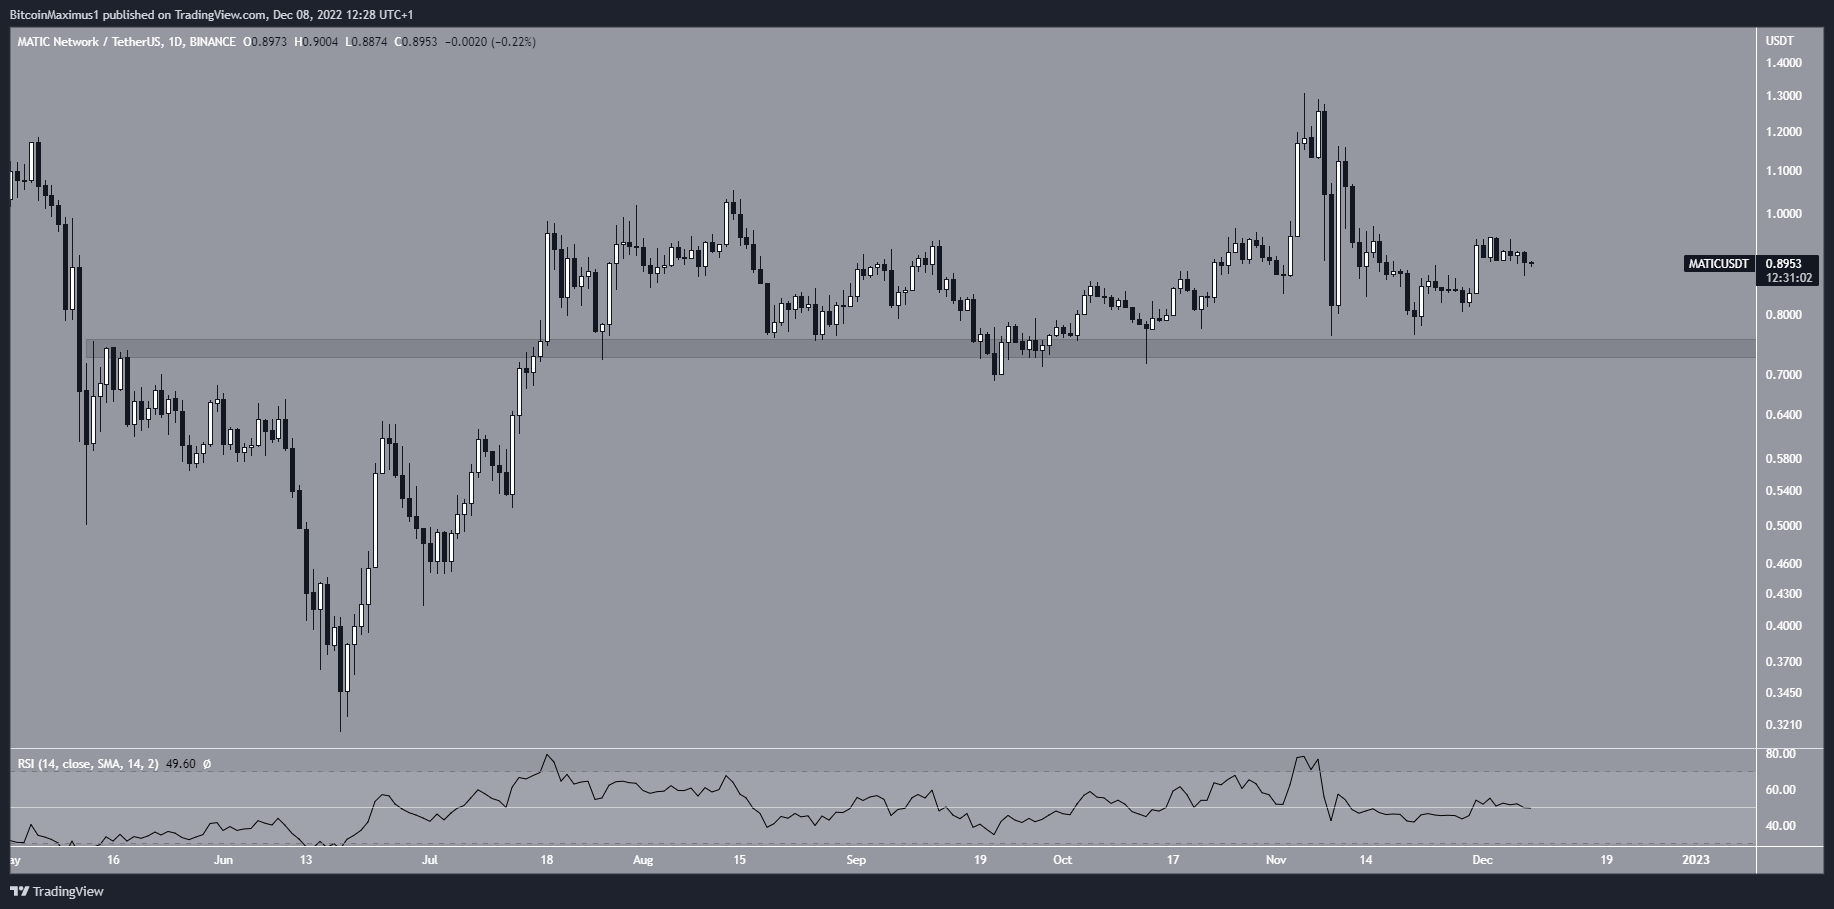
The Polygon price has fallen since reaching a high of $1.30 on Nov. 5. After a sharp fall, the MATIC price created a bullish engulfing candlestick (green icon) on Nov. 10. However, it fell and negated the gains shortly afterward.
Technical indicators do not provide a clear direction for the trend. The daily RSI is right at the 50 line a sign of a neutral trend.
As a result, the technical analysis from the daily time frame provides a neutral Polygon price forecast.
Polygon Price Could Break Down From Bearish Pattern
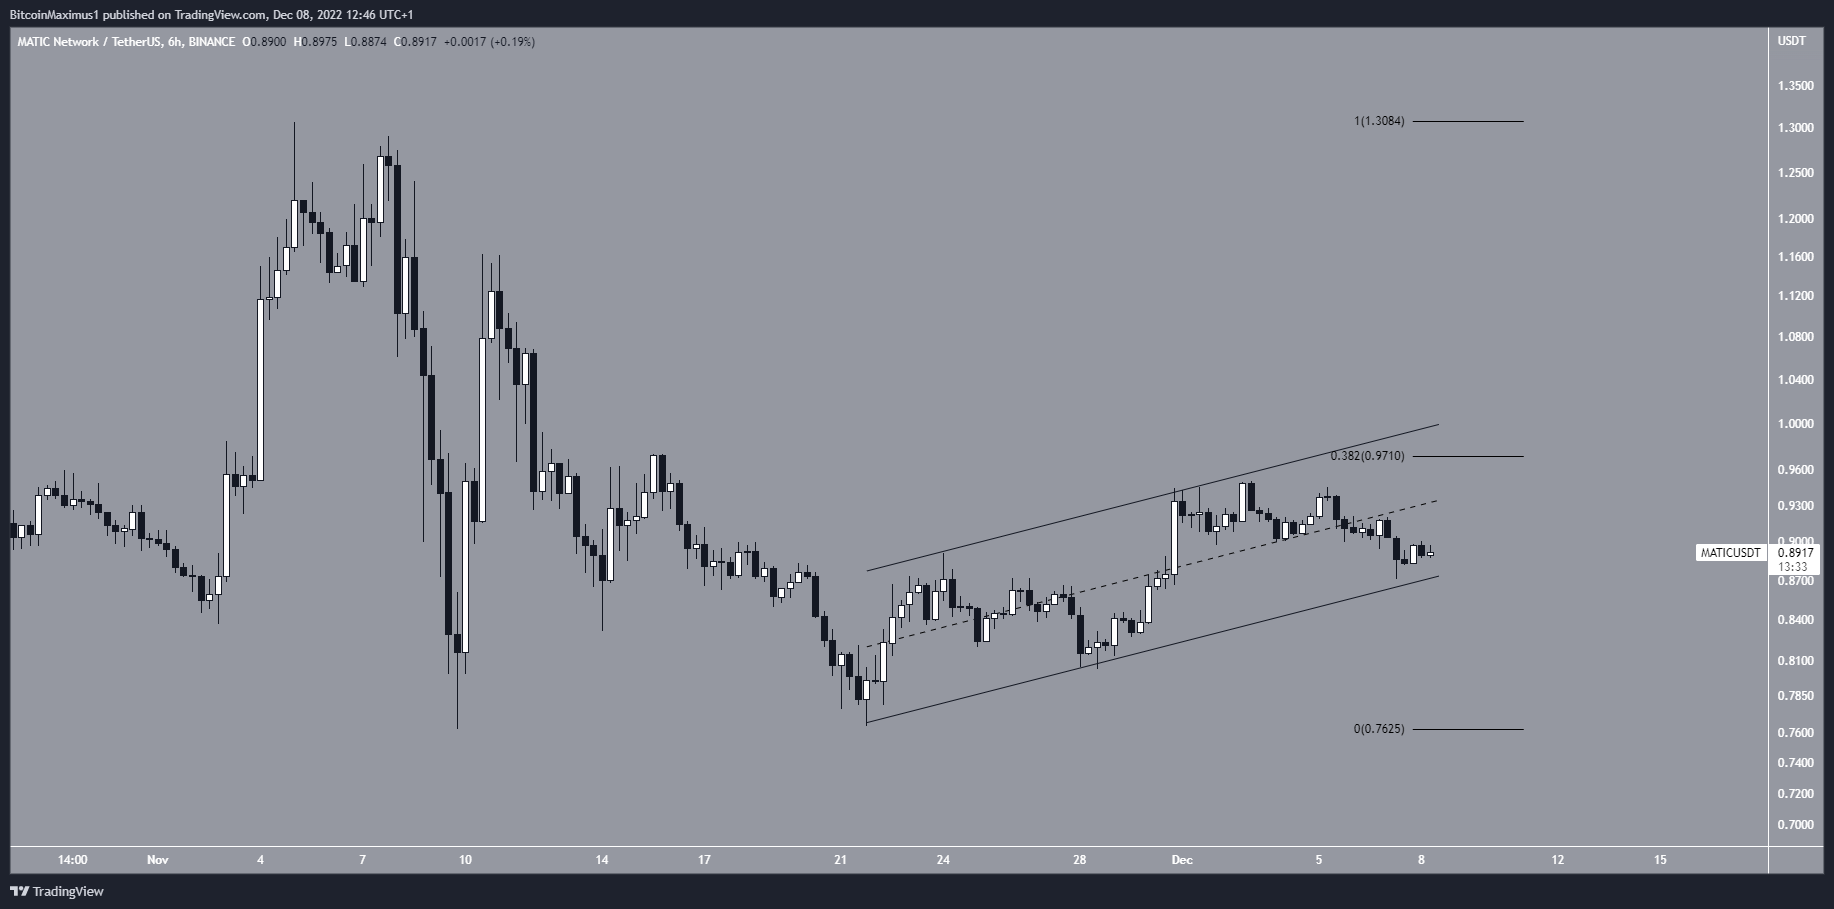
The short-term six-hour chart provides a bearish outlook. The main reason for this is that the Polygon price has traded inside an ascending parallel channel since Nov. 21. Moreover, the decrease over the past 24 hours took it below the channel’s midline. Additionally, the 0.382 Fib retracement resistance level rejected the Polygon price, preceding the downward movement.
As a result, a breakdown from the channel is the most likely scenario. If this occurs, it will take MATIC to the $0.74 horizontal support area.
A breakout from the $0.97 area would indicate that the short-term MATIC token price forecast is bullish instead.
For BeInCrypto’s latest crypto market analysis, click here.
Disclaimer: BeInCrypto strives to provide accurate and up-to-date news and information, but it will not be responsible for any missing facts or inaccurate information. You comply and understand that you should use any of this information at your own risk. Cryptocurrencies are highly volatile financial assets, so research and make your own financial decisions.


