


The Polkadot (DOT) price has generated bullish divergences in multiple time frames. While such divergences often precede upward movements, one has yet to occur.
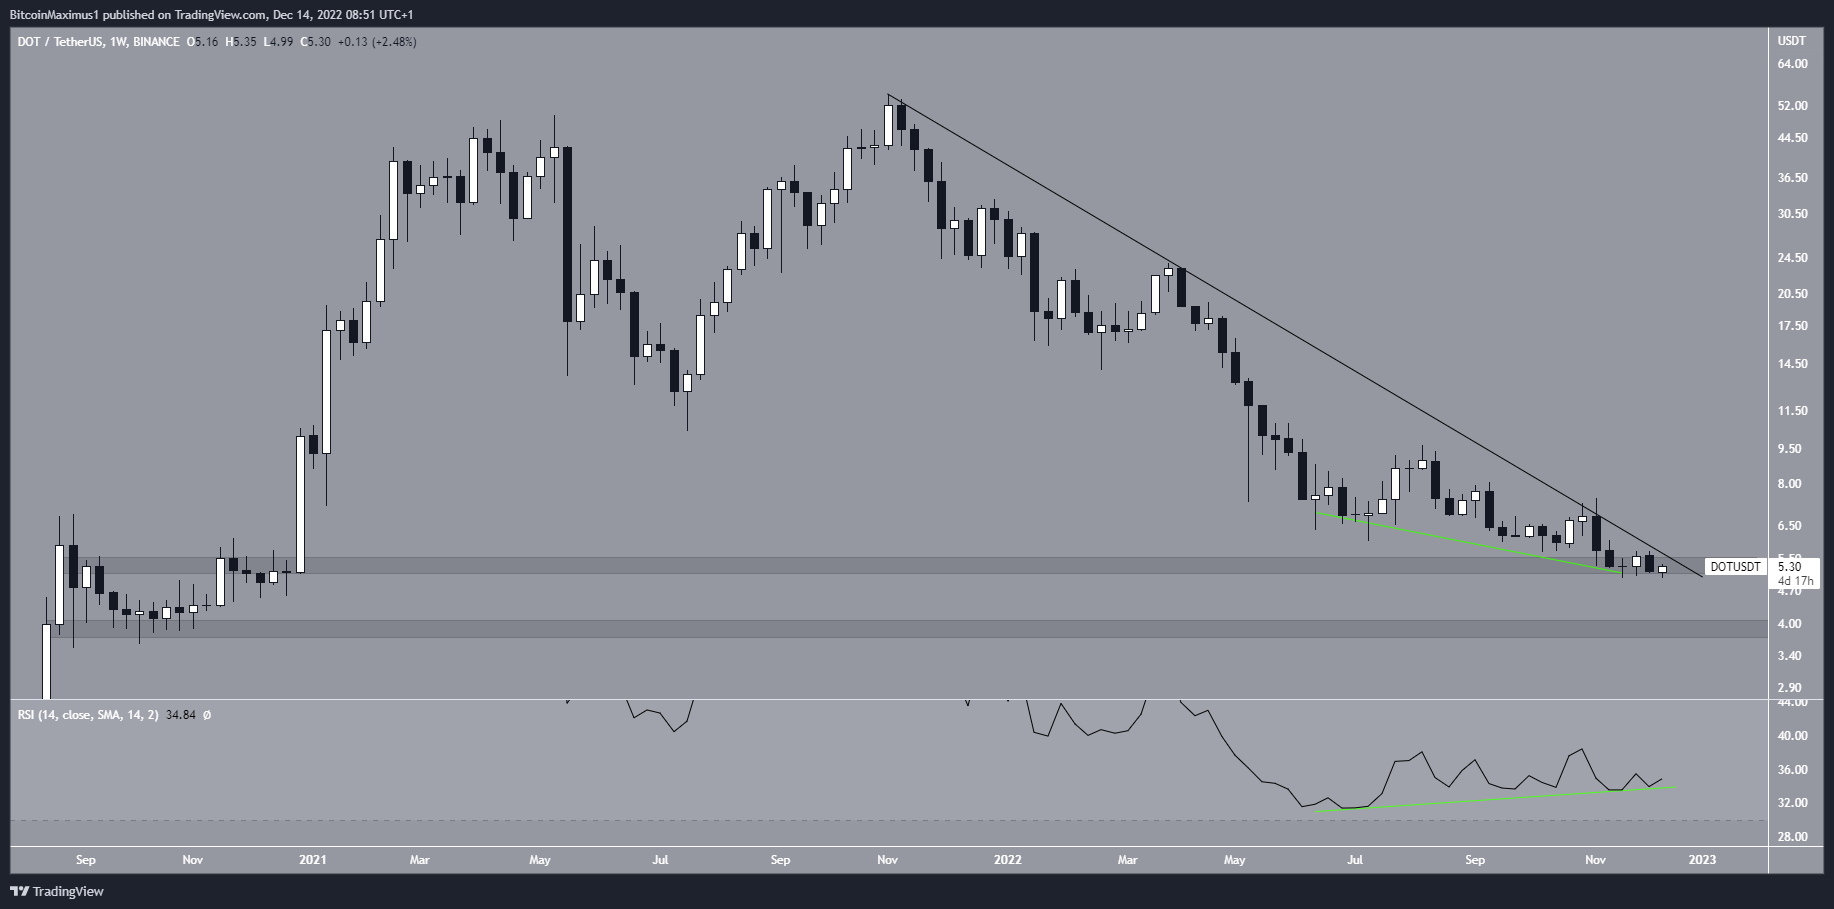
The Polkadot price has fallen below a descending resistance line since its all-time high of $55.09 in Nov. 2021. So far, the DOT token price fell to a low of $5 in Nov. 2022.
The Polkadot price has bounced slightly since, but it has yet to initiate a significant upward movement. Currently, it is trading inside the long-term $5.40 horizontal support area, which had previously acted as resistance.
The most bullish development in the price action is the bullish divergence in the weekly RSI (green line). The divergence is very significant and occurs in a long-term time frame. If it is sufficient to initiate a bullish trend reversal, the DOT price could break out from the resistance line and accelerate its rate of increase.
Conversely, a weekly close below the $5.40 area could cause an immediate drop toward the next support at $3.90.
Bullish Pattern Aligns With Polkadot Price Rally
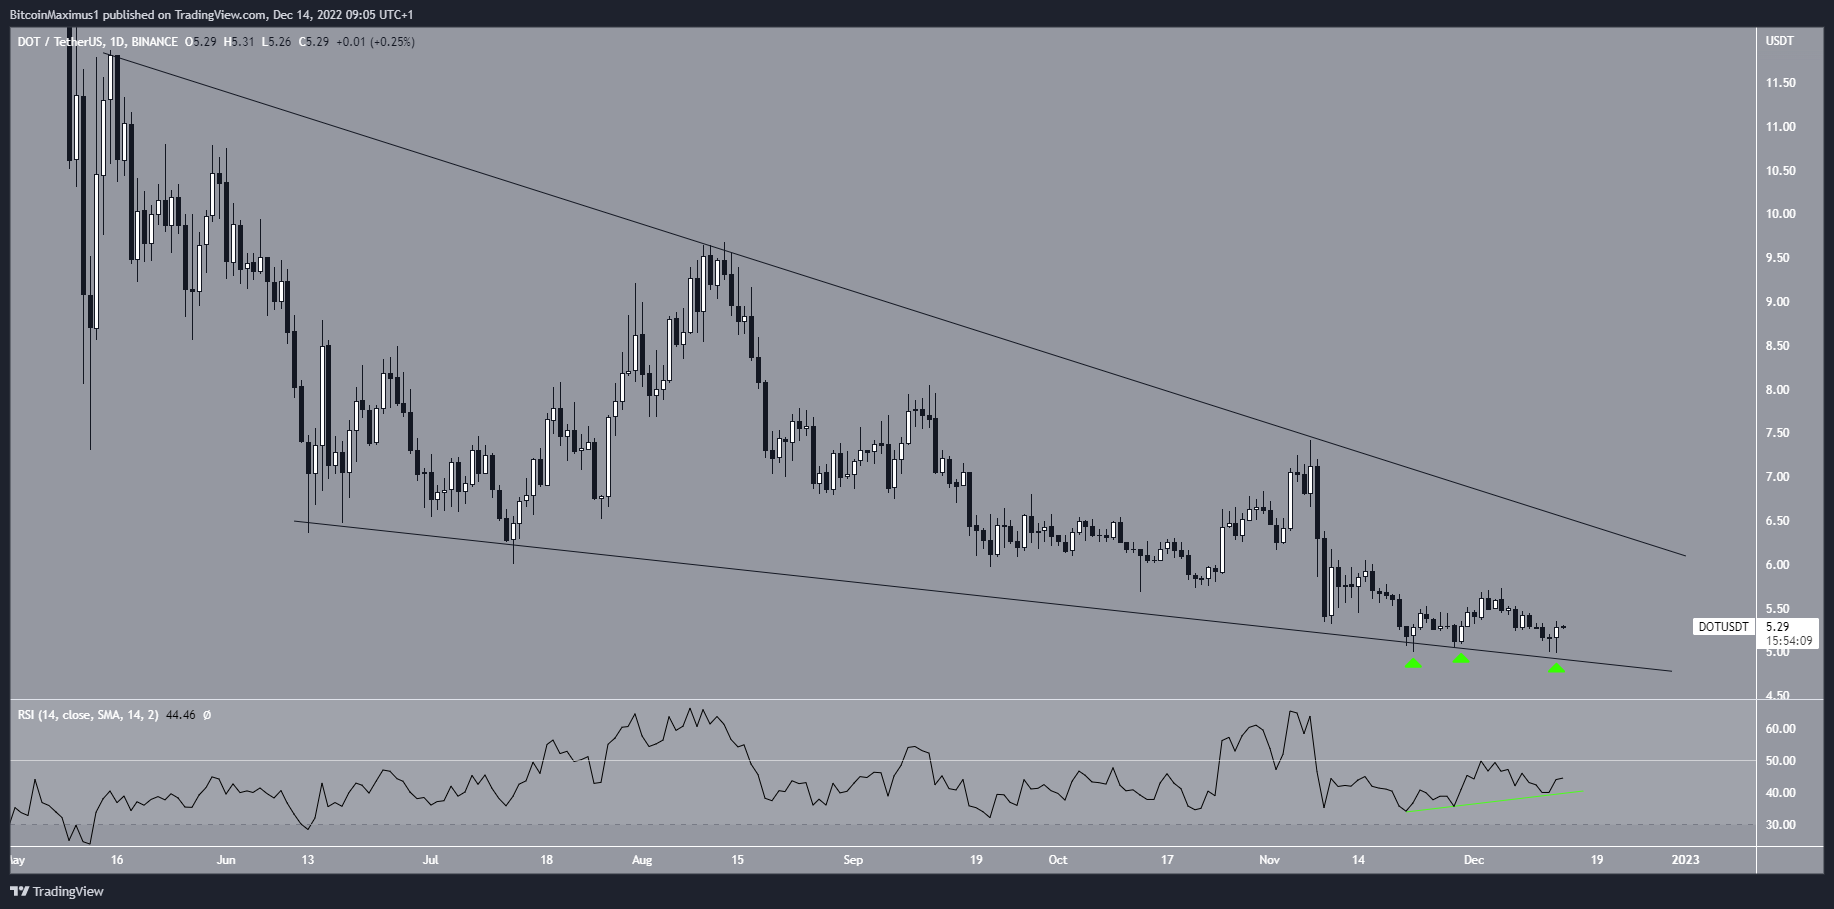
The daily chart shows that the Polkadot price has been trading inside a descending wedge since May. Since the descending wedge is considered a bullish pattern, an eventual breakout from it would be likely.
Since Nov. 22, the DOT price has traded close to the support line of the wedge, creating a triple bottom pattern (green icons) in the process. This is also considered a bullish pattern. Moreover, the daily RSI has generated a bullish divergence (green line). This aligns with the readings from the weekly timeframe, supporting the initiation of an upward movement.
As a result, a movement toward the resistance line of the wedge is the most likely scenario. This would also take the Polkadot price to the long-term resistance line. Such a movement seems to have already begun over the past 24 hours.
Conversely, a breakdown from the wedge would invalidate this bullish DOT price projection.
For BeInCrypto’s latest crypto market analysis, click here.


