


The Polkadot (DOT) price reached a new all-time high of $7.70 on Dec 29.
Polkadot has flipped the previous all-time high resistance area to support and is expected to continue increasing as long as it’s trading above it.
Polkadot Breakout Leads to New Highs
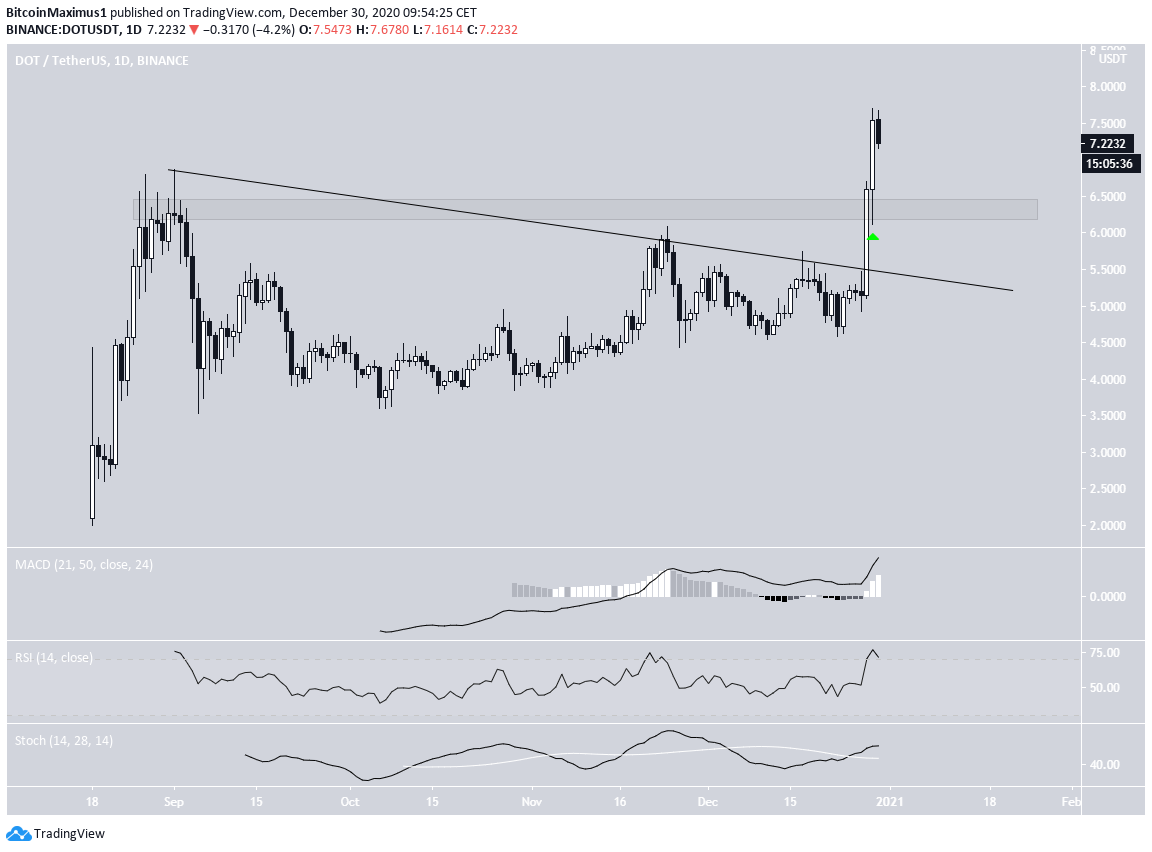
DOT had been following a descending resistance line since reaching $6.86 on Sept. 1.
On Dec. 28, DOT was able to successfully move above this line and proceeded to reach a new all-time high of $7.70 the next day.
Furthermore, DOT validated the $6.30 area as support in the form of a long lower wick (shown with the green arrow in the image below). As long as DOT is trading above this level, it is expected to continue increasing.
Technical indicators are also bullish, supporting the possibility that DOT will continue moving higher.
DOT Moves into Positive Price Discovery
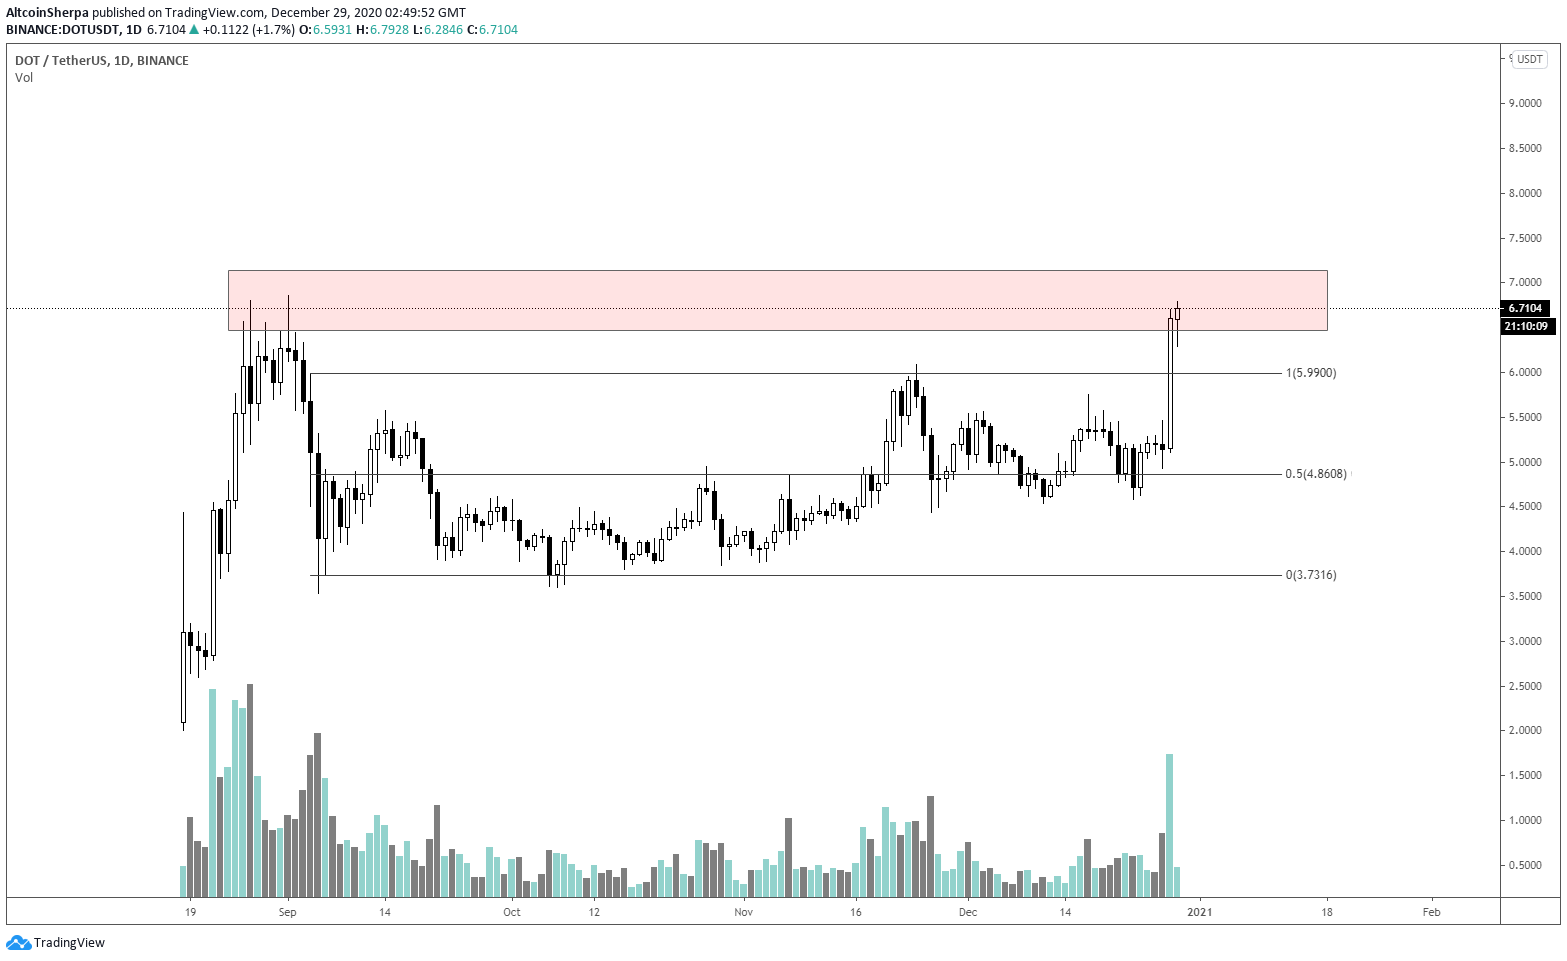
Cryptocurrency trader @altcoinsherpa outlined a DOT chart, stating that the price is close to reaching a new all-time high.
Since the tweet, DOT has moved above the $6.30 resistance area, which is now likely to act as support.
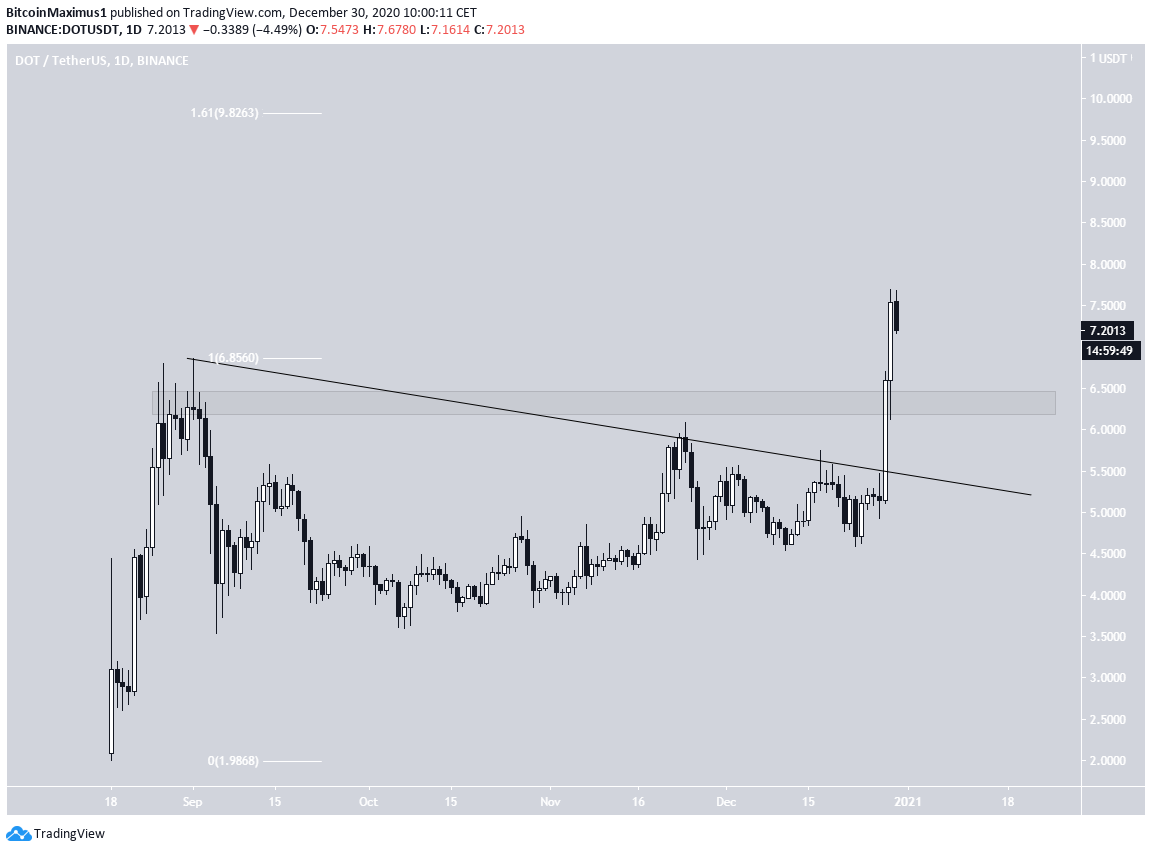
Since DOT is at an all-time high, we need to use Fib extensions in order to determine the next possible resistance levels.
The 1.61 Fib extension of the initial upward move shows that the next closest resistance area is likely to be found at $9.82.
DeFi Index
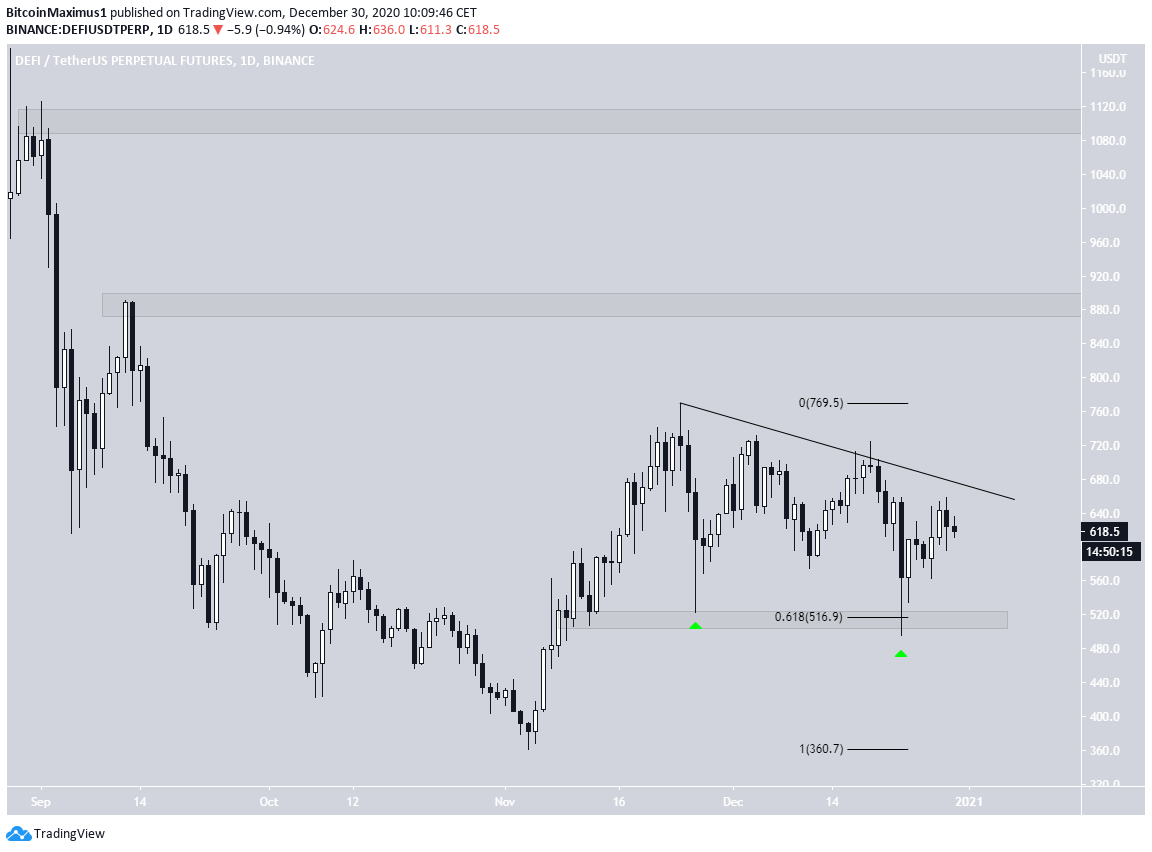
The DeFi index has been decreasing since reaching a high of $769 on Nov. 24. Throughout this period, it has been following a descending resistance line.
However, the index has also bounced twice at the $516 support area (also the 0.618 Fib retracement level). This has created two long lower wicks — a sign of buying pressure. The fact that the wicks occurred at a crucial Fib retracement level makes it likely that the index has completed its correction.
If it breaks out above the descending resistance line, the next resistance areas would be found at $900 and $1,100.
Conclusion
As long as DOT is trading above the $6.30 support level, it’s expected to continue increasing towards the next resistance area at $9.80.
The DeFi Index is expected to break out above the current descending resistance line and continue increasing towards the resistance levels at $900 & $1,100.
For BeInCrypto’s latest Bitcoin (BTC) analysis, click here!
Disclaimer: Cryptocurrency trading carries a high level of risk and may not be suitable for all investors. The views expressed in this article do not reflect those of BeInCrypto.


