


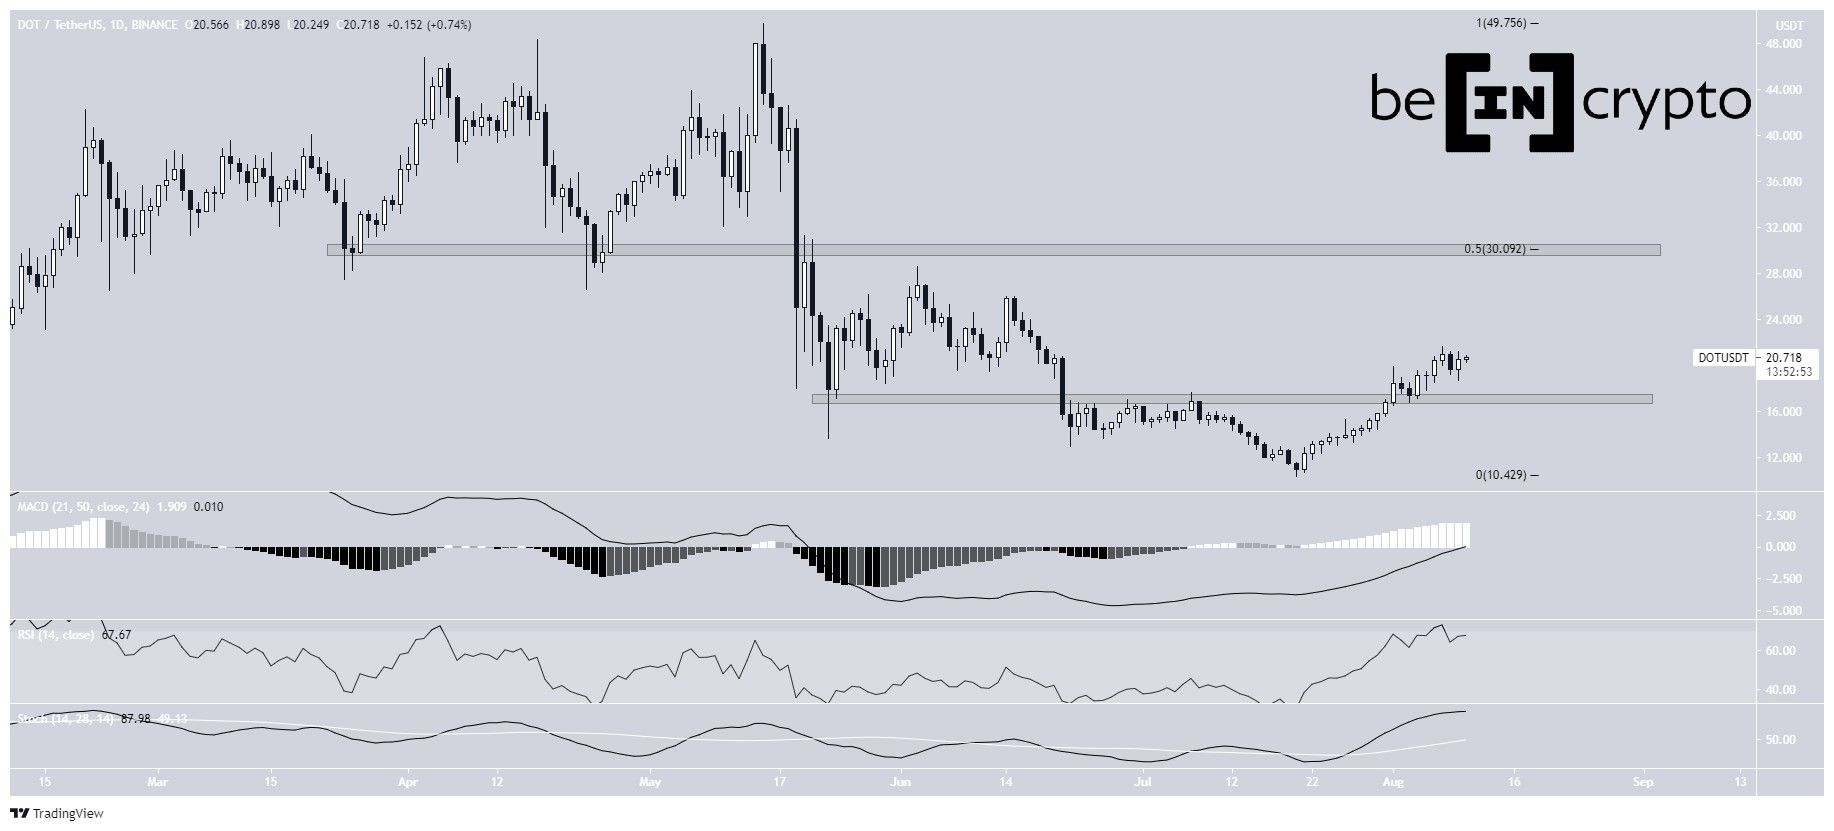
Polkadot (DOT) has been moving upwards since July 20 and has reclaimed the $17.10 horizontal support area.
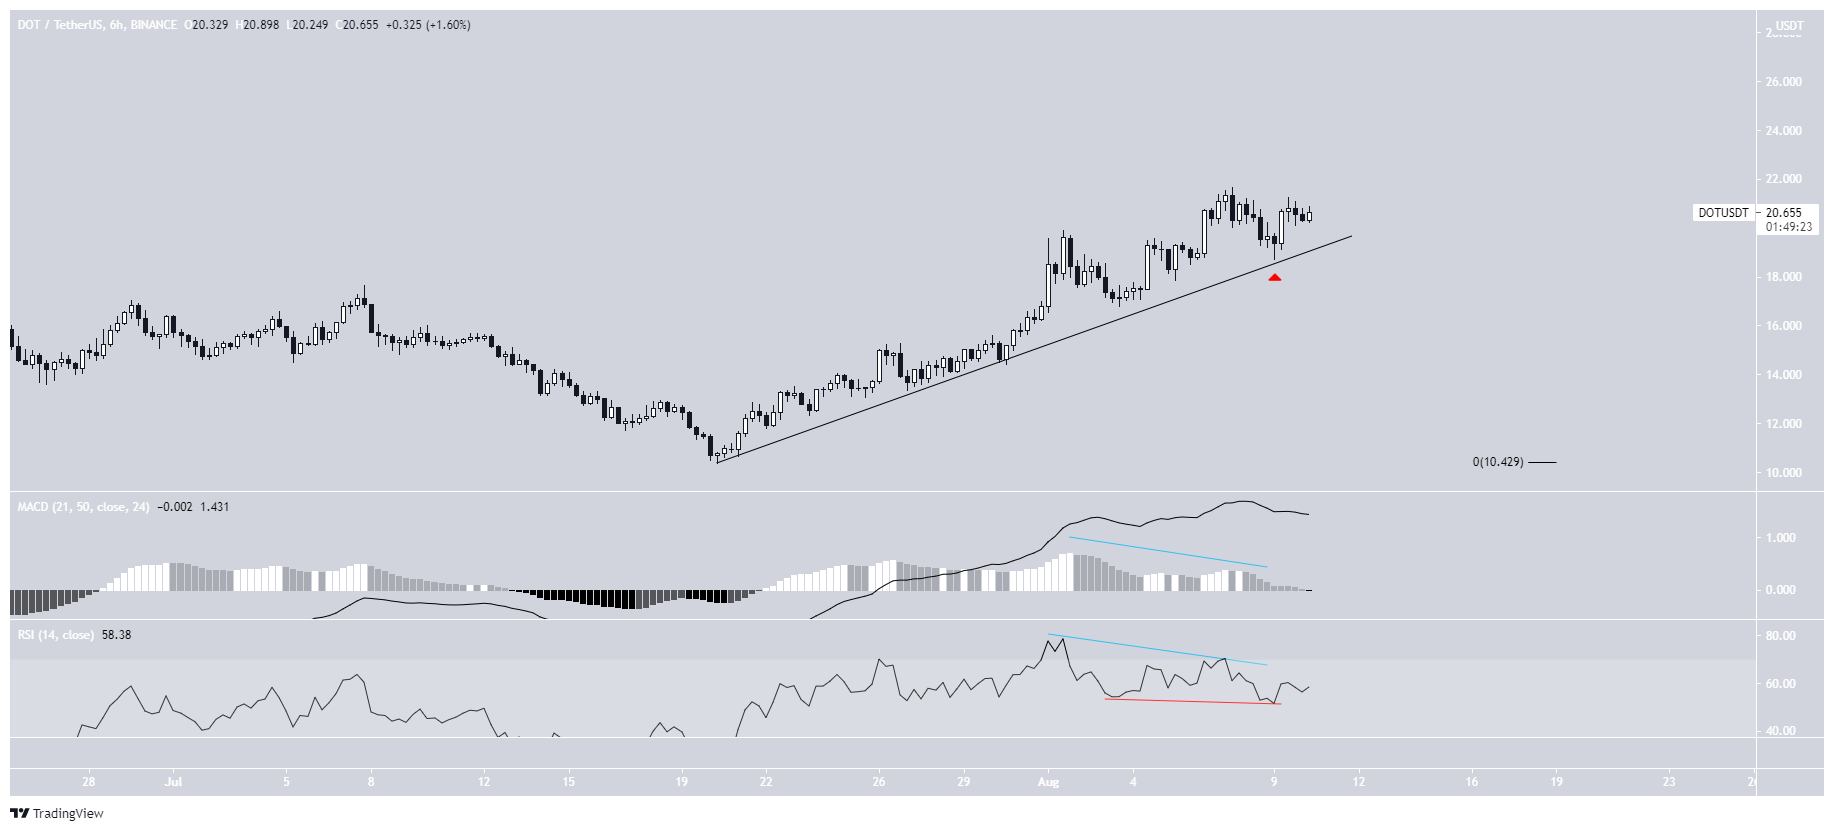
DOT is increasing alongside an ascending support line, and the bullish trend remains intact as long as it continues to do so.
DOT bounces
DOT has been increasing since July 20, after it reached a low of $10.37. On Aug 1, it managed to move above the $17.10 horizontal area and validated it as support three days later. It has been increasing since then, and has managed to reach a local high of $21.68.
Technical indicators in the daily time frame are bullish, supporting the continuation of the upward move. This is especially evident in the MACD, which has crossed above the 0-line.
The closest resistance area is found at $30.10. This target is the 0.5 Fib retracement resistance level.
Future movement
The six-hour chart provides mixed readings.
On the bullish side, we can see that DOT is following an ascending support line and bounced from it on Aug 9 (red icon).
However, both the MACD and RSI have generated bearish divergences (blue). Nevertheless, the latter has created a hidden bullish divergence (red), which was followed by the aforementioned bounce.
Therefore, as long as the support line is intact, DOT is more likely to continue increasing.
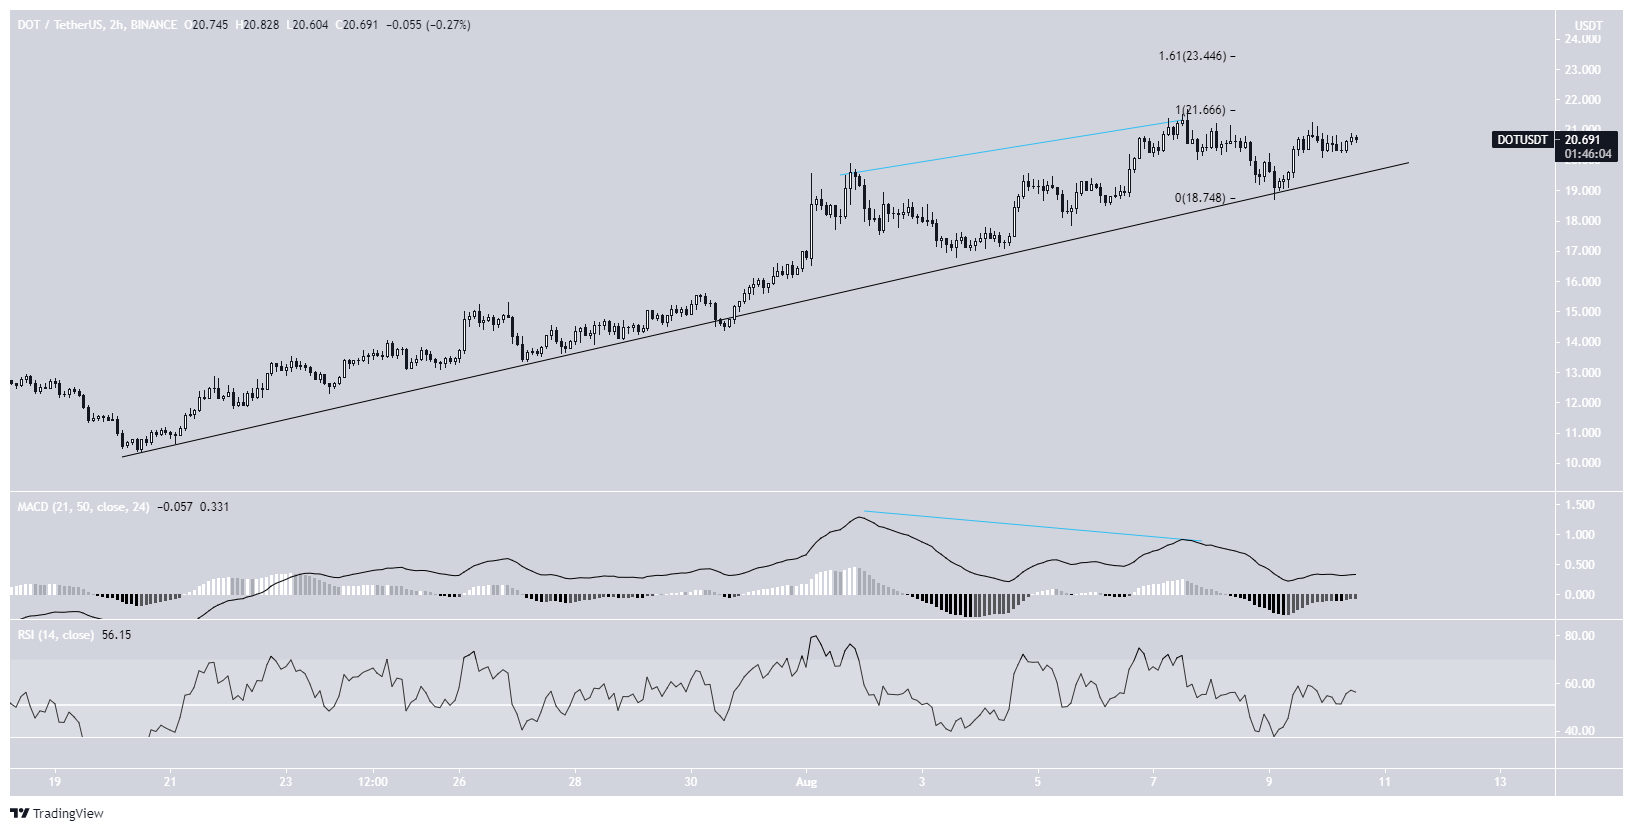
The two-hour chart also shows that the decrease as a result of the divergence is already complete.
After this, the MACD gave a bullish reversal signal and the RSI moved above 50.
If DOT reaches a new local high, the first minor resistance level would be found at $23.45.
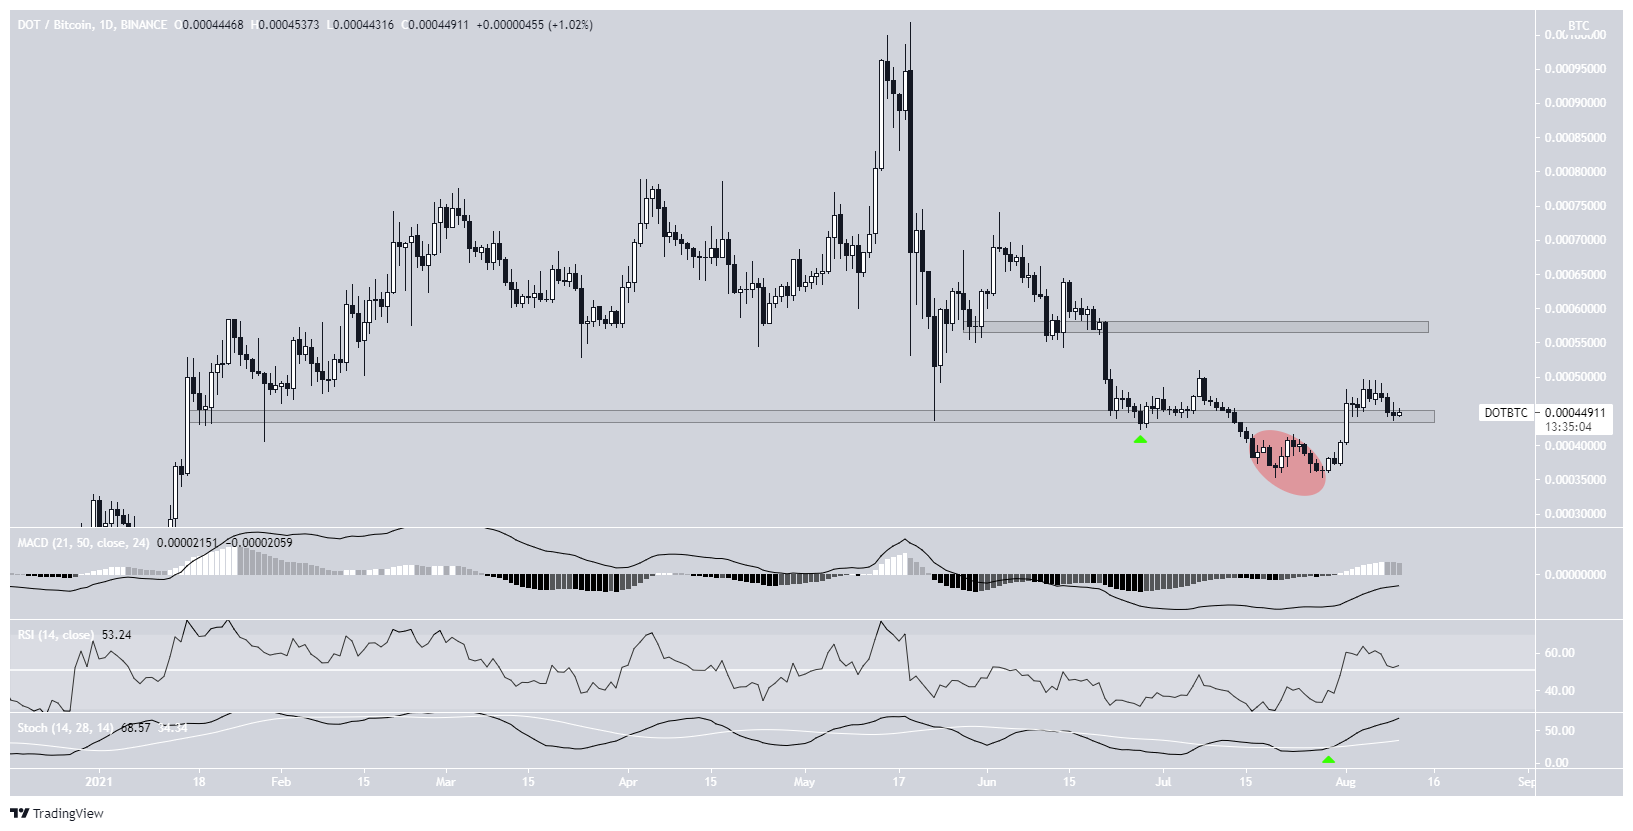
DOT/BTC
Cryptocurrency trader @CryptoCapo_ outlined a DOT chart, stating that the price is bouncing from the golden zone and that a bullish reversal would be confirmed by a move above 67,000 satoshis.
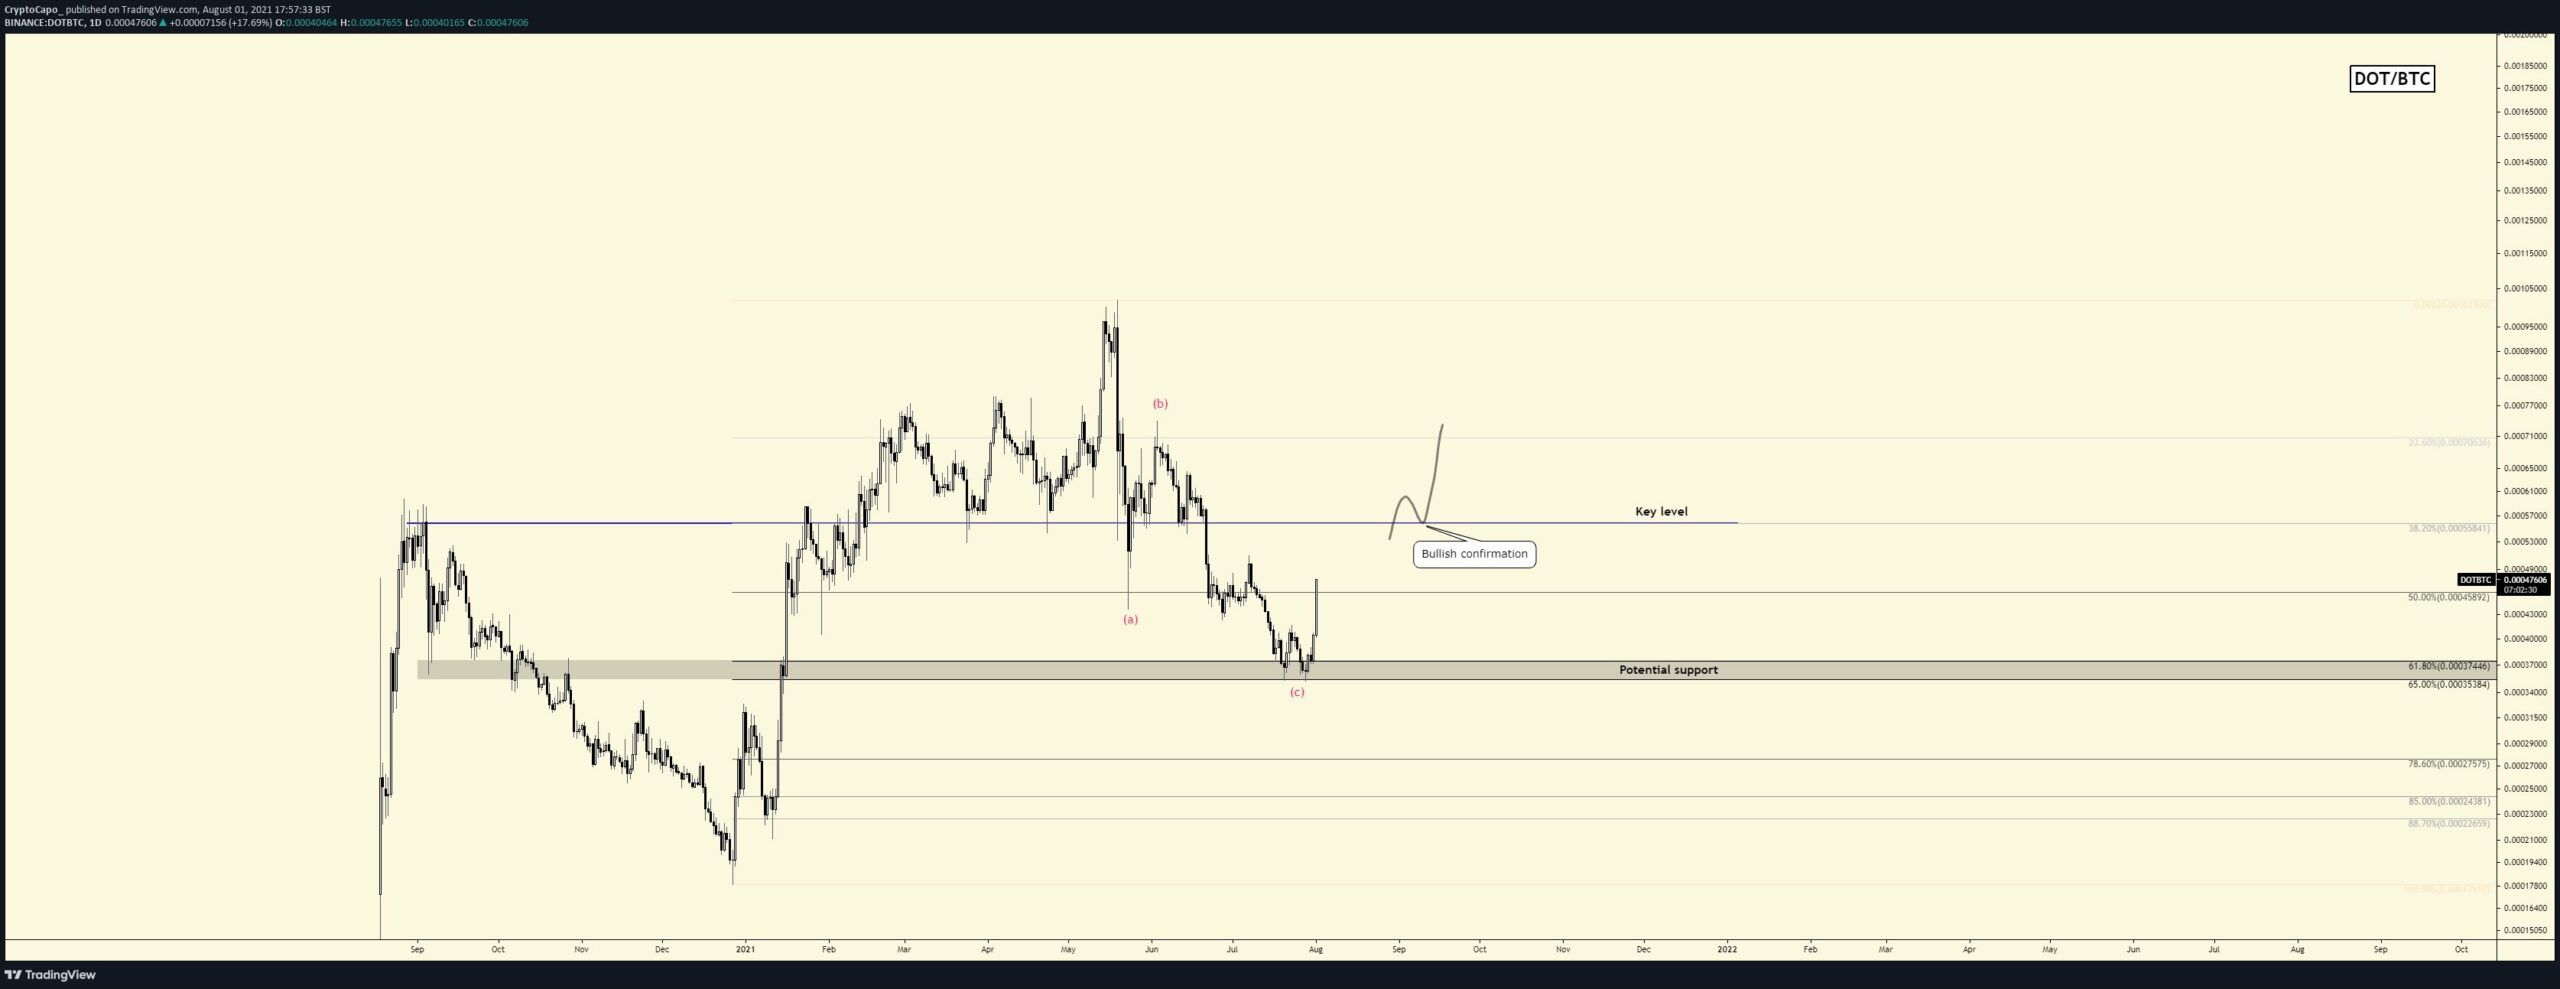
In the period between July 12-29 (red circle), DOT/BTC seemed to have broken down below the 45,000 satoshi support area.
However, it began an upward move shortly afterwards and reclaimed the area on Aug 1. This is an extremely bullish development since deviations below such levels are usually followed by a significant move in the other direction.
This is also supported by technical indicators, especially the RSI and MACD. The former has just crossed above 50 while the latter has made a bullish cross.
The closest resistance area is found at 57,500 satoshis.
For BeInCrypto’s latest bitcoin (BTC) analysis, click here.


