


Polkadot (DOT) is potentially in the initial stages of a parabolic upward movement that could cause it to greatly increase in value.
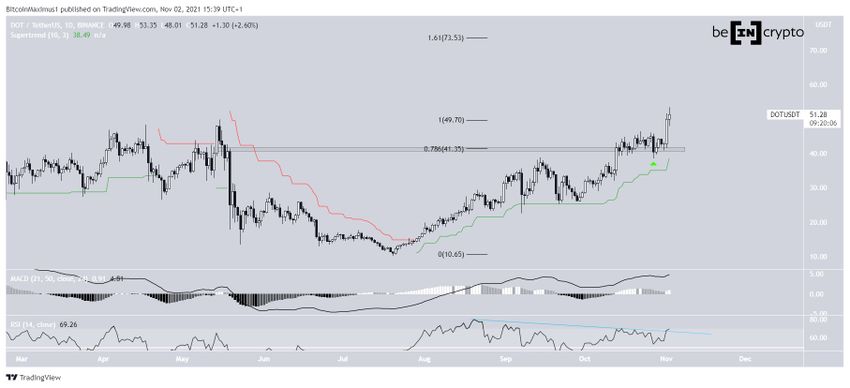
Polkadot has been moving upwards since the beginning of July. On Oct 14, it broke out from the $41.35 horizontal resistance area. This was crucial since the area presented the final obstacle prior to a new all-time high price.
DOT validated the area as support on Oct 27 (green icon) and the rally accelerated after.
On Nov 2, Polkadot reached a new all-time high price of $53.35. The next resistance is found at $73.53, created by the 1.61 external Fib retracement level when measuring the most recent drop. Due to the price being at an all-time high, such Fib levels are often used to estimate the next resistance levels.
Technical indicators support the continuation of the upward movement.
The MACD, which is created by short and long-term moving averages, is positive and increasing. This means that the short-term trend is faster than the long-term one.
The Supertrend, which uses volatility to determine the direction of the trend, shows a bullish trend since the DOT price is above the indicator line (green).
More importantly, the RSI has broken its bearish divergence trendline and is moving upwards. This means that momentum is getting stronger at the same rate as the price increase.
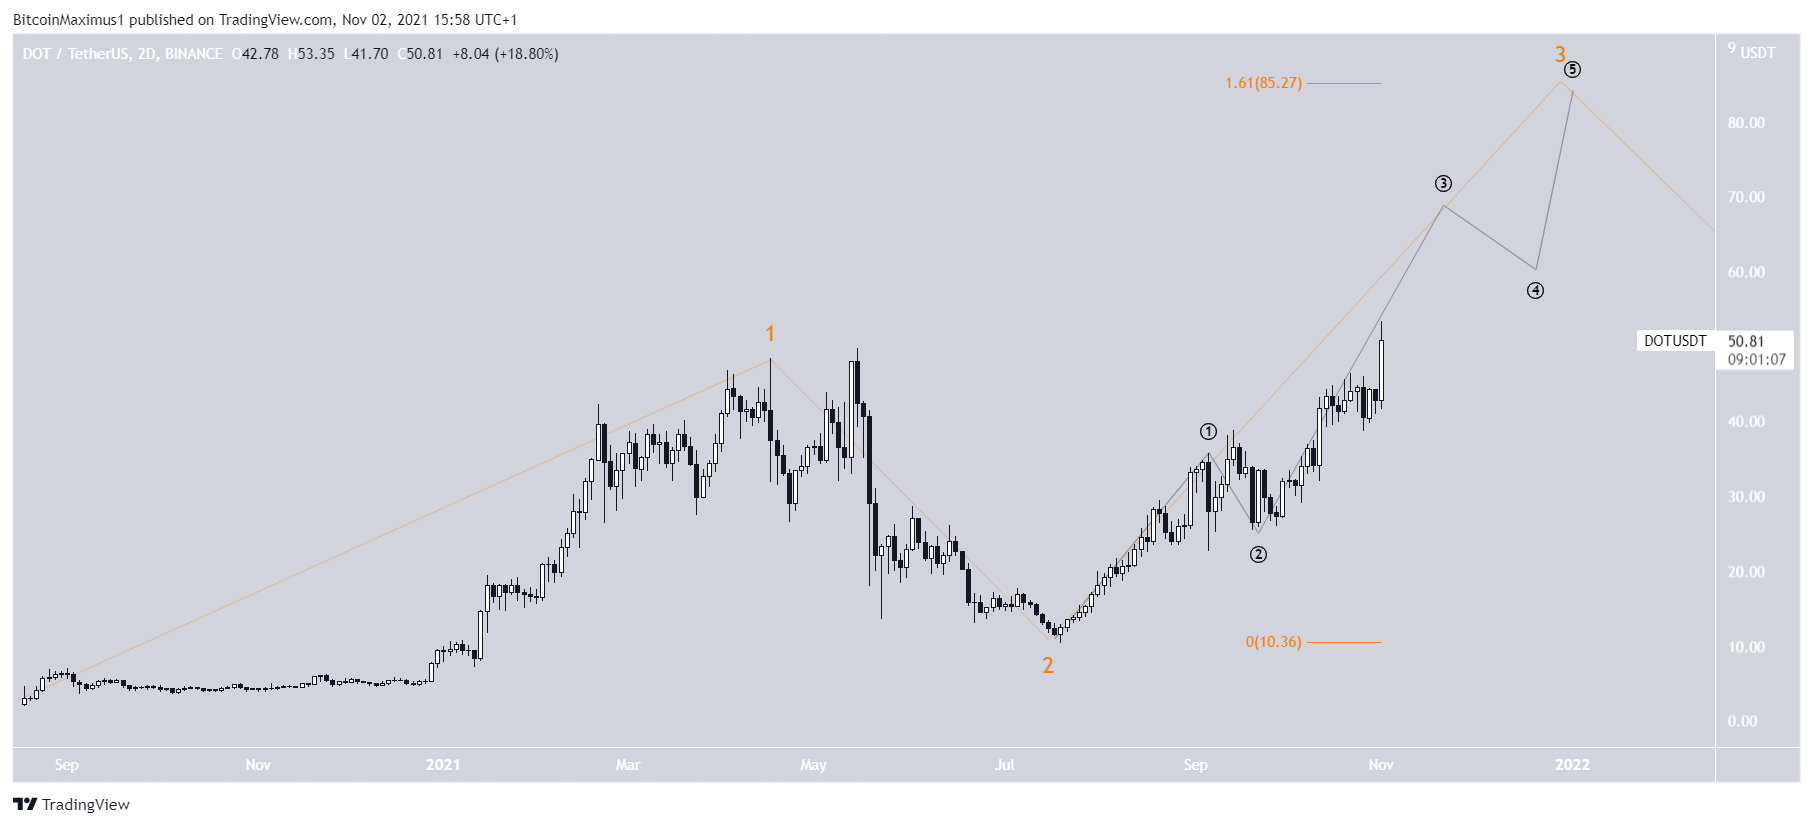
Wave count
The wave count also supports the continuation of the upward move at a rapid pace.
It suggests that DOT is in wave three of a five-wave upward movement (orange). The first potential target for the top is found at $85. This would give waves 1-3 a 1:1.61 ratio, common in such upward movements.
Considering the 1.61 resistance at $73, the entire $73-$85 region could act as a potential area for a local top.
DOT/BTC
Cryptocurrency trader @Pentosh1 outlined a DOT/BTC chart, stating that it’s likely to move towards new all-time highs next.
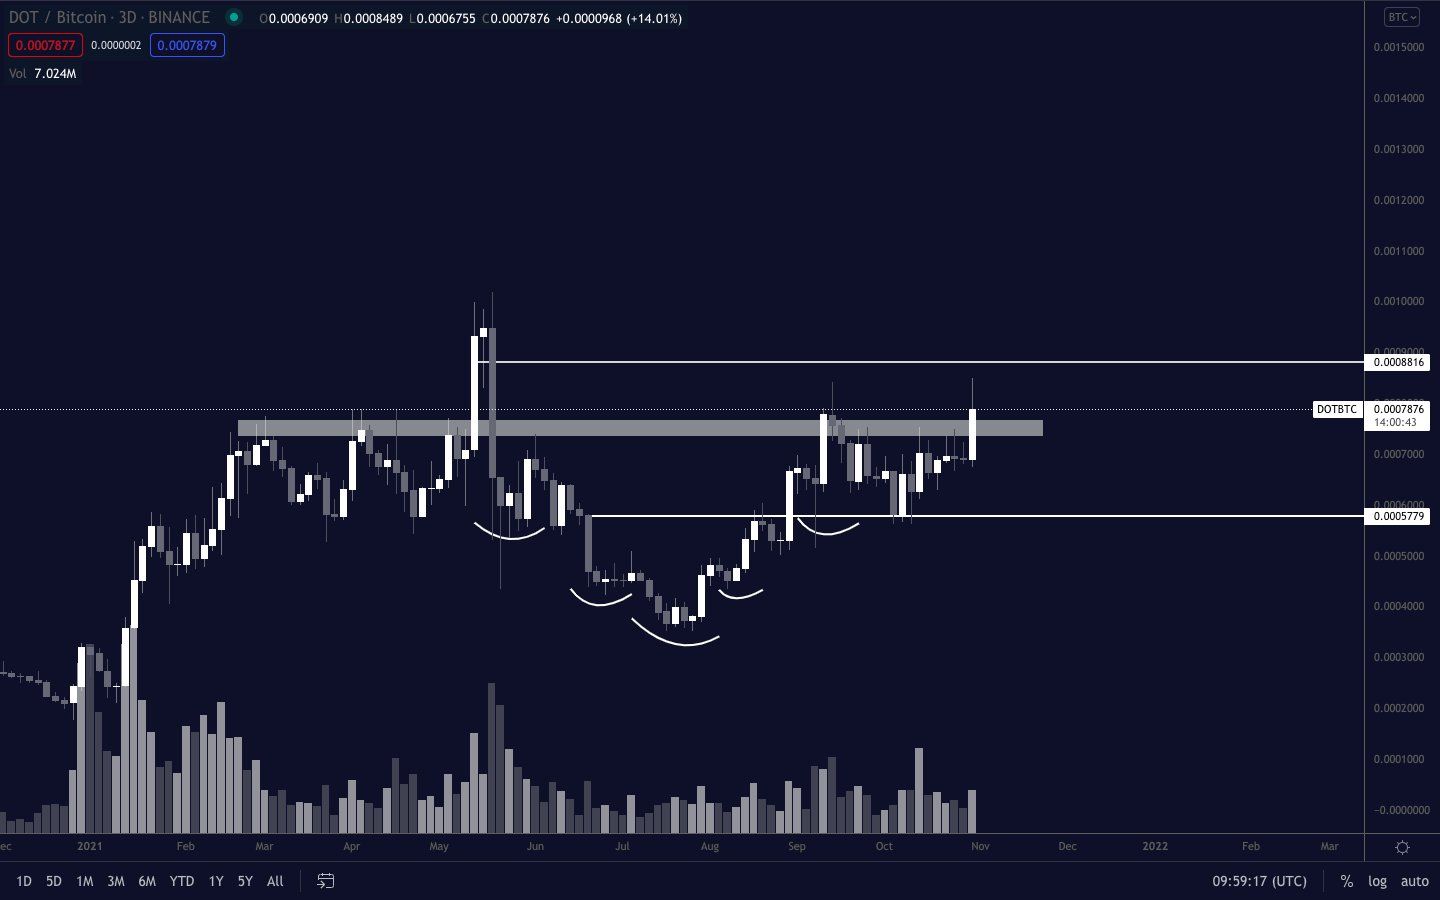
The DOT/BTC pair shows a similarly bullish chart.
The pair has broken out from a descending resistance line that’s been in place since the May all-time high. This is a sign that the ongoing correction has come to an end.
Furthermore, both the RSI and MACD support the continuation of the upward movement.
The next resistance is found at ₿0.001 — at the aforementioned all-time highs. If DOT breaks out, it could increase all the way to ₿0.0014.

For BeInCrypto’s latest Bitcoin (BTC) analysis, click here.


