


Polkadot (DOT) is at a crucial level in its long-term pattern, a movement above which could be the catalyst for a significant bullish trend reversal.
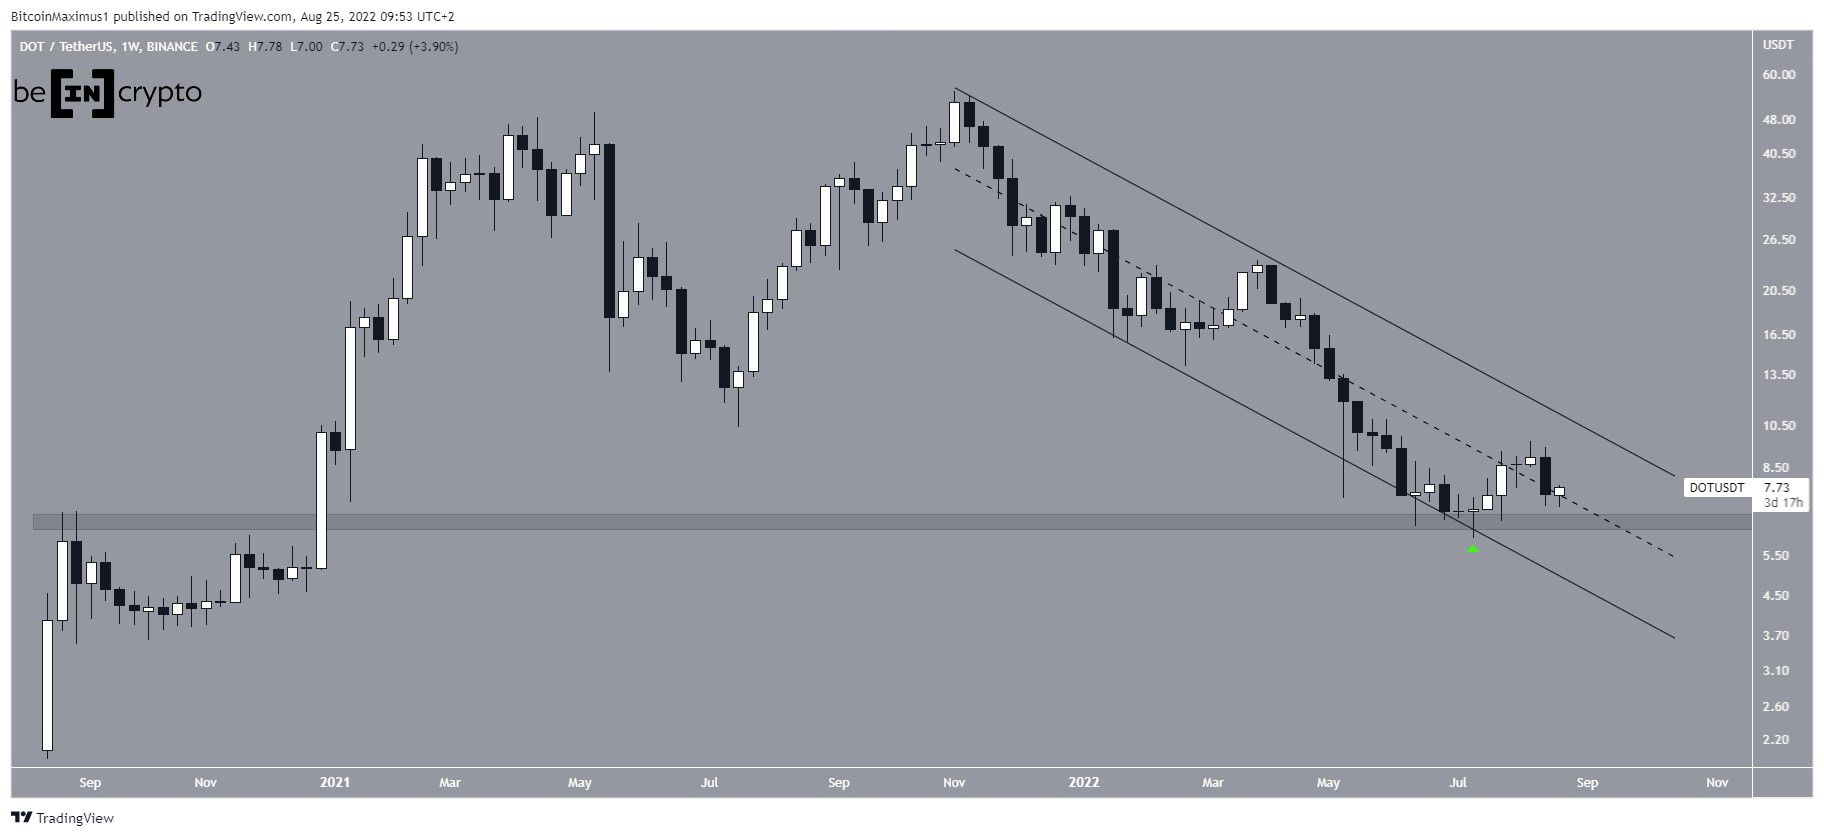
DOT has been falling underneath a descending parallel channel since reaching an all-time high price of $55.09 in Nov. The downward movement has so far led to a low of $6 last month.
The ensuing bounce and creation of a long lower wick (green icon) served to validate both the $5.60 horizontal support area and the support line of the channel. Currently, the price is attempting to reclaim the middle of the channel.
Parallel channels usually contain corrective movements. When combined with the reclaim of the middle of the channel, this further increases the chance for a potential breakout.
Since the channel has been in place since the all-time high, a breakout above it would confirm that the correction is complete.
(A logarithmic chart is used in the image below in order to better visualize large price fluctuations)
Cryptocurrency trader @Incomesharks tweeted a chart of DOT, stating that the price could gradually increase towards $16 and possibly $23.
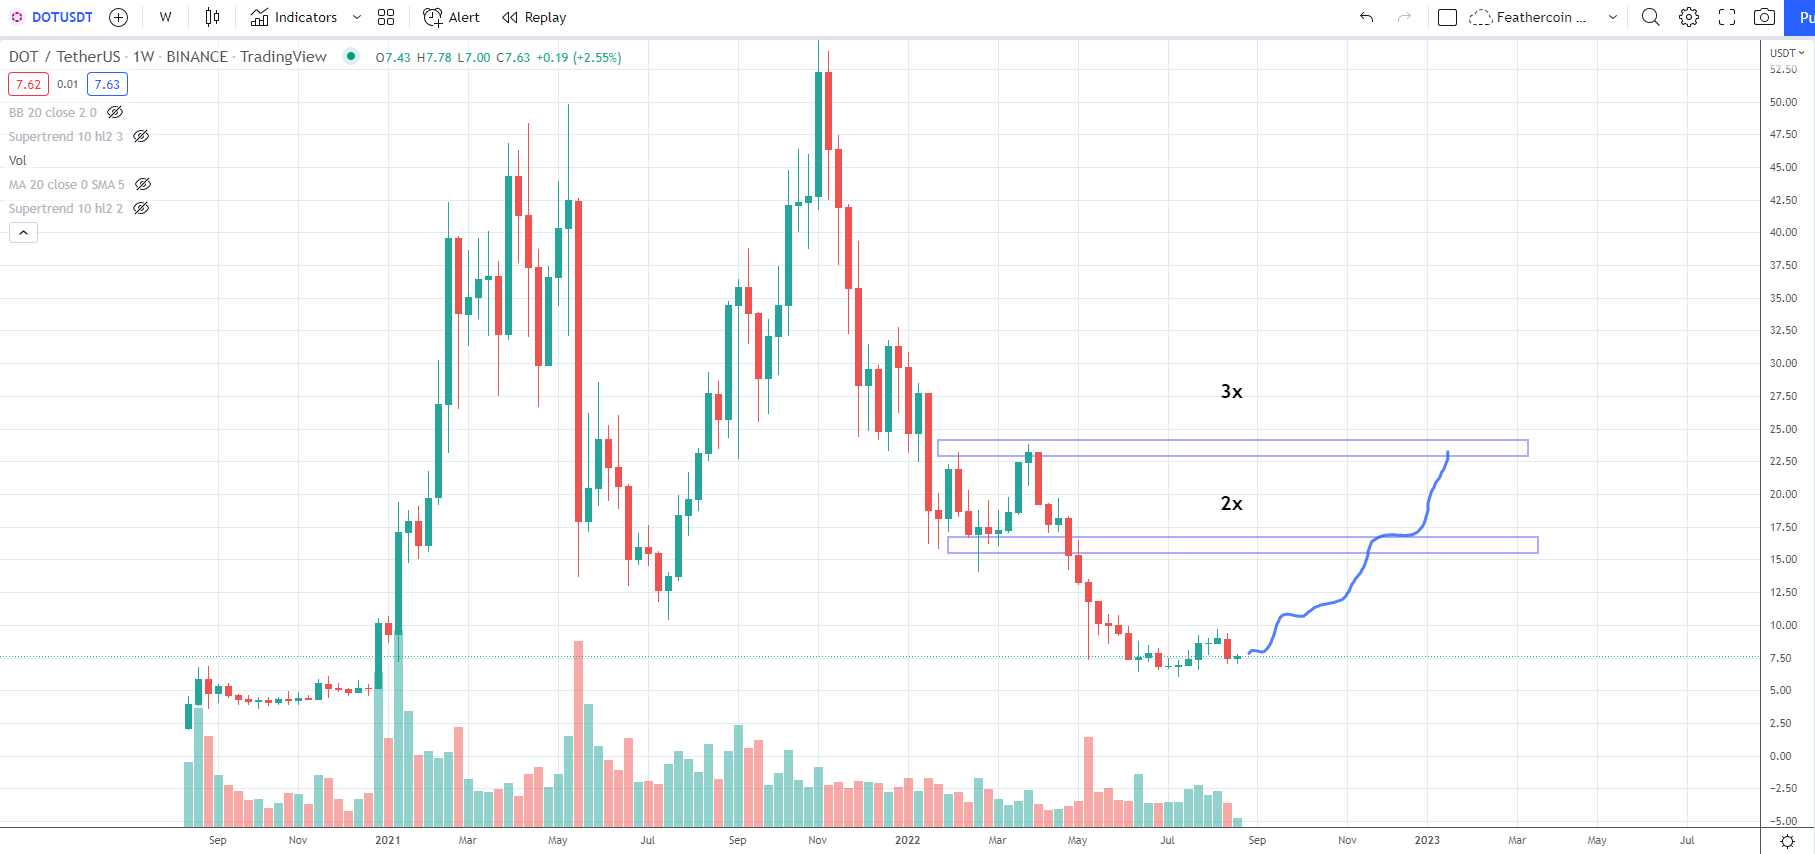
If the price manages to break out from the middle of the channel, it is possible that it will increase towards these targets.
Short-term DOT breakout
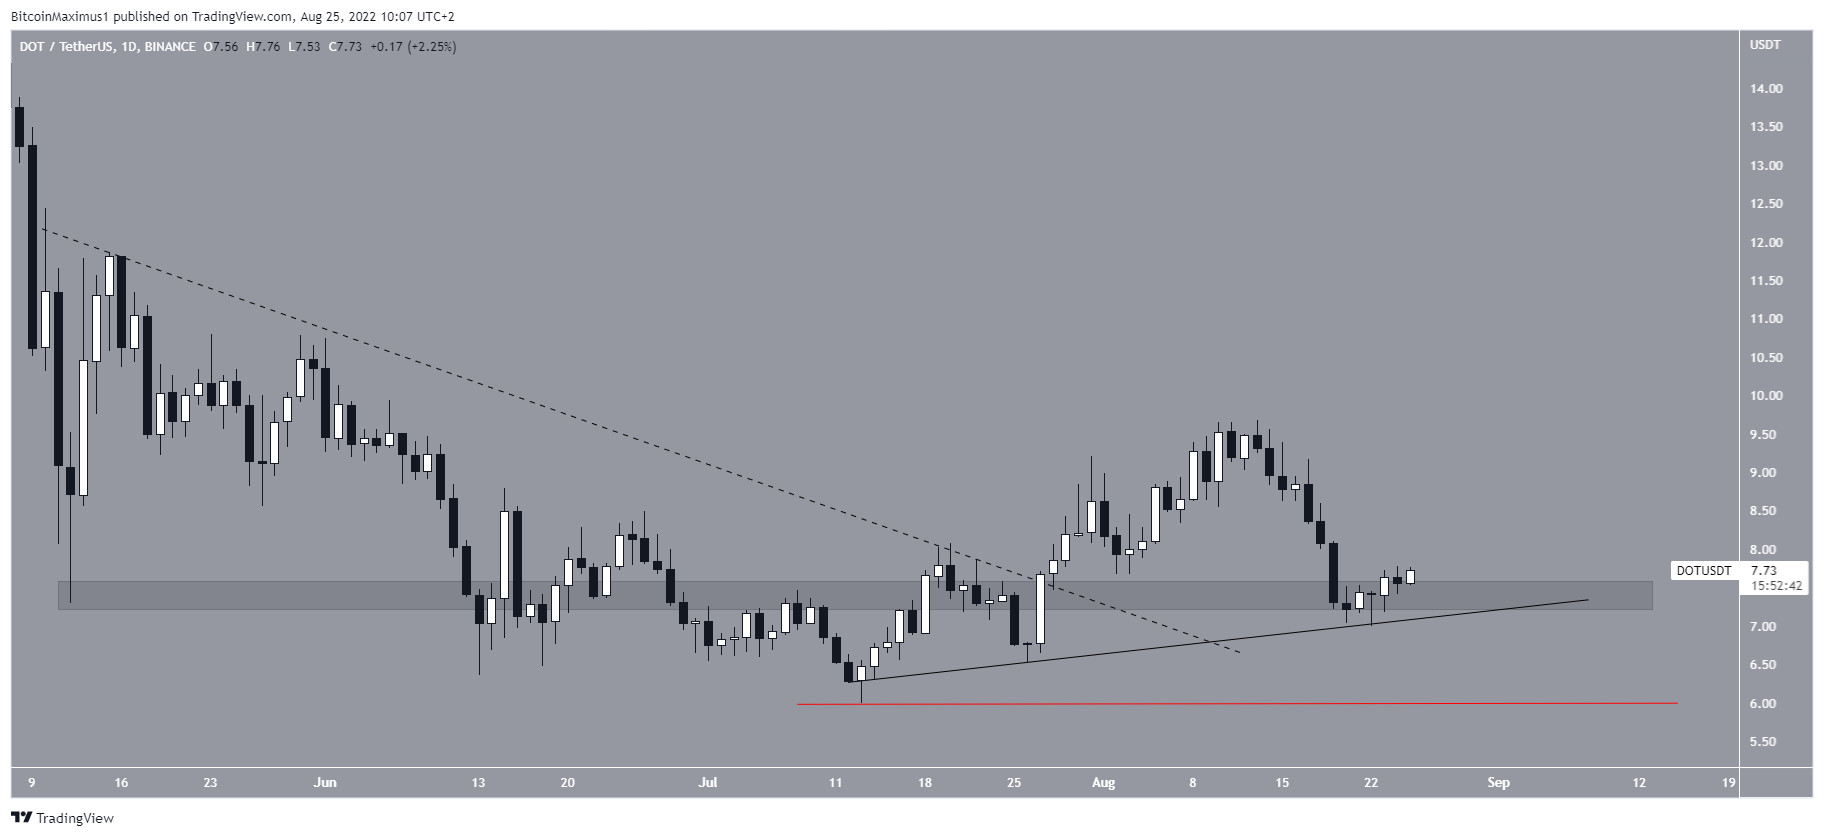
The daily chart shows that DOT broke out to form a descending resistance line (dashed) on July 27. Afterward, it decreased and validated the minor $7.60 horizontal support area. The area also coincided with an ascending support line that has been in place since the July lows.
So, the bullish structure is still intact, since DOT has so far created a series of higher lows. Therefore, the possibility of a long-term breakout towards the previously outlined targets still remains.
However, a decrease below the July 13 low (red line) would invalidate the bullish structure.
For Be[in]Crypto’s latest Bitcoin (BTC) analysis, click here


