


Polkadot (DOT) has generated several bullish divergences while trading inside a crucial support area, suggesting that a bounce could follow soon.
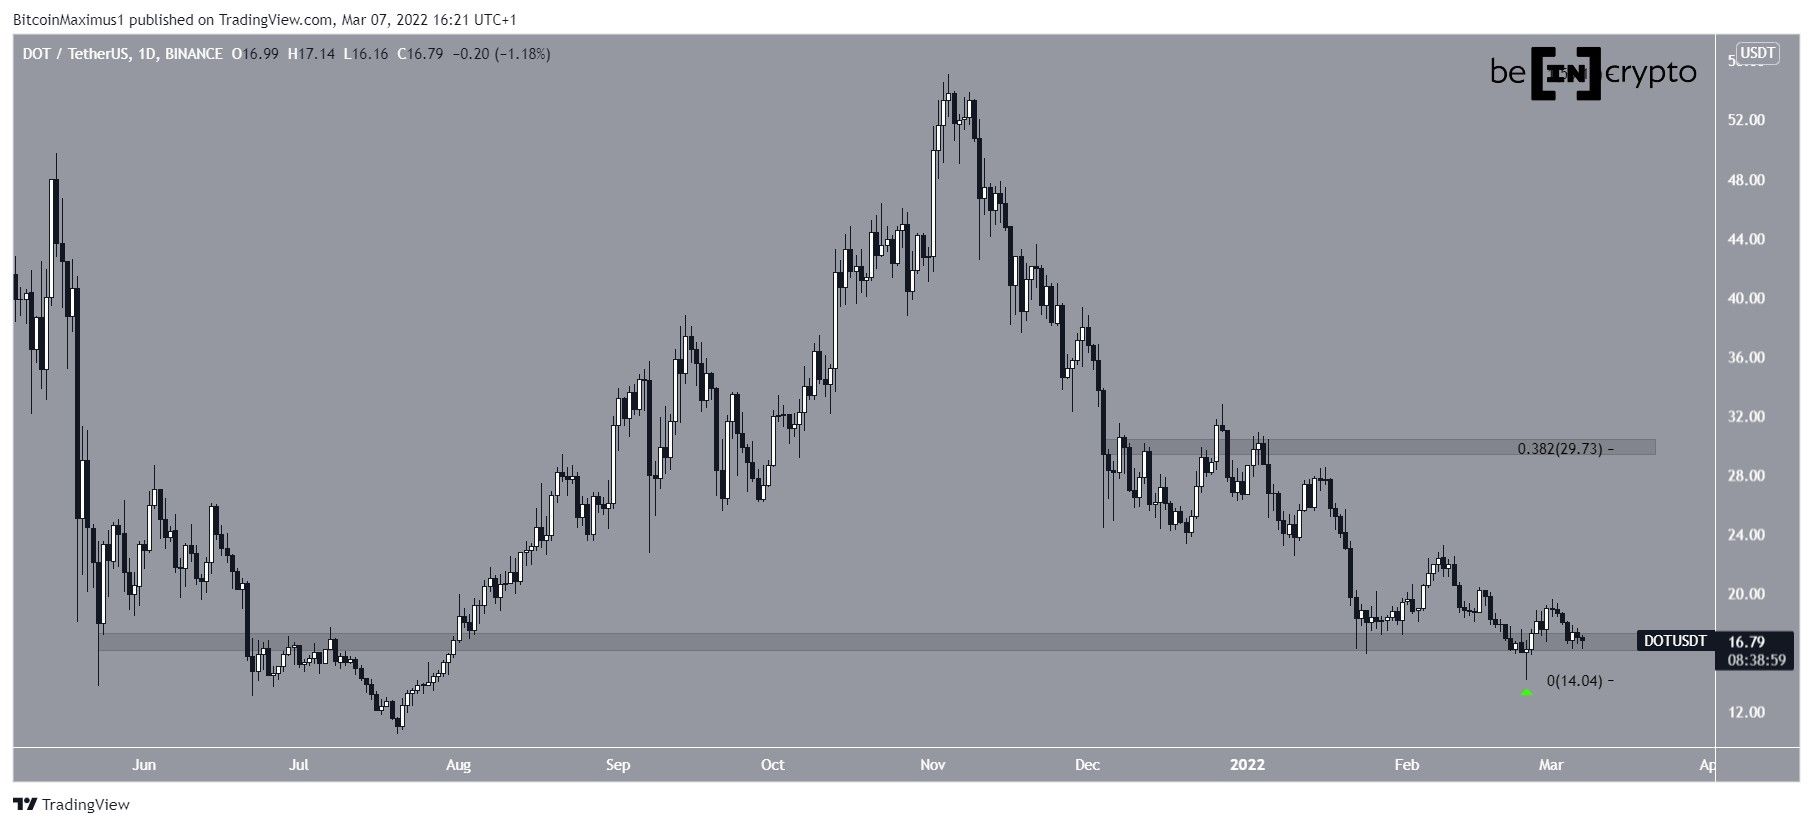
DOT has been falling since reaching an all-time high price of $55.04 on Nov 4. The downward movement led to a low of $14.05 on Feb 14.
The low seemingly caused a breakdown from the $16.70 horizontal support area. However, DOT created a long lower wick instead and bounced, validating the area as support.
If the bounce continues, the closest resistance area would be at $29.70. This is the 0.382 Fib retracement resistance level and a horizontal resistance area.
Potential bounce
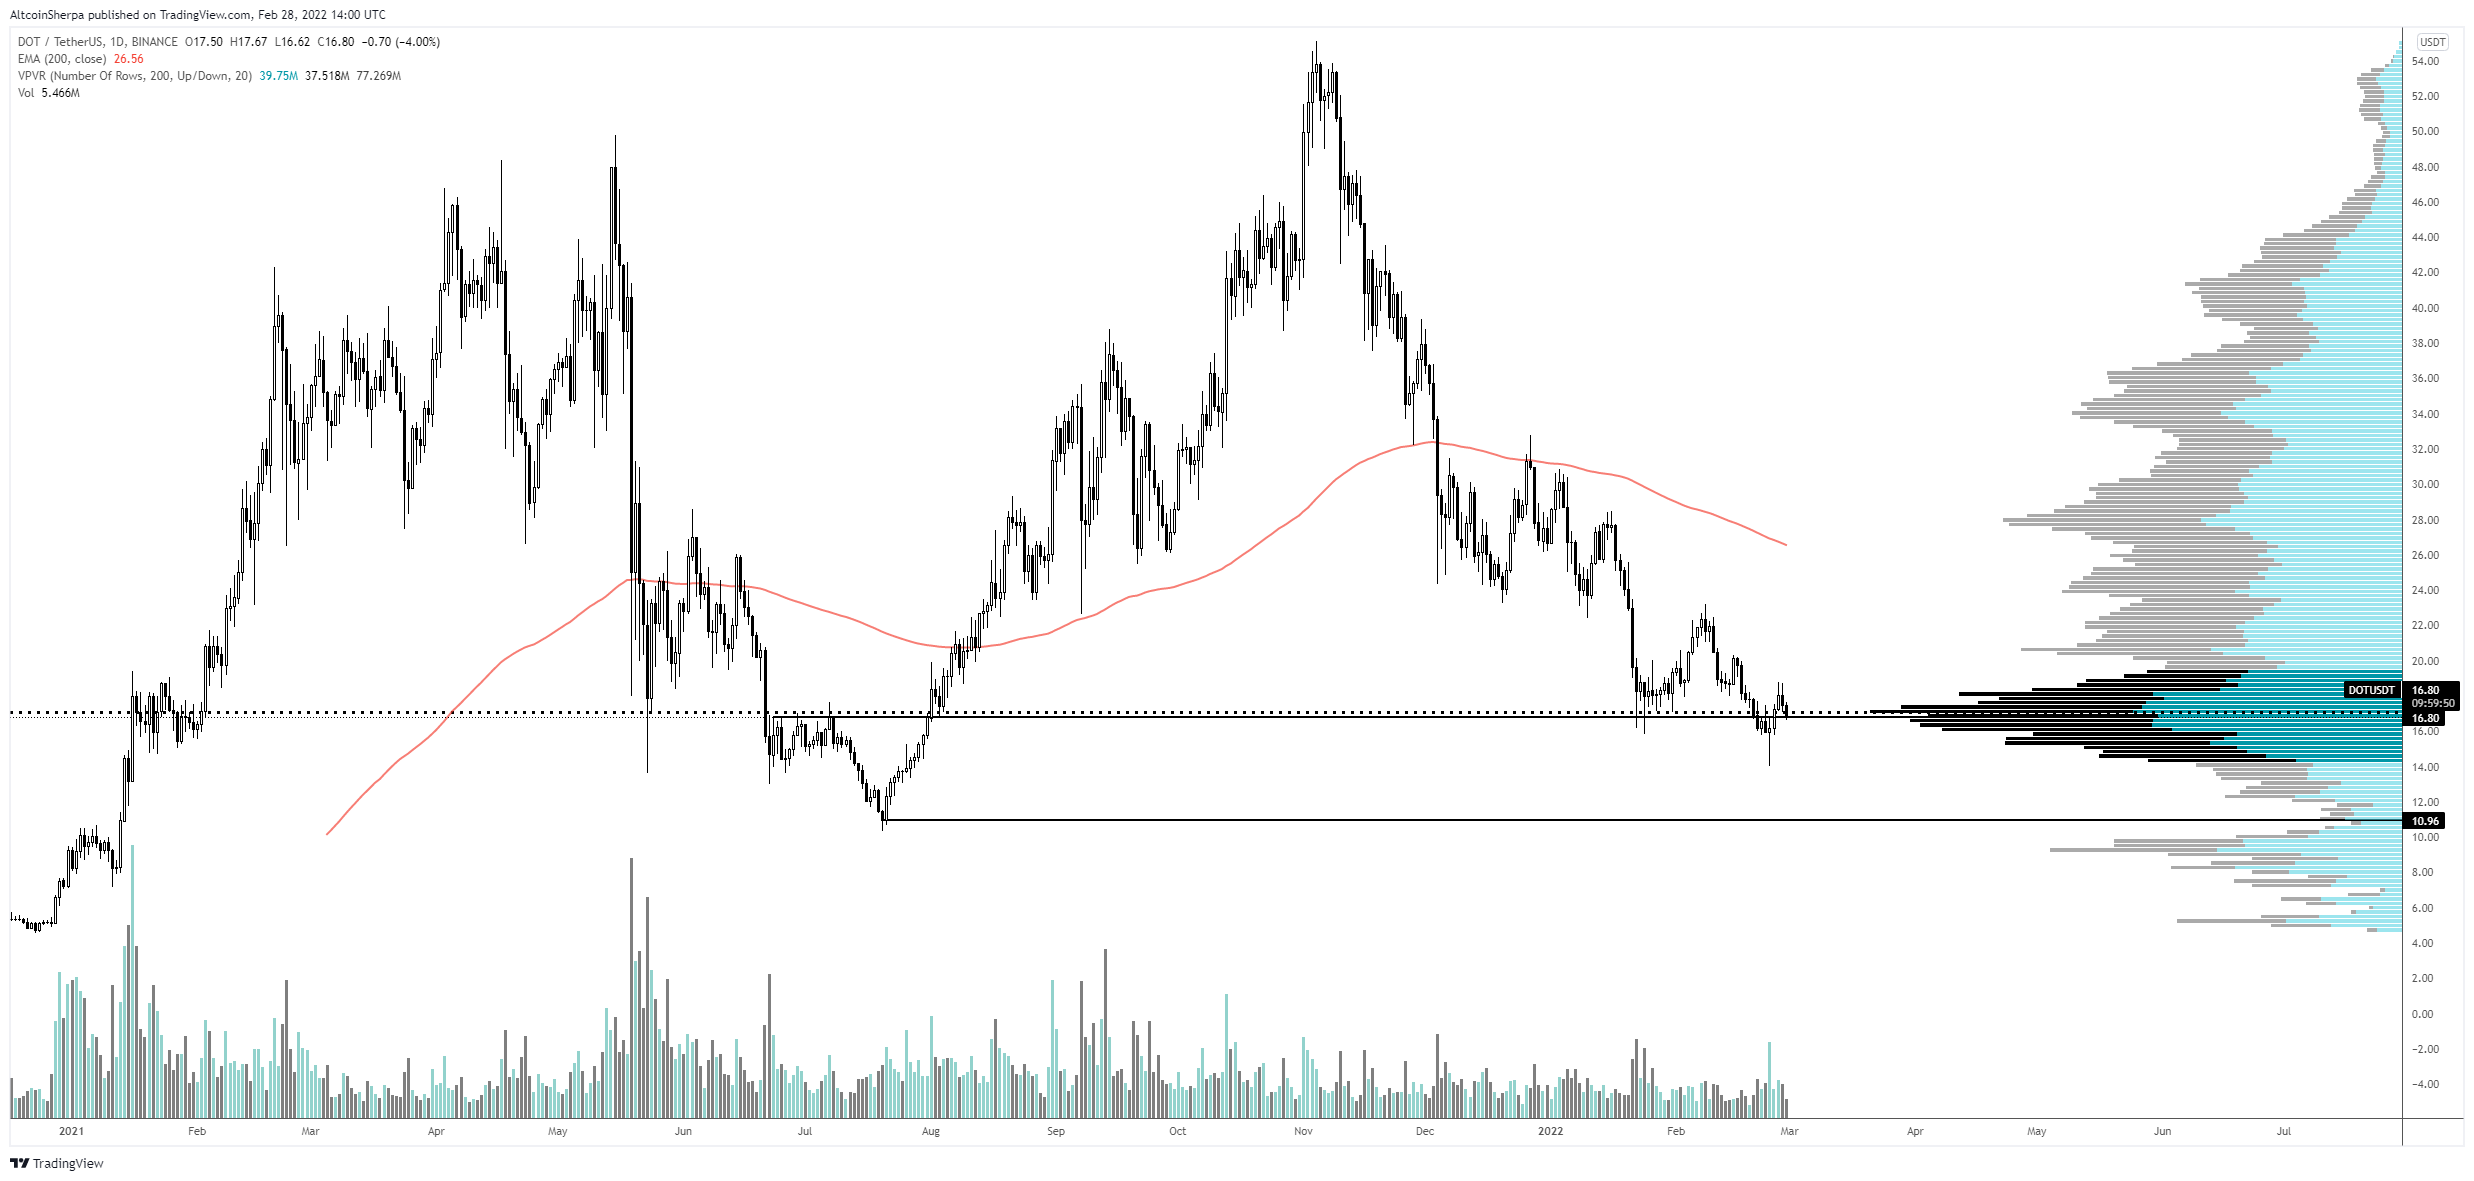
Cryptocurrency trader @AltcoinSherpa tweeted a chart of DOT, stating that the current support area could provide a bounce.
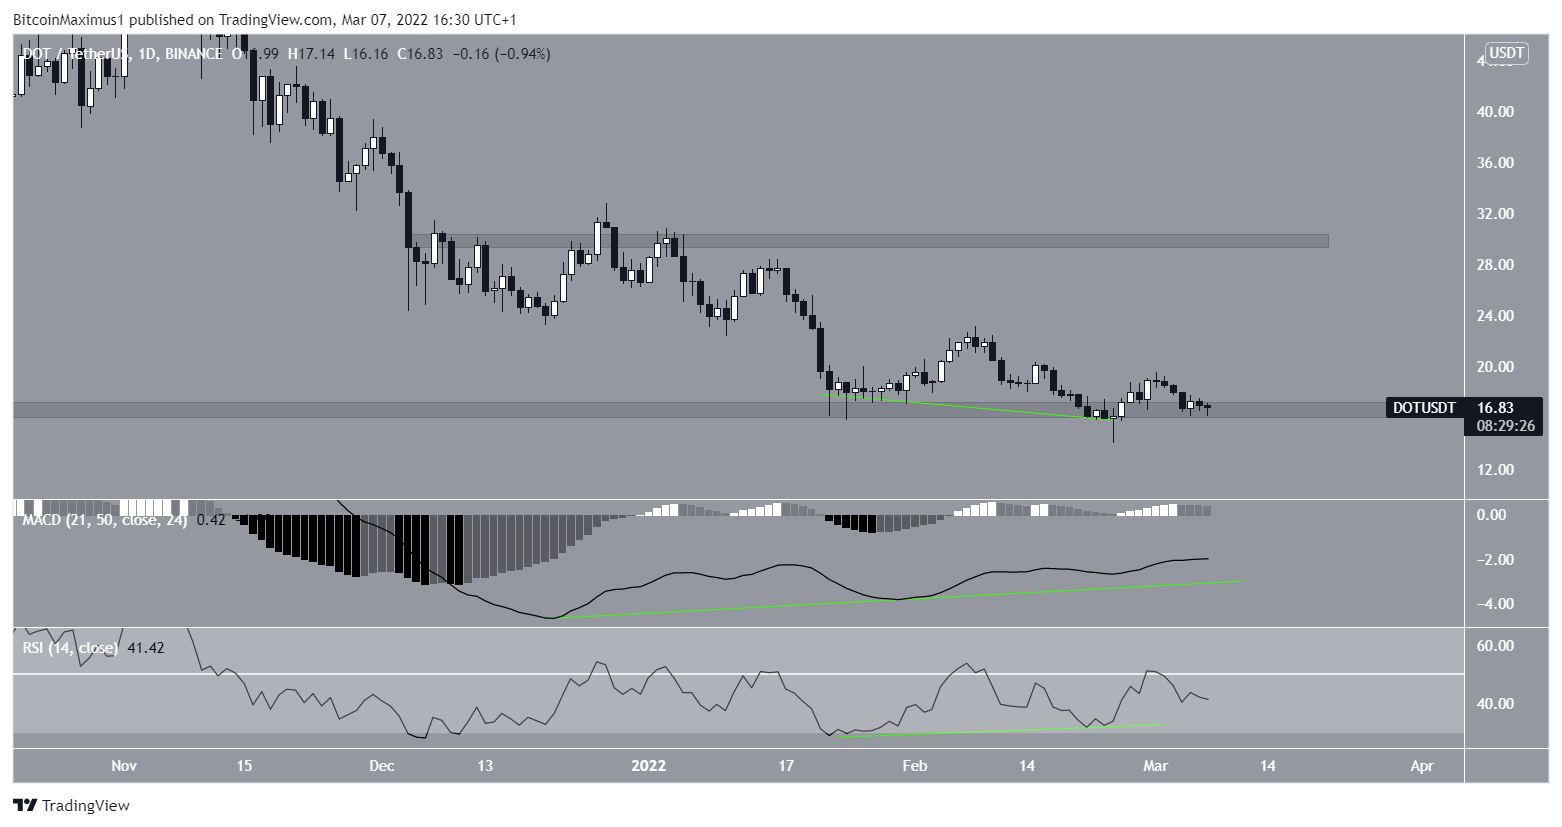
The daily time-frame readings do suggest that a bounce is likely. However, they do not confirm the bullish trend yet.
The reason for this is that while both the MACD and RSI have generated significant bullish divergences, neither has moved into bullish territory. In the case of the MACD, an increase above 0 is required, while in that of the RSI, and increase above 50 would be necessary.
Until these occur, the DOT trend cannot be considered bullish, despite the possibility of a significant bounce.
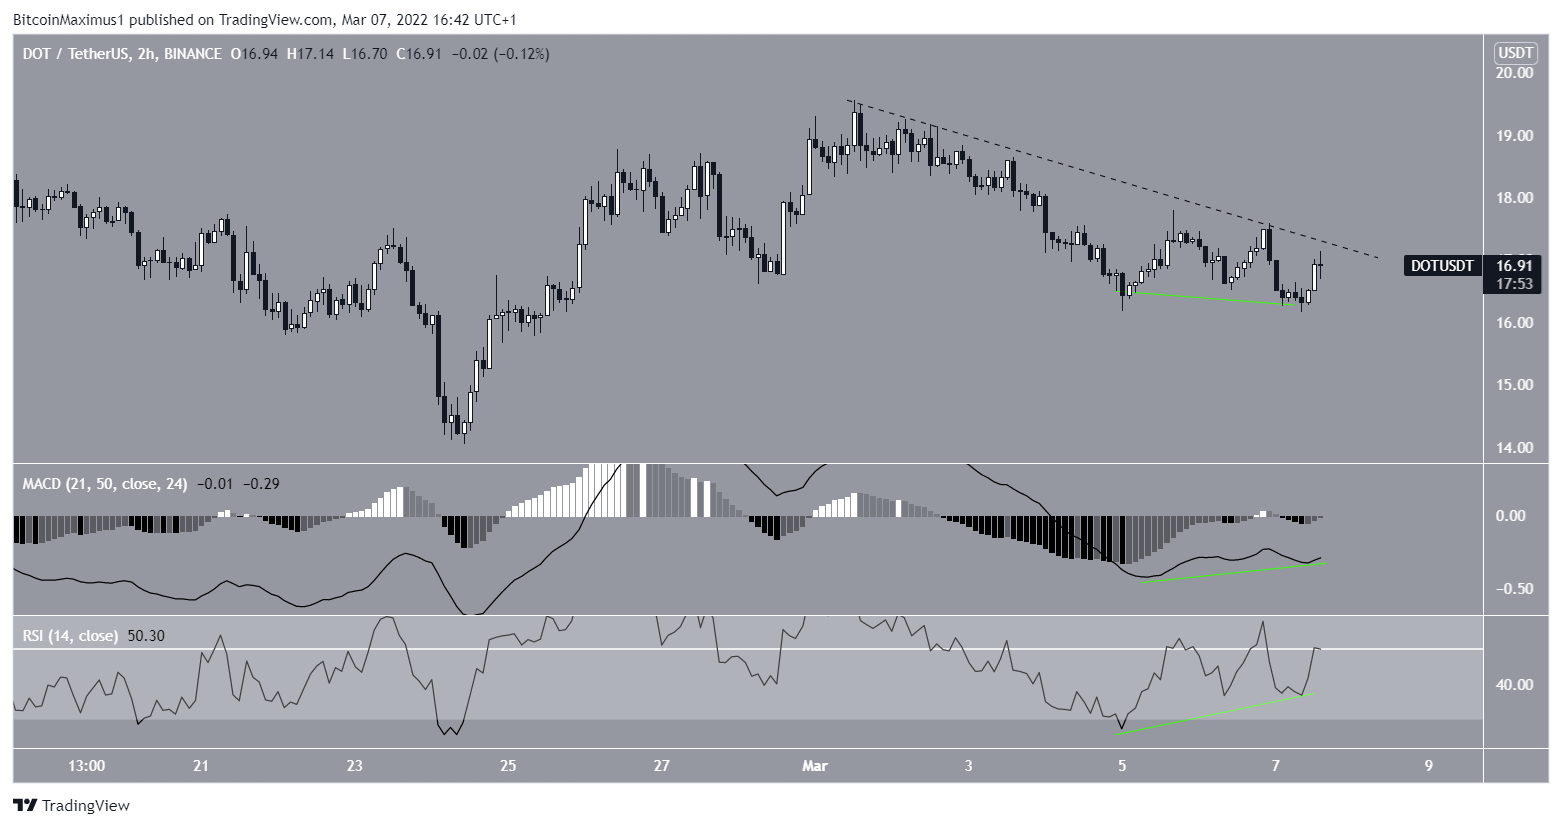
The two-hour chart also supports the possibility of a bounce. Similarly to the daily one, both the RSI and MACD have generated significant bullish divergences.
Once DOT breaks out from its short-term descending resistance line (dashed), the rate of increase is expected to accelerate.
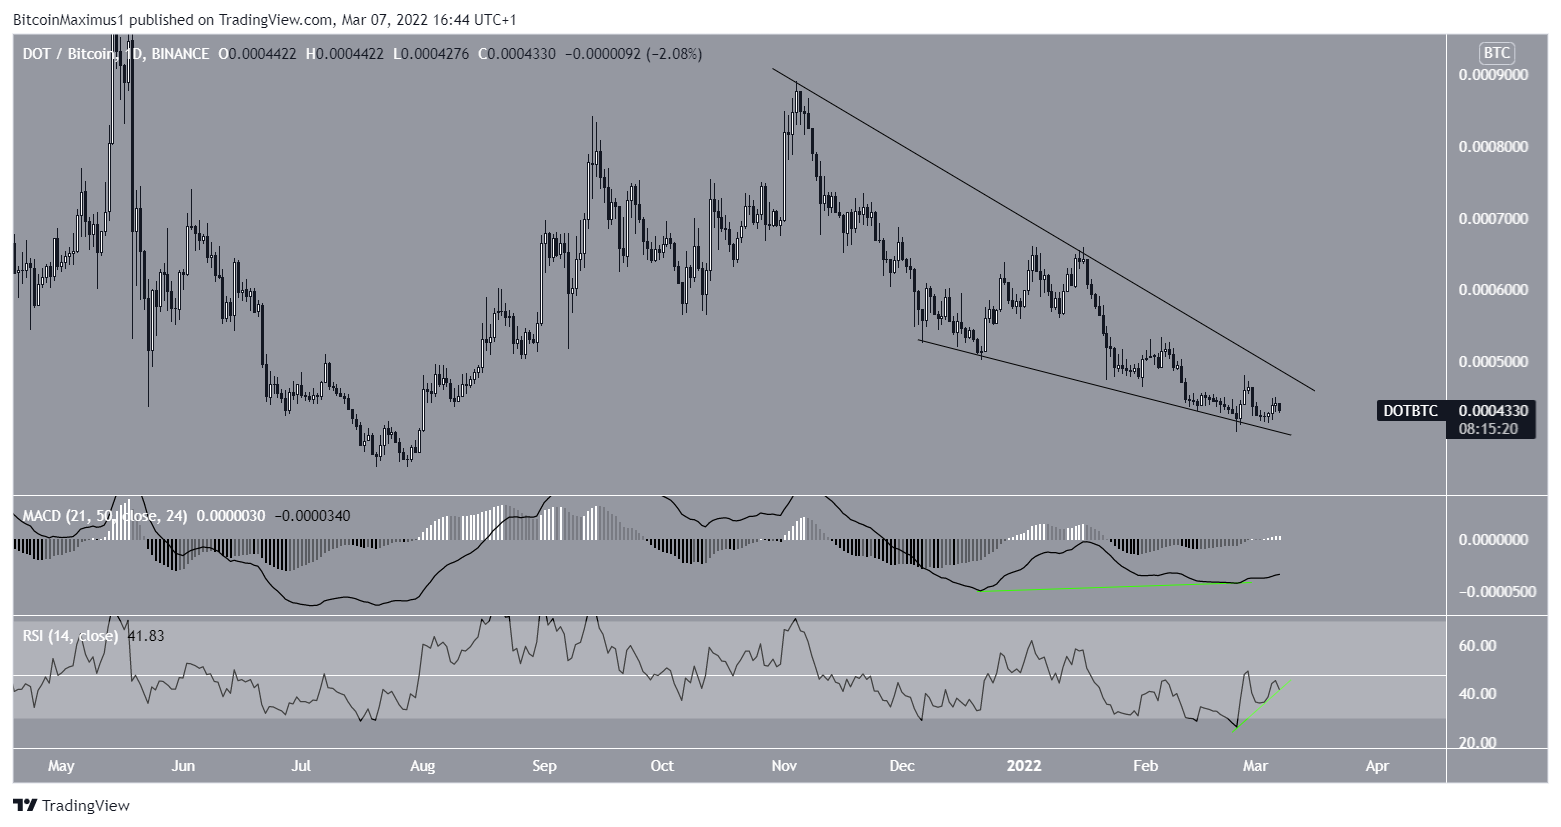
DOT/BTC
The DOT/BTC chart shows that the price has been trading inside a descending wedge since Oct 2021. The wedge is considered a bullish pattern.
Furthermore, similarly to the USD pair, both the RSI and MACD have generated considerable bullish divergences.
Therefore, it is possible that a considerable bounce and breakout from the wedge will follow soon.
For BeInCrypto’s latest Bitcoin (BTC) analysis, click here


