
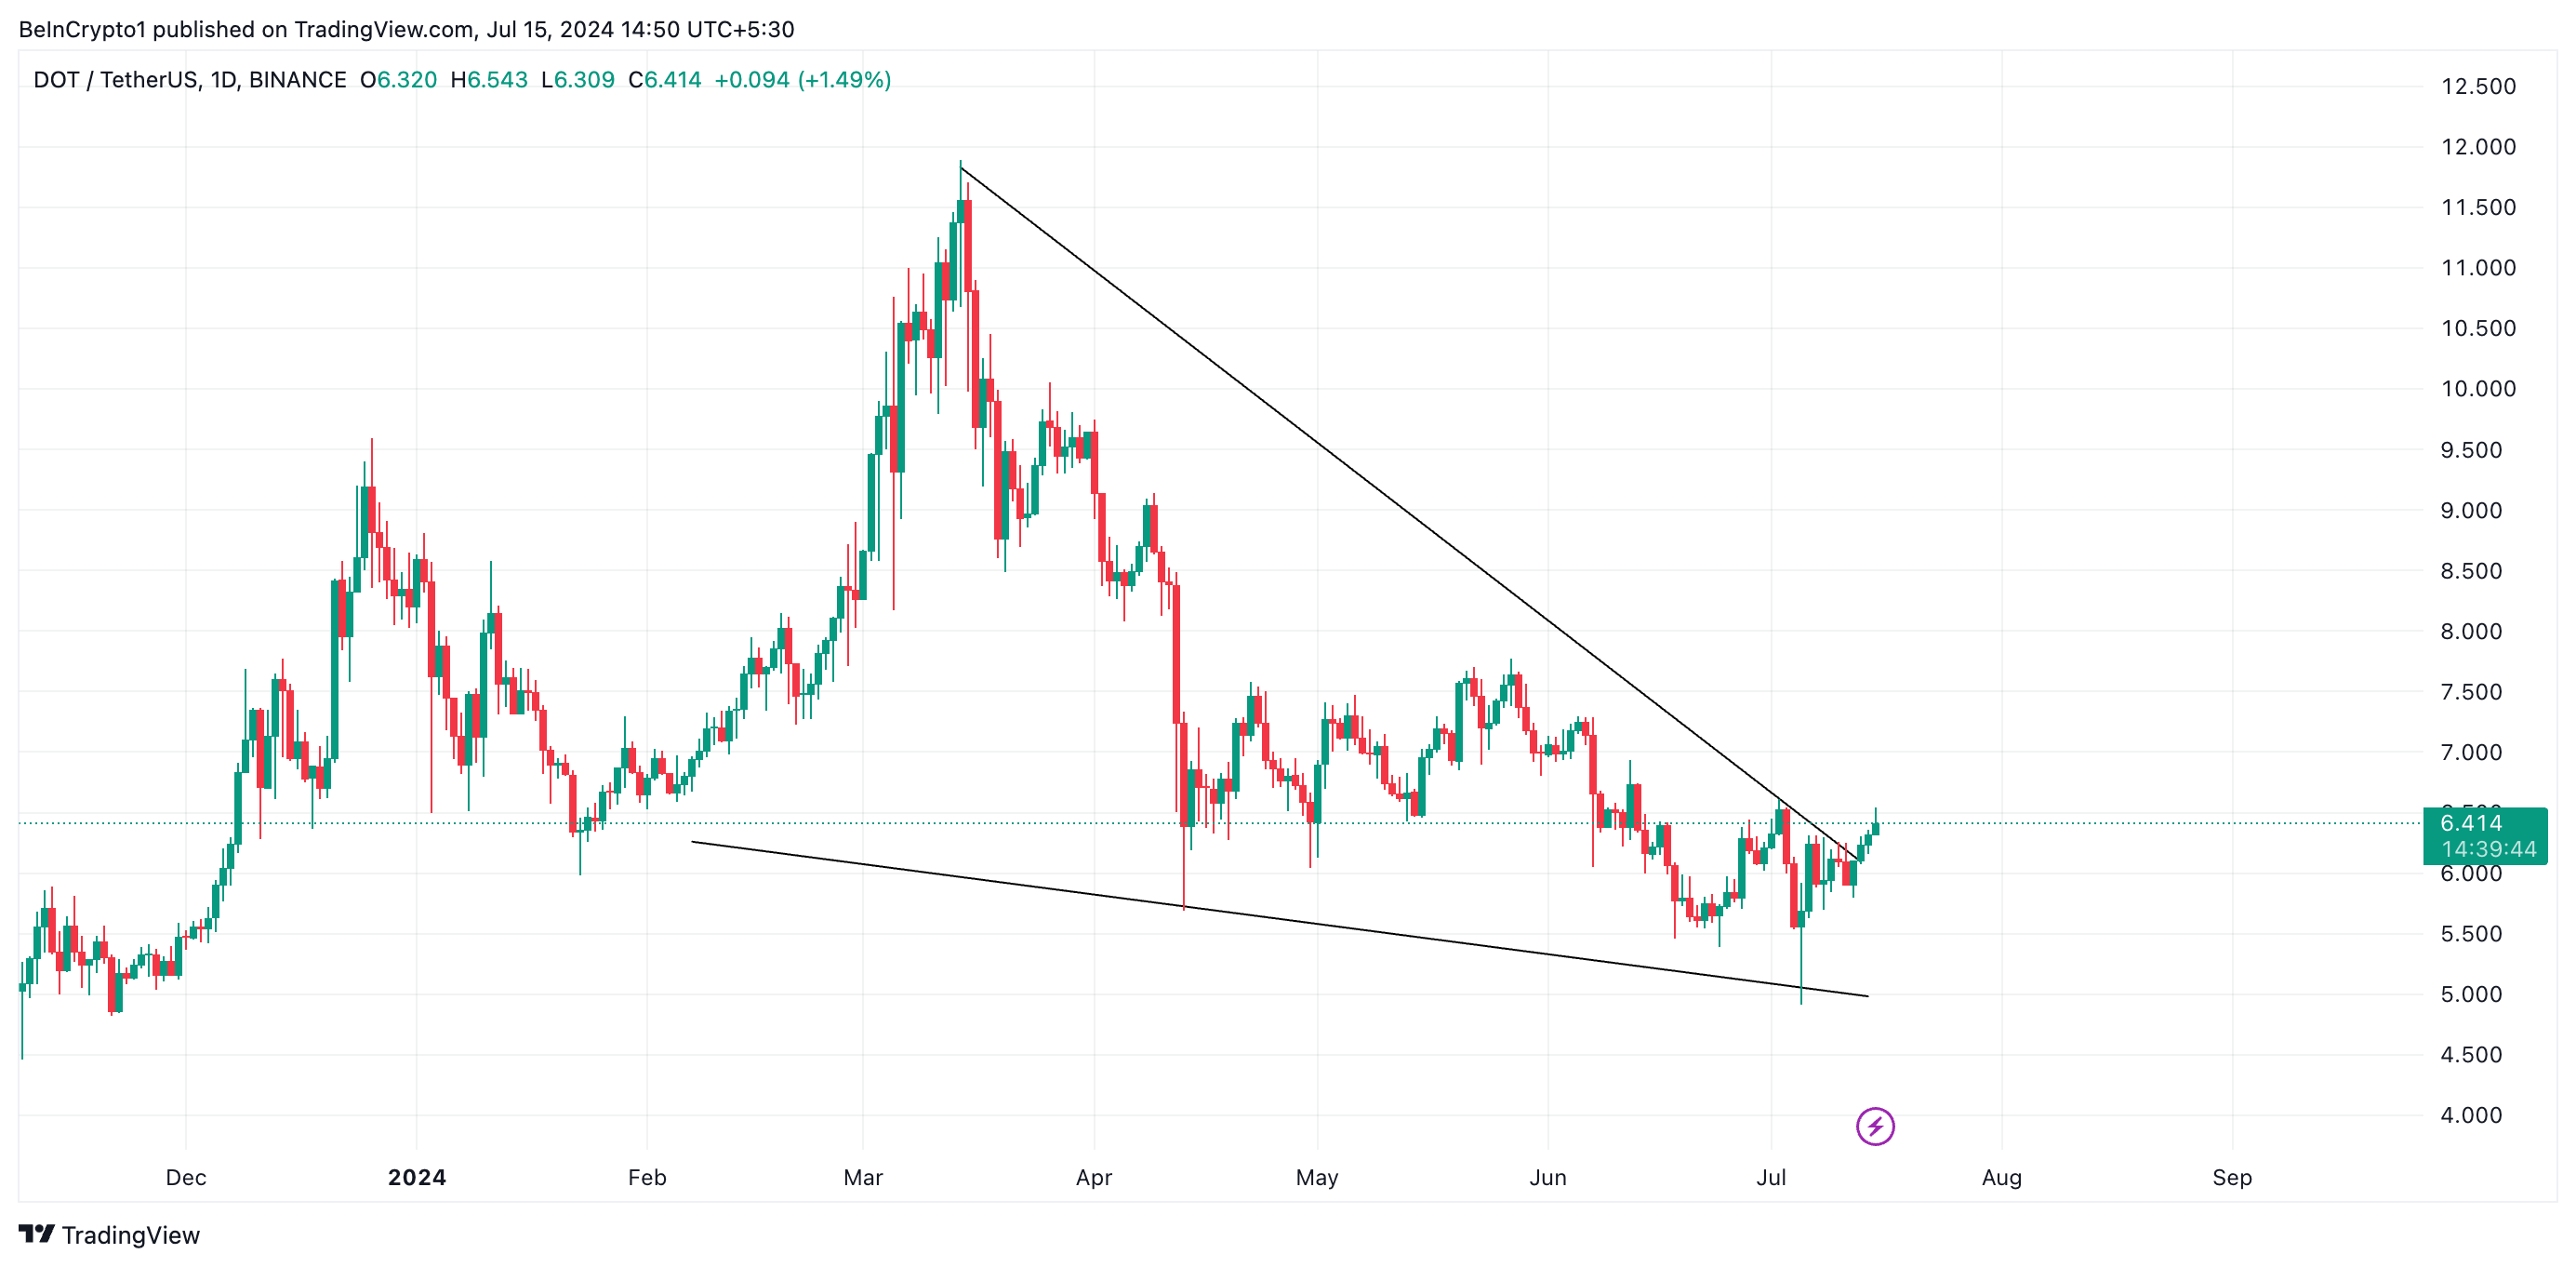
Polkadot’s (DOT) price rally in the past week has caused it to break out of the falling wedge pattern within which it has trended since March.
As of this writing, the altcoin is trading at $6.47, marking its highest price point in seven days.
Polkadot Gets Support From the Bulls
A falling wedge pattern is formed when an asset’s price trends between two downward-sloping trend lines. The upper trend line acts as a resistance level, while the lower trend line serves as support.
When a coin breaks out of the upper trendline of the falling wedge, it’s generally considered a bullish signal. This breakout suggests that buyers are overpowering sellers and that the price may be poised to trend upwards.
Polkadot broke out of this upper line on July 13 and has since maintained its uptrend.
Further, at press time, Polkadot’s Relative Strength Index (RSI) is in an uptrend at 57.81, confirming the surge in buying pressure over selling activity.
Read More: What Is Polkadot (DOT)?
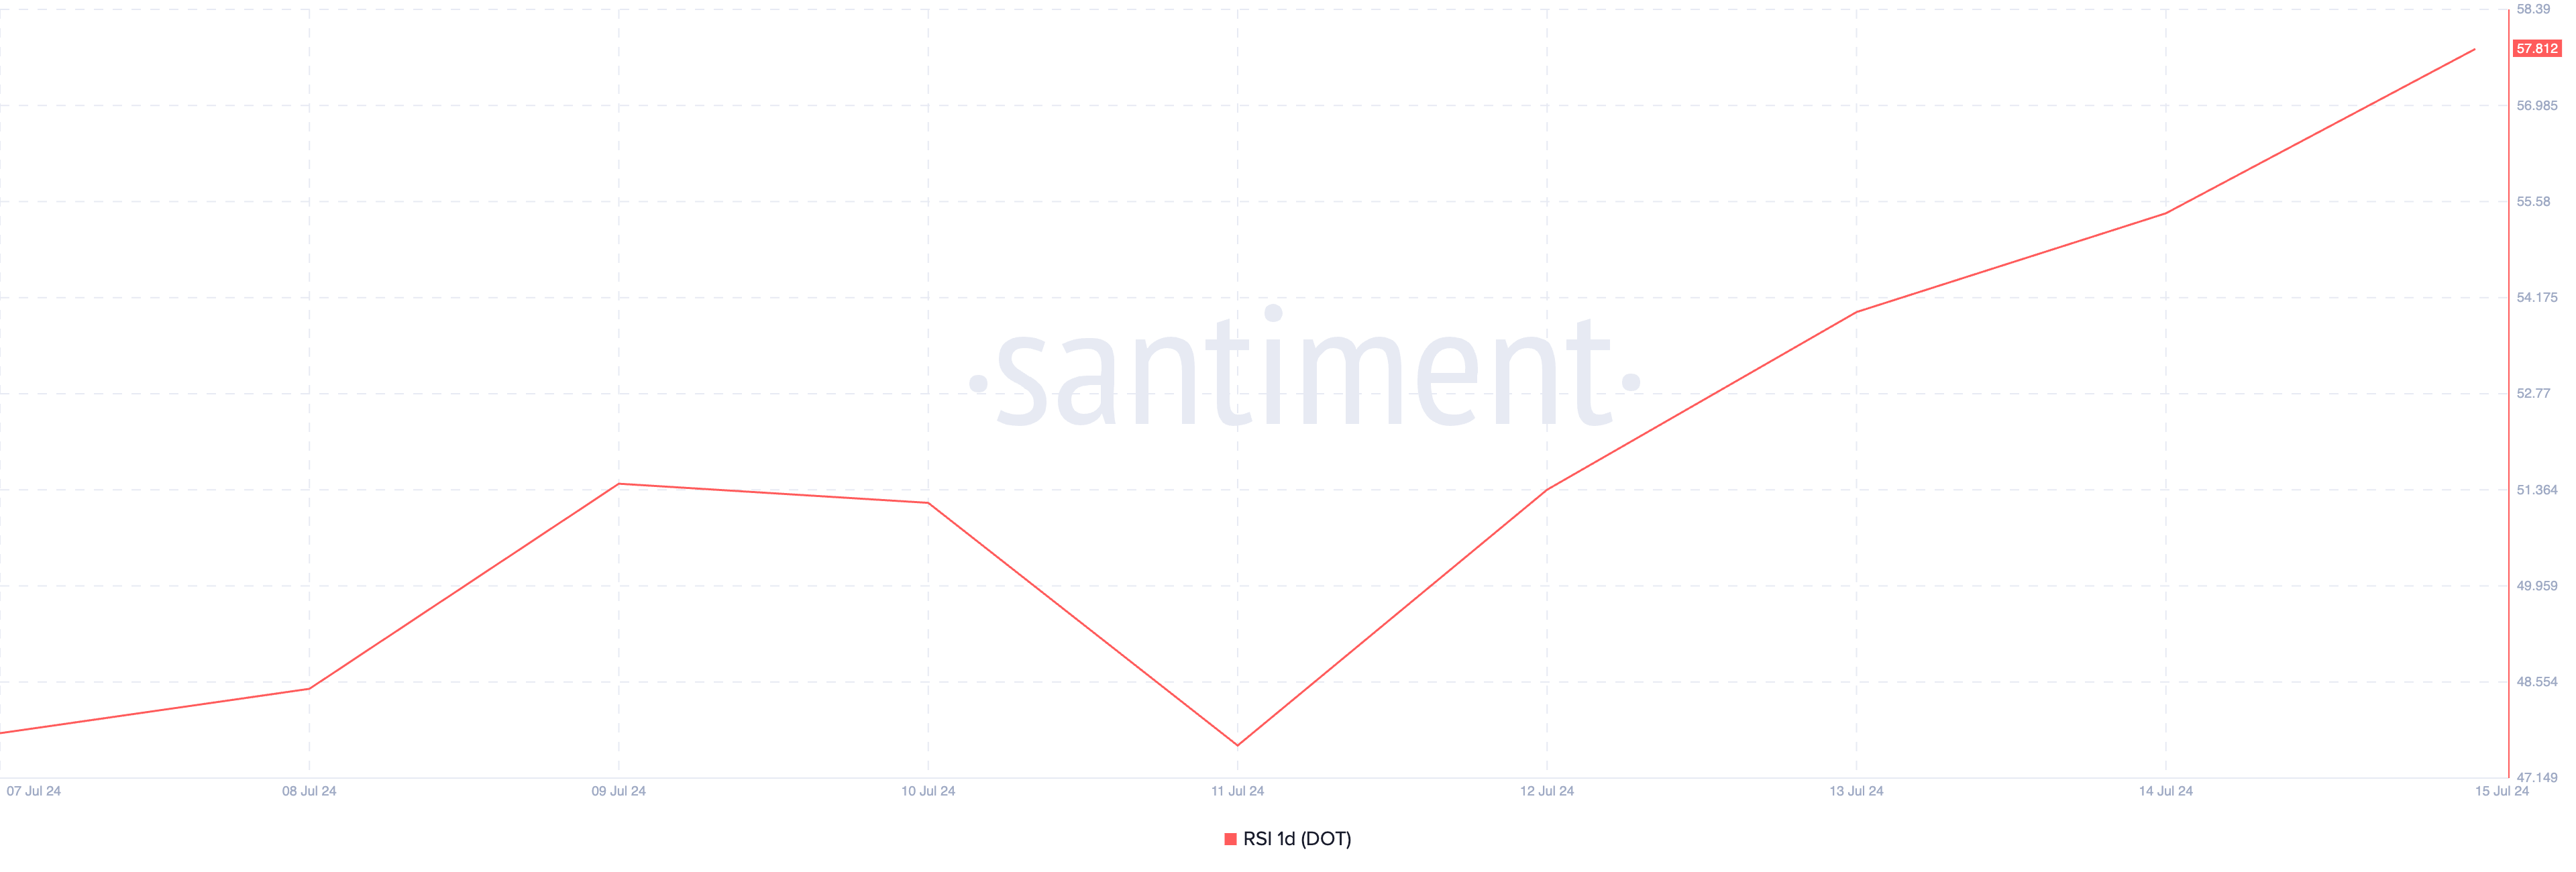
This indicator measures an asset’s overbought and oversold conditions. It ranges between 0 and 100, with values above 70 suggesting that the asset is overbought and due for a price decline, while values below 30 indicate that the asset is oversold and may be due for a rebound.
At 57.81, DOT’s rising RSI signals a steady surge in buying activity.
DOT Price Prediction: Rise Above $6.50 Next?
The bullish bias toward DOT has surged since July 11. This can be gleaned from the setup of its Parabolic Stop and Reverse (SAR) Indicator observed on a one-day chart.
Since July 11, this indicator’s dots have been positioned below DOT’s price. This comes after a month-long period of being above the altcoin’s price.
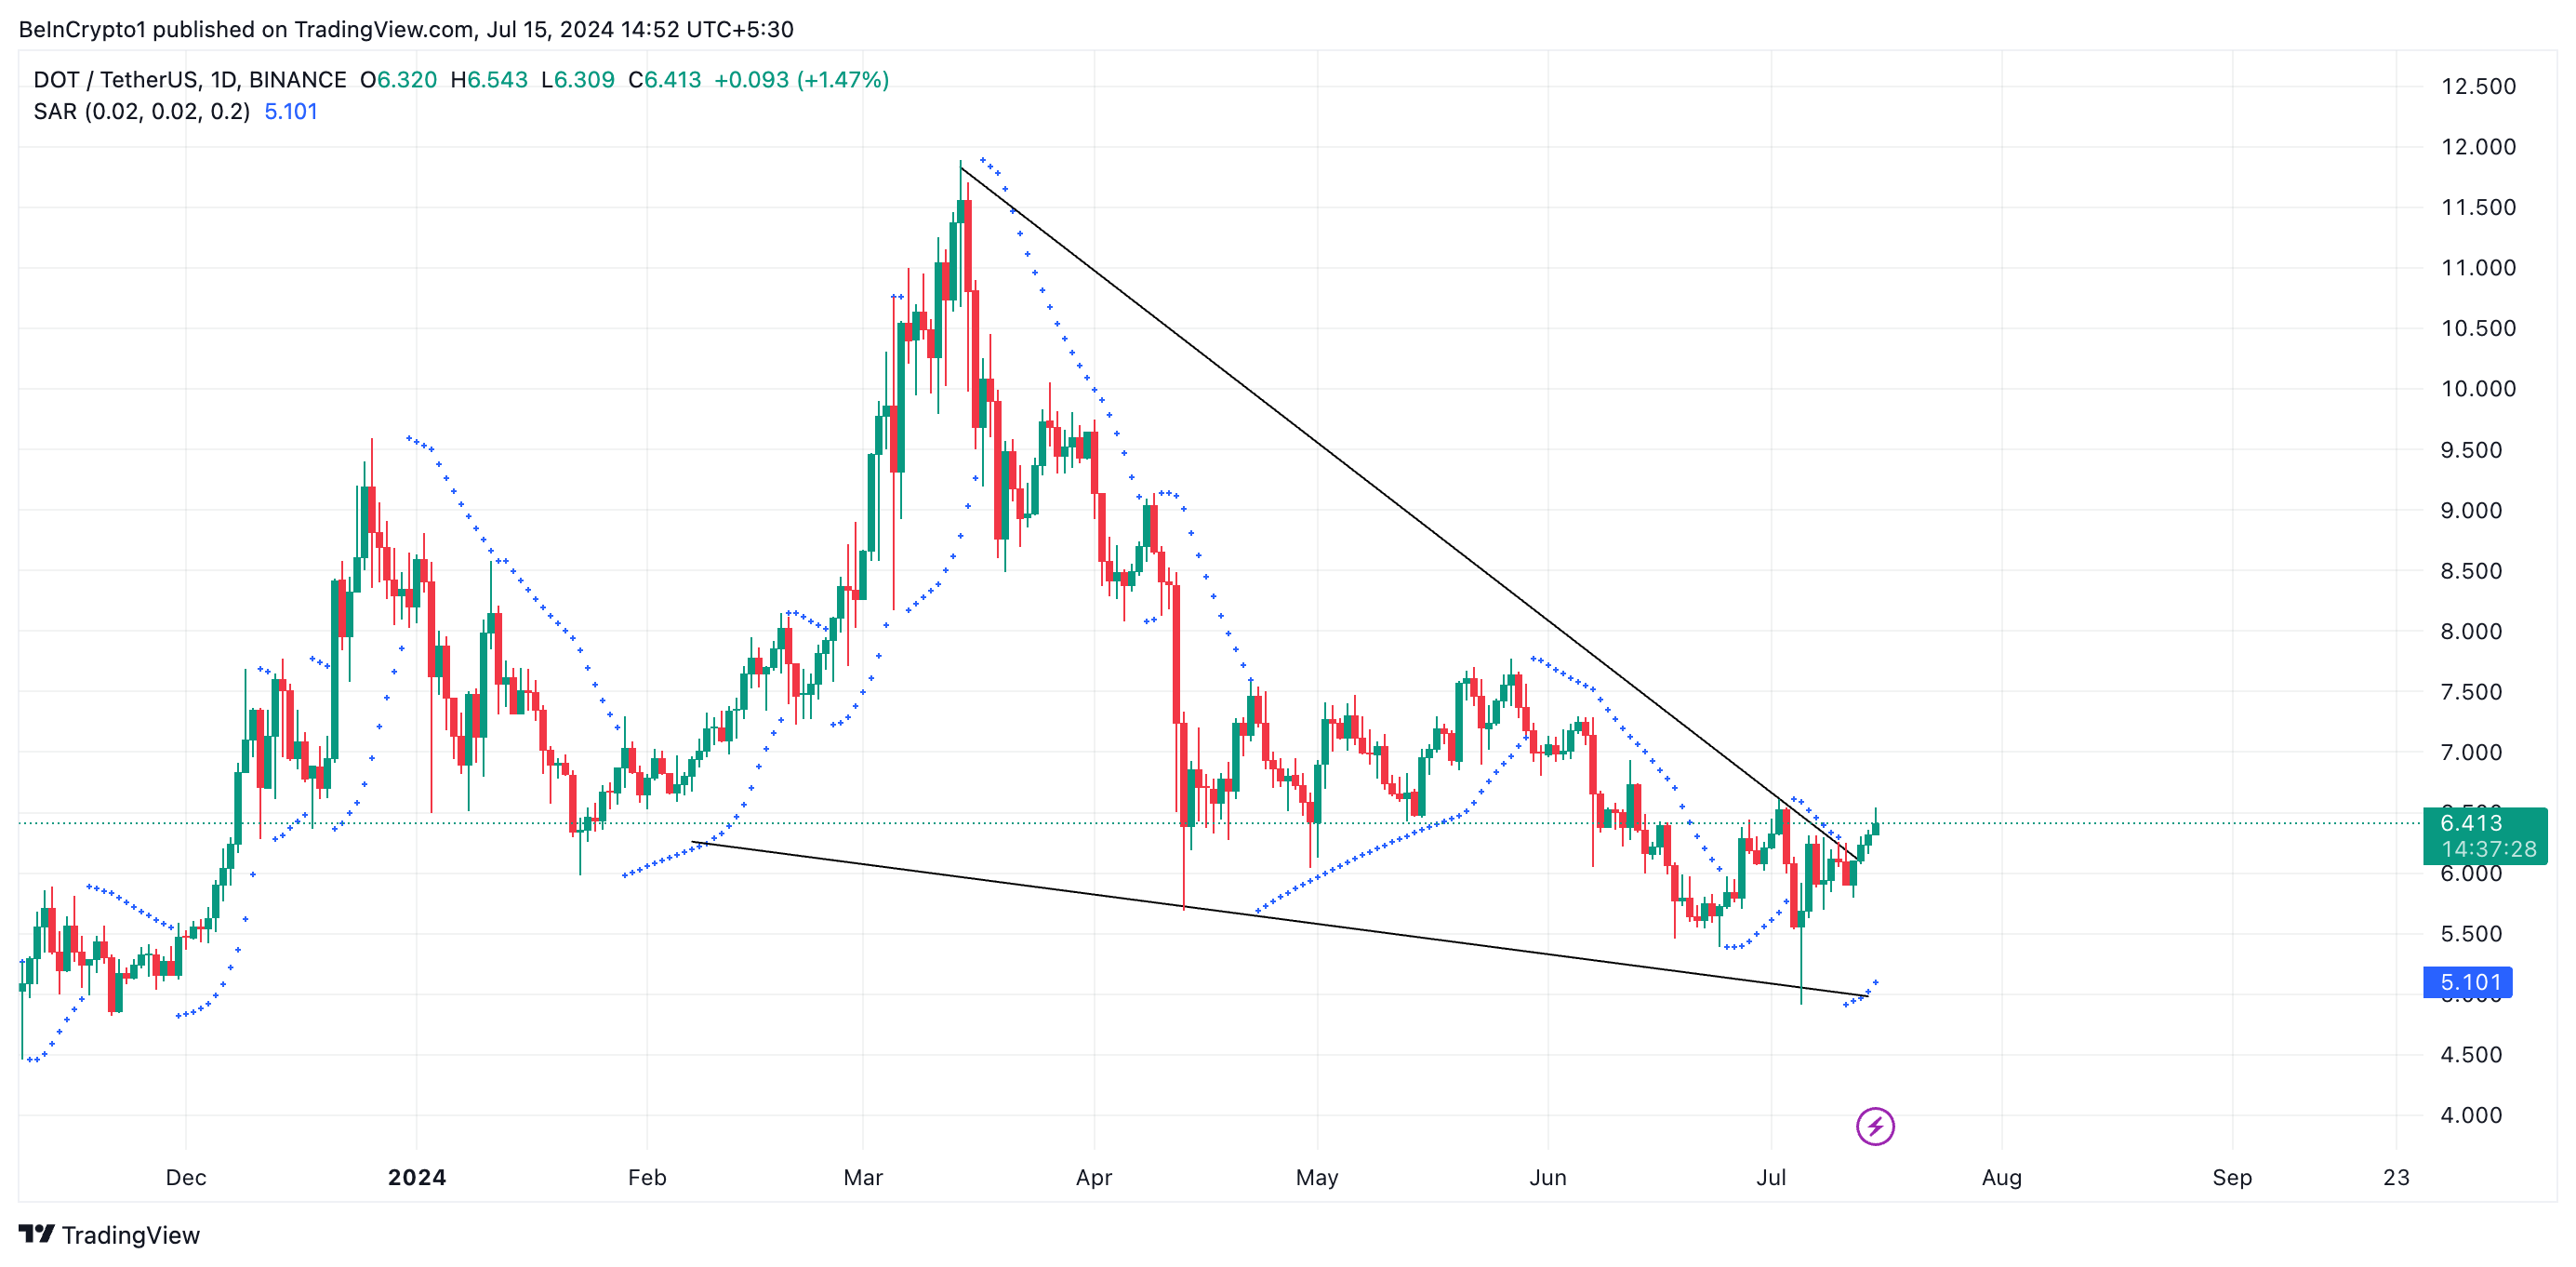
An asset’s Parabolic SAR indicator measures its trend direction and identifies potential reversal points.
When the dots of this indicator are positioned below the price, it indicates an uptrend. This suggests that the asset’s price is likely to continue rising. Traders often interpret this as a signal to hold long positions or consider entering new long positions, as the market is currently bullish.
Conversely, when the dots lie above the price, it indicates that the asset’s price is likely to continue falling. It is seen as a bearish signal to consider entering new short positions.
The bullish sentiment trailing DOT is confirmed with the dots of its Parabolic SAR indicator resting under its price. If the demand for the altcoin continues, it might rally to exchange hands above $6.57.
Read More: Polkadot (DOT) Price Prediction 2024/2025/2030
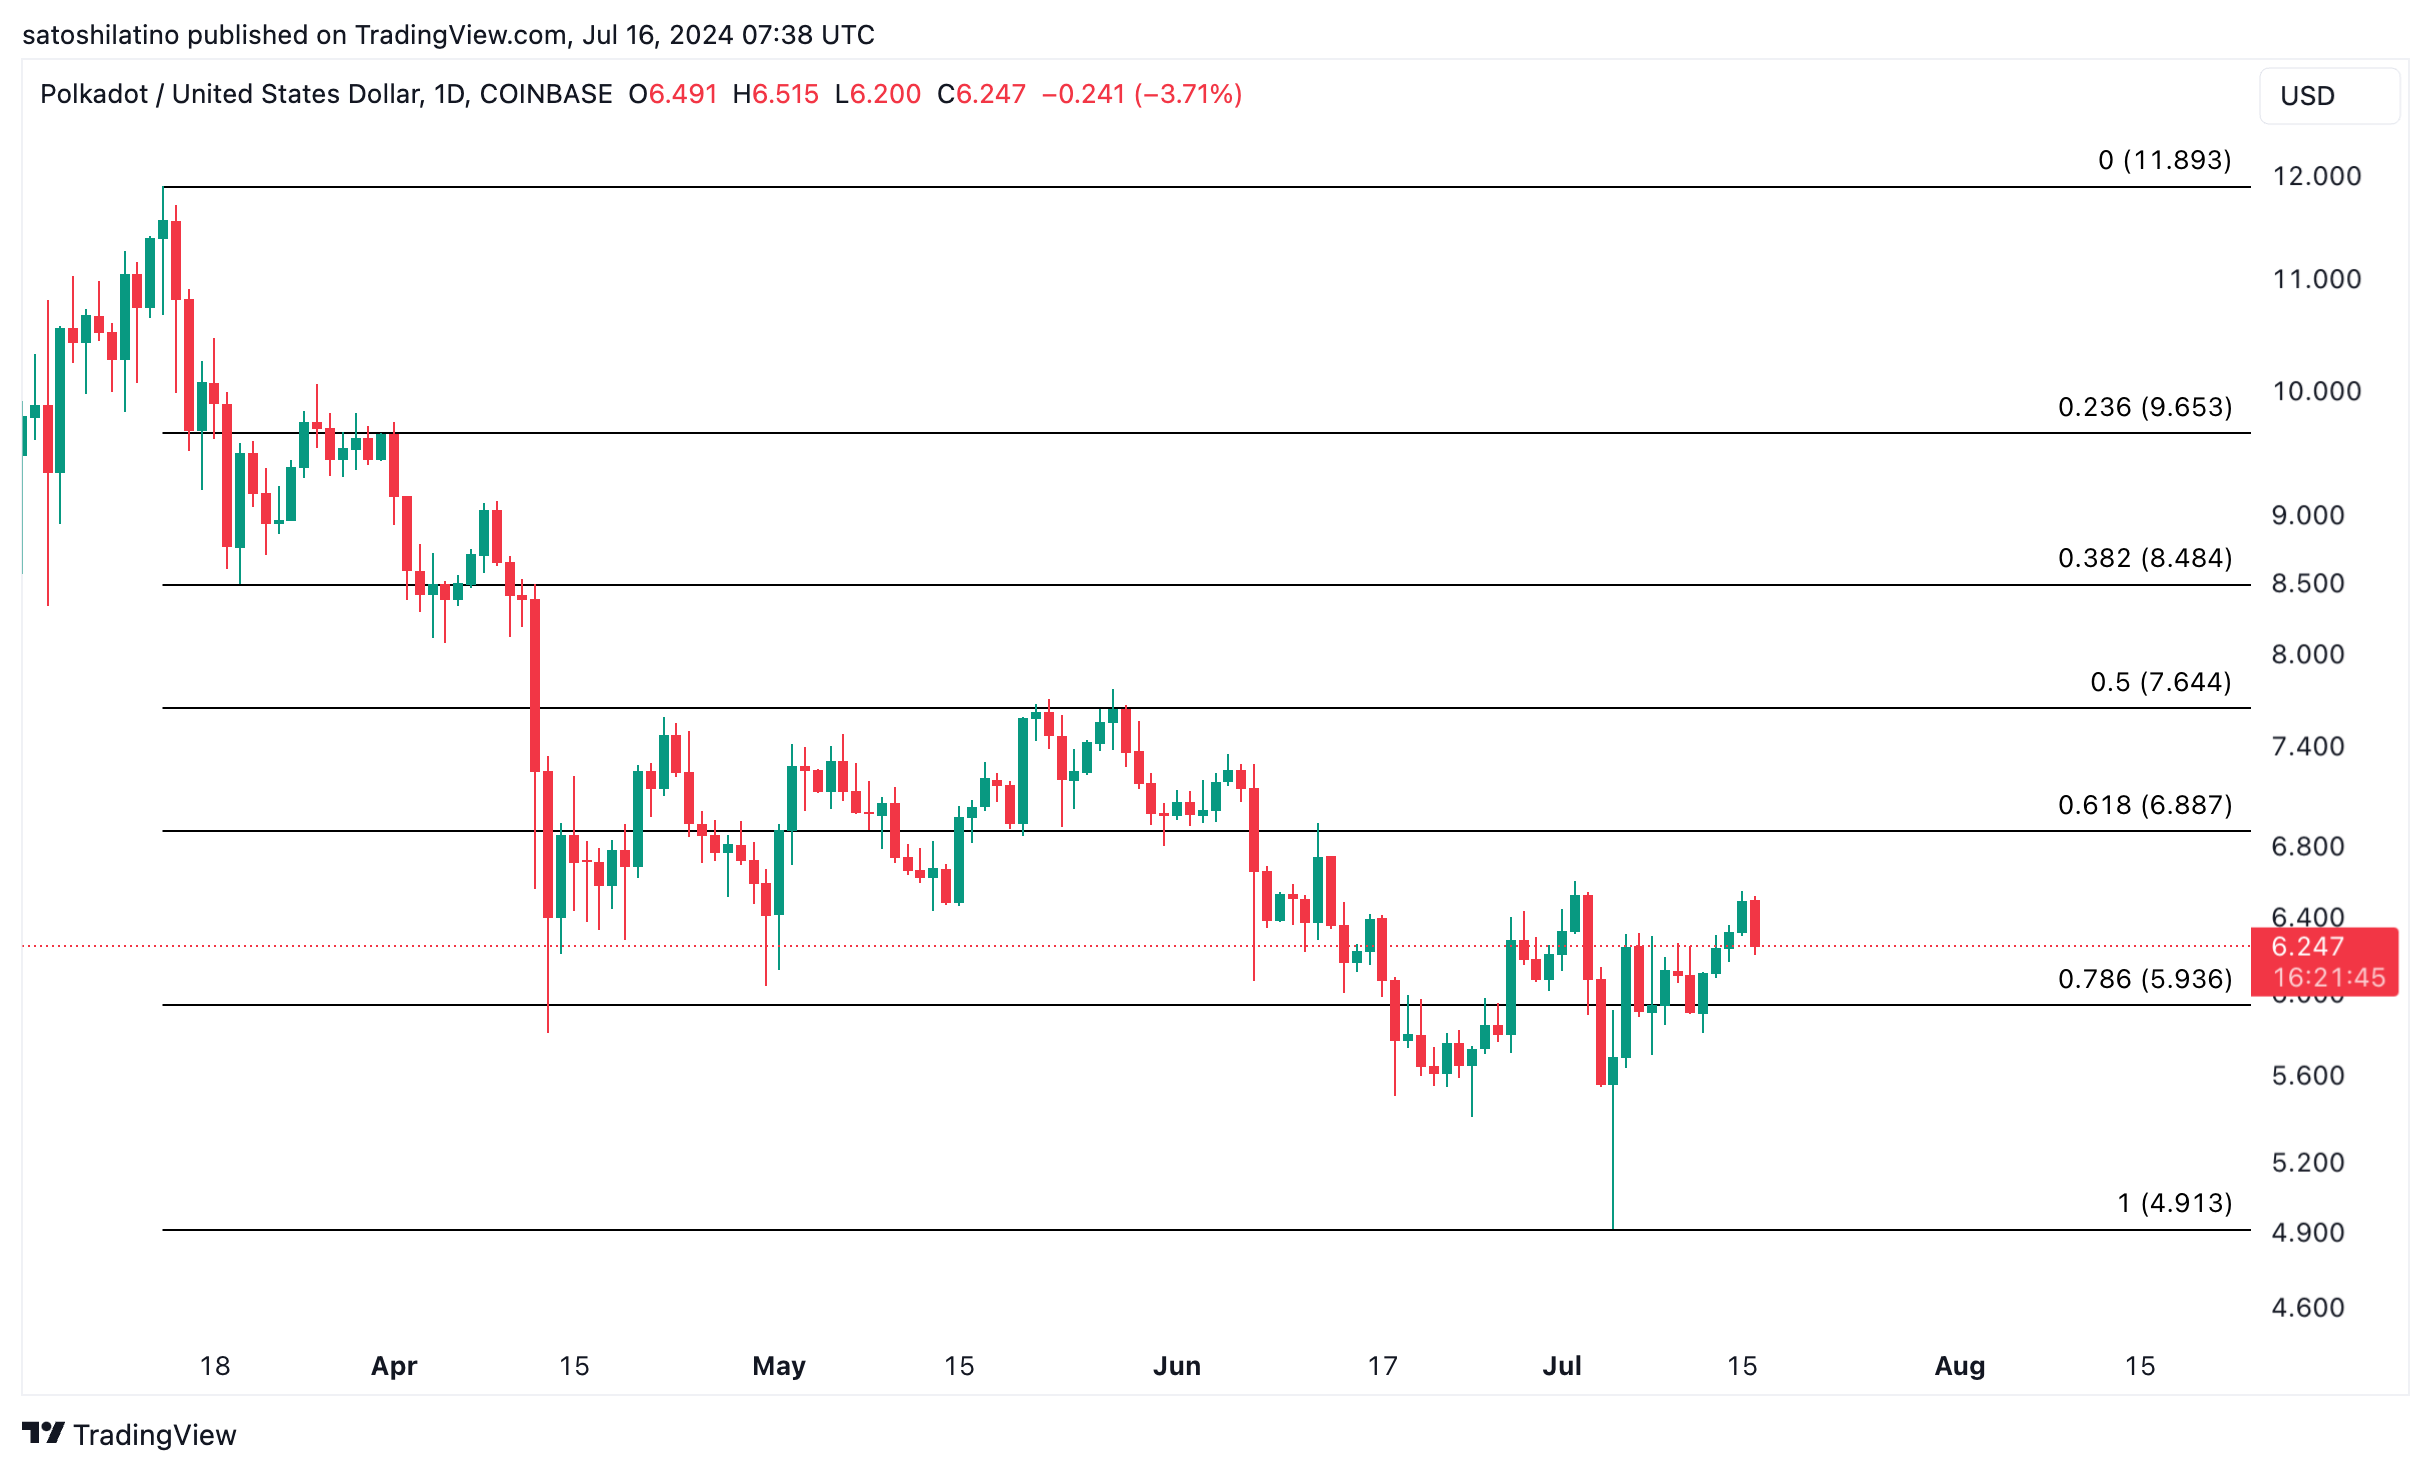
However, if the bullish trend loses momentum, the coin’s price might fall to $6.0.
