Trusted

PI Plummets 50% in a Week – Why Traders Should Brace for More Downside

2 mins
Updated by Ann Maria Shibu
Join our Trading Community on Telegram

In Brief

  • PI’s value dropped 56% in a week, hitting $0.73 from $1.67, signaling growing bearish momentum among traders.
  • Negative BBTrend and Elder-Ray Index indicate sustained selling pressure and dominance of bearish forces.
  • Trading below the 20-day EMA shows weak short-term momentum; a fall to $0.55 or rebound to $1.01 depends on buying pressure.
  • promo

PI has shed half its value over the past seven days, signaling deepening bearish sentiment among its holders. At the time of writing, the altcoin trades at $0.72, marking a steep decline from last week’s price high of $1.67.

Technical indicators suggest that the downtrend may not be over as selling pressure remains significant.  

PI Faces Heavy Selling Pressure

PI’s BBTrend remains in the red on the daily chart, confirming that bearish forces are firmly in control. Observed on a one-day chart, the indicator is currently at -19.36.

PI BBTrend
PI BBTrend. Source: TradingView

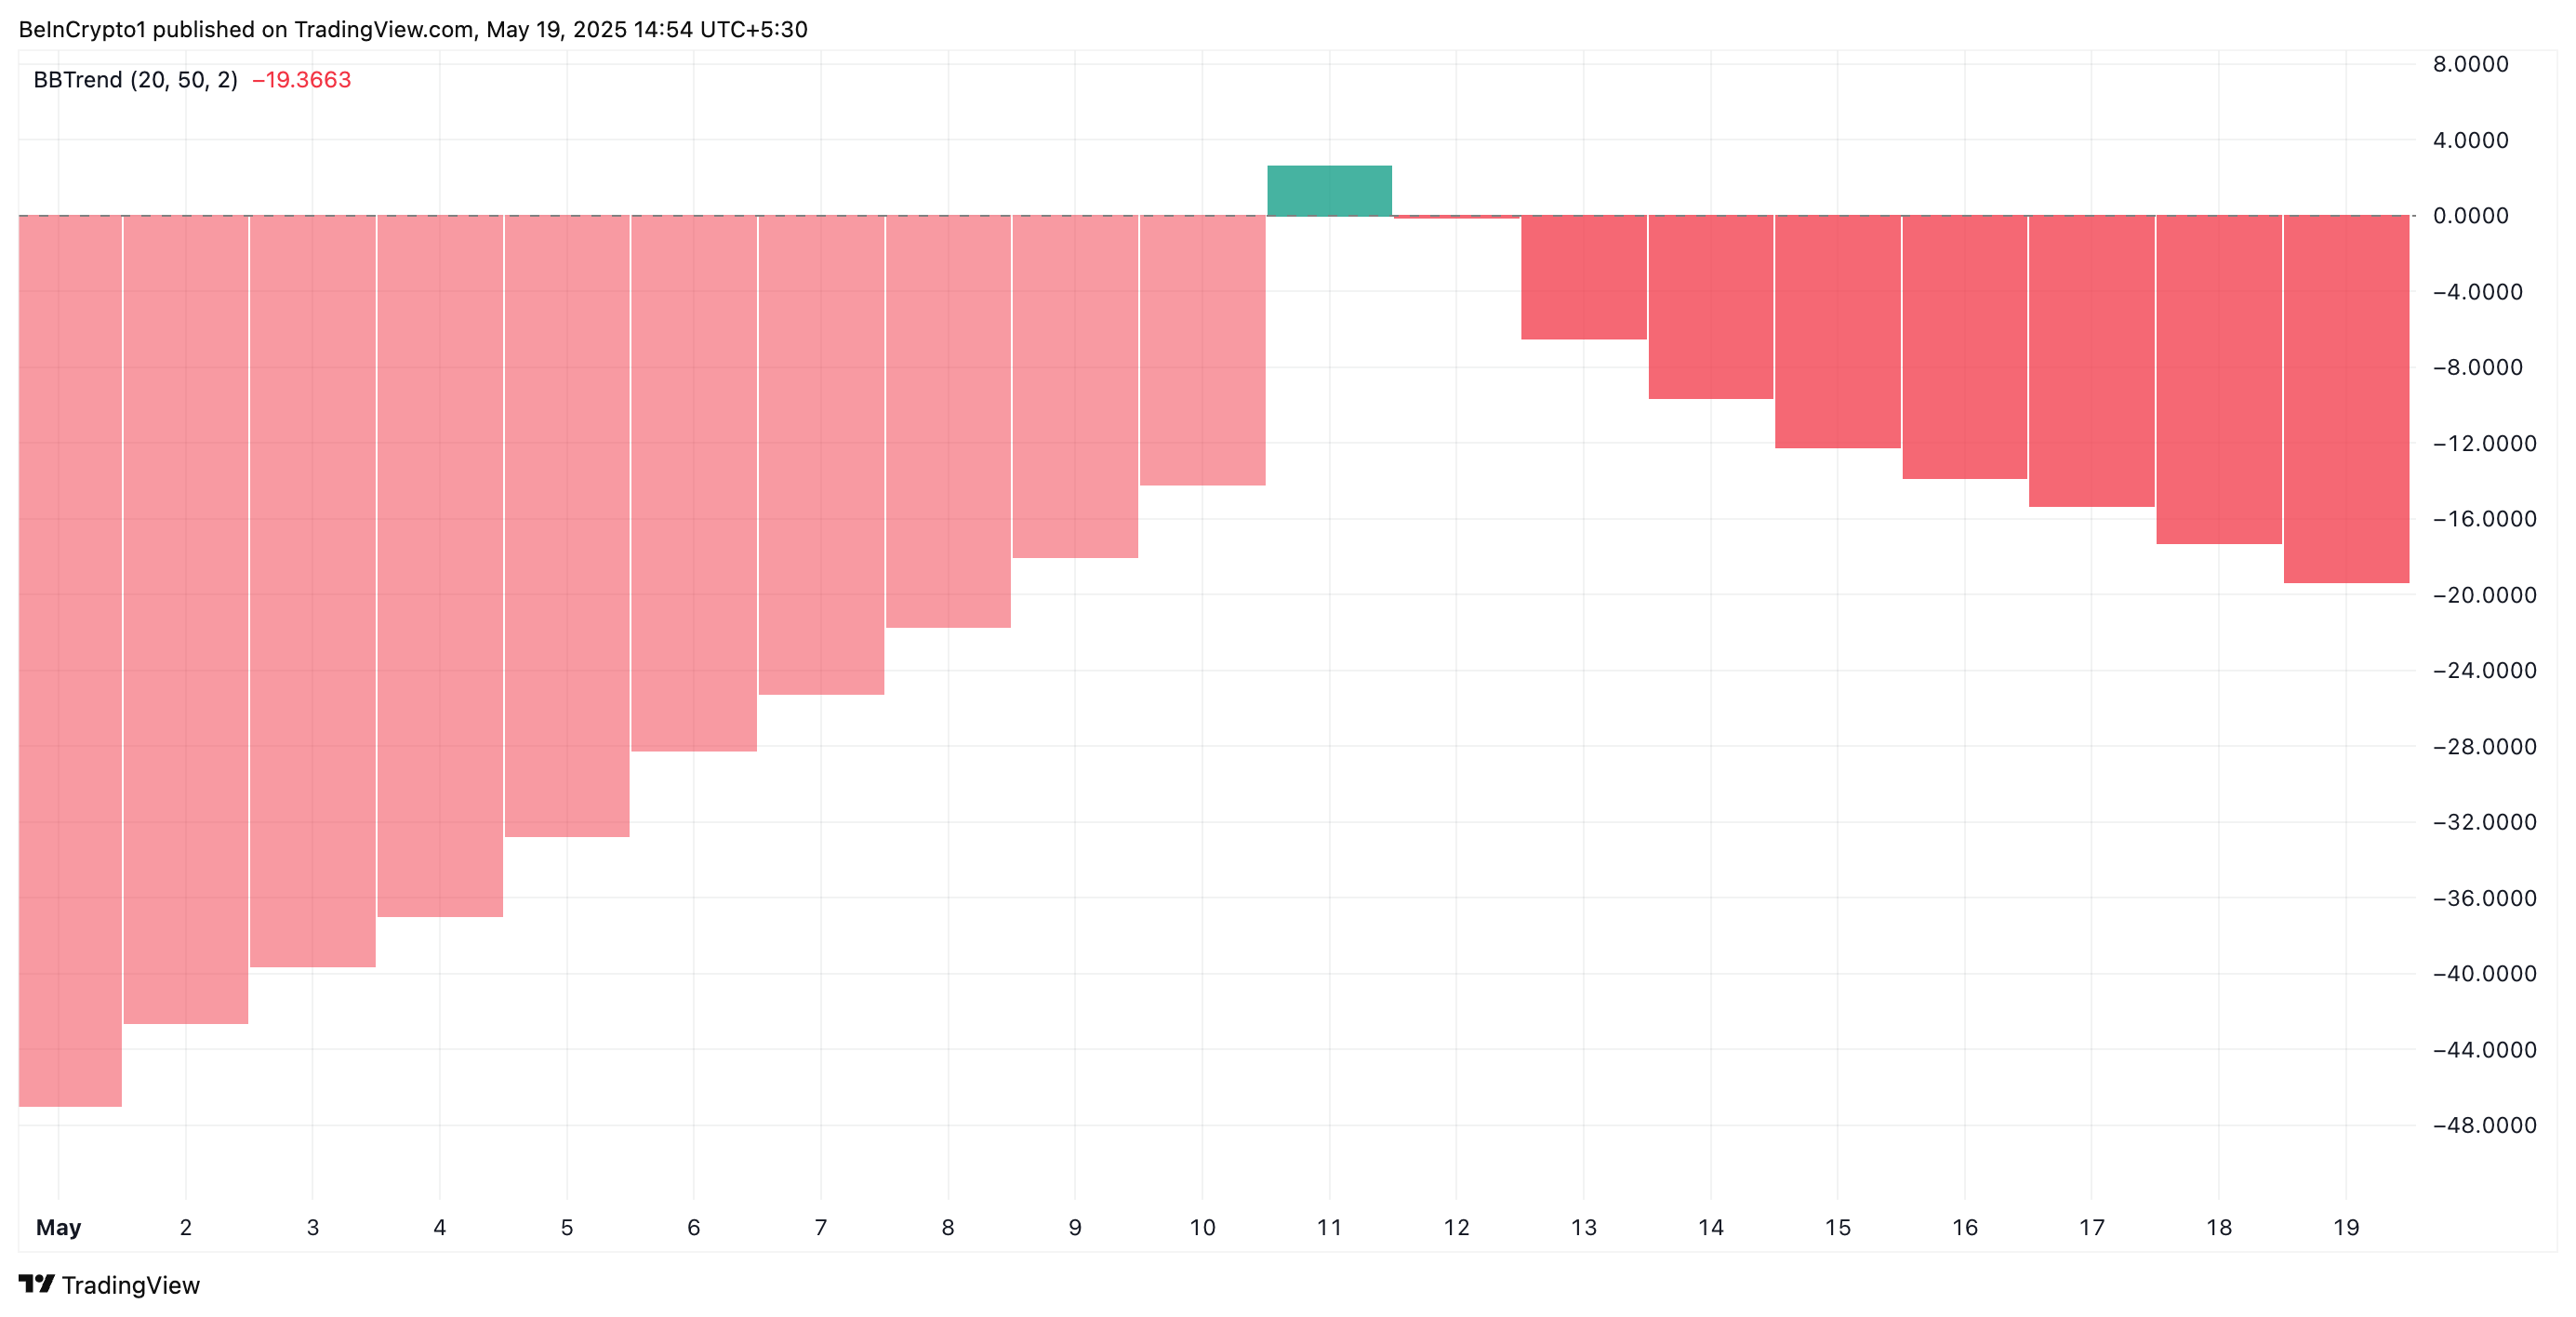
The BBTrend measures the strength and direction of a trend based on the expansion and contraction of Bollinger Bands. When BBTrend values are positive, it signals a strong uptrend, while negative values indicate increasing bearish momentum. 

PI’s negative BBTrend suggests that its price consistently closes near the lower Bollinger Band, reflecting sustained selling pressure and hinting at the potential for further downside.

Furthermore, the token’s Elder-Ray Index supports this bearish outlook. At press time, the indicator returns a negative value of -0.12.

PI Elder-Ray Index.
PI Elder-Ray Index. Source: TradingView

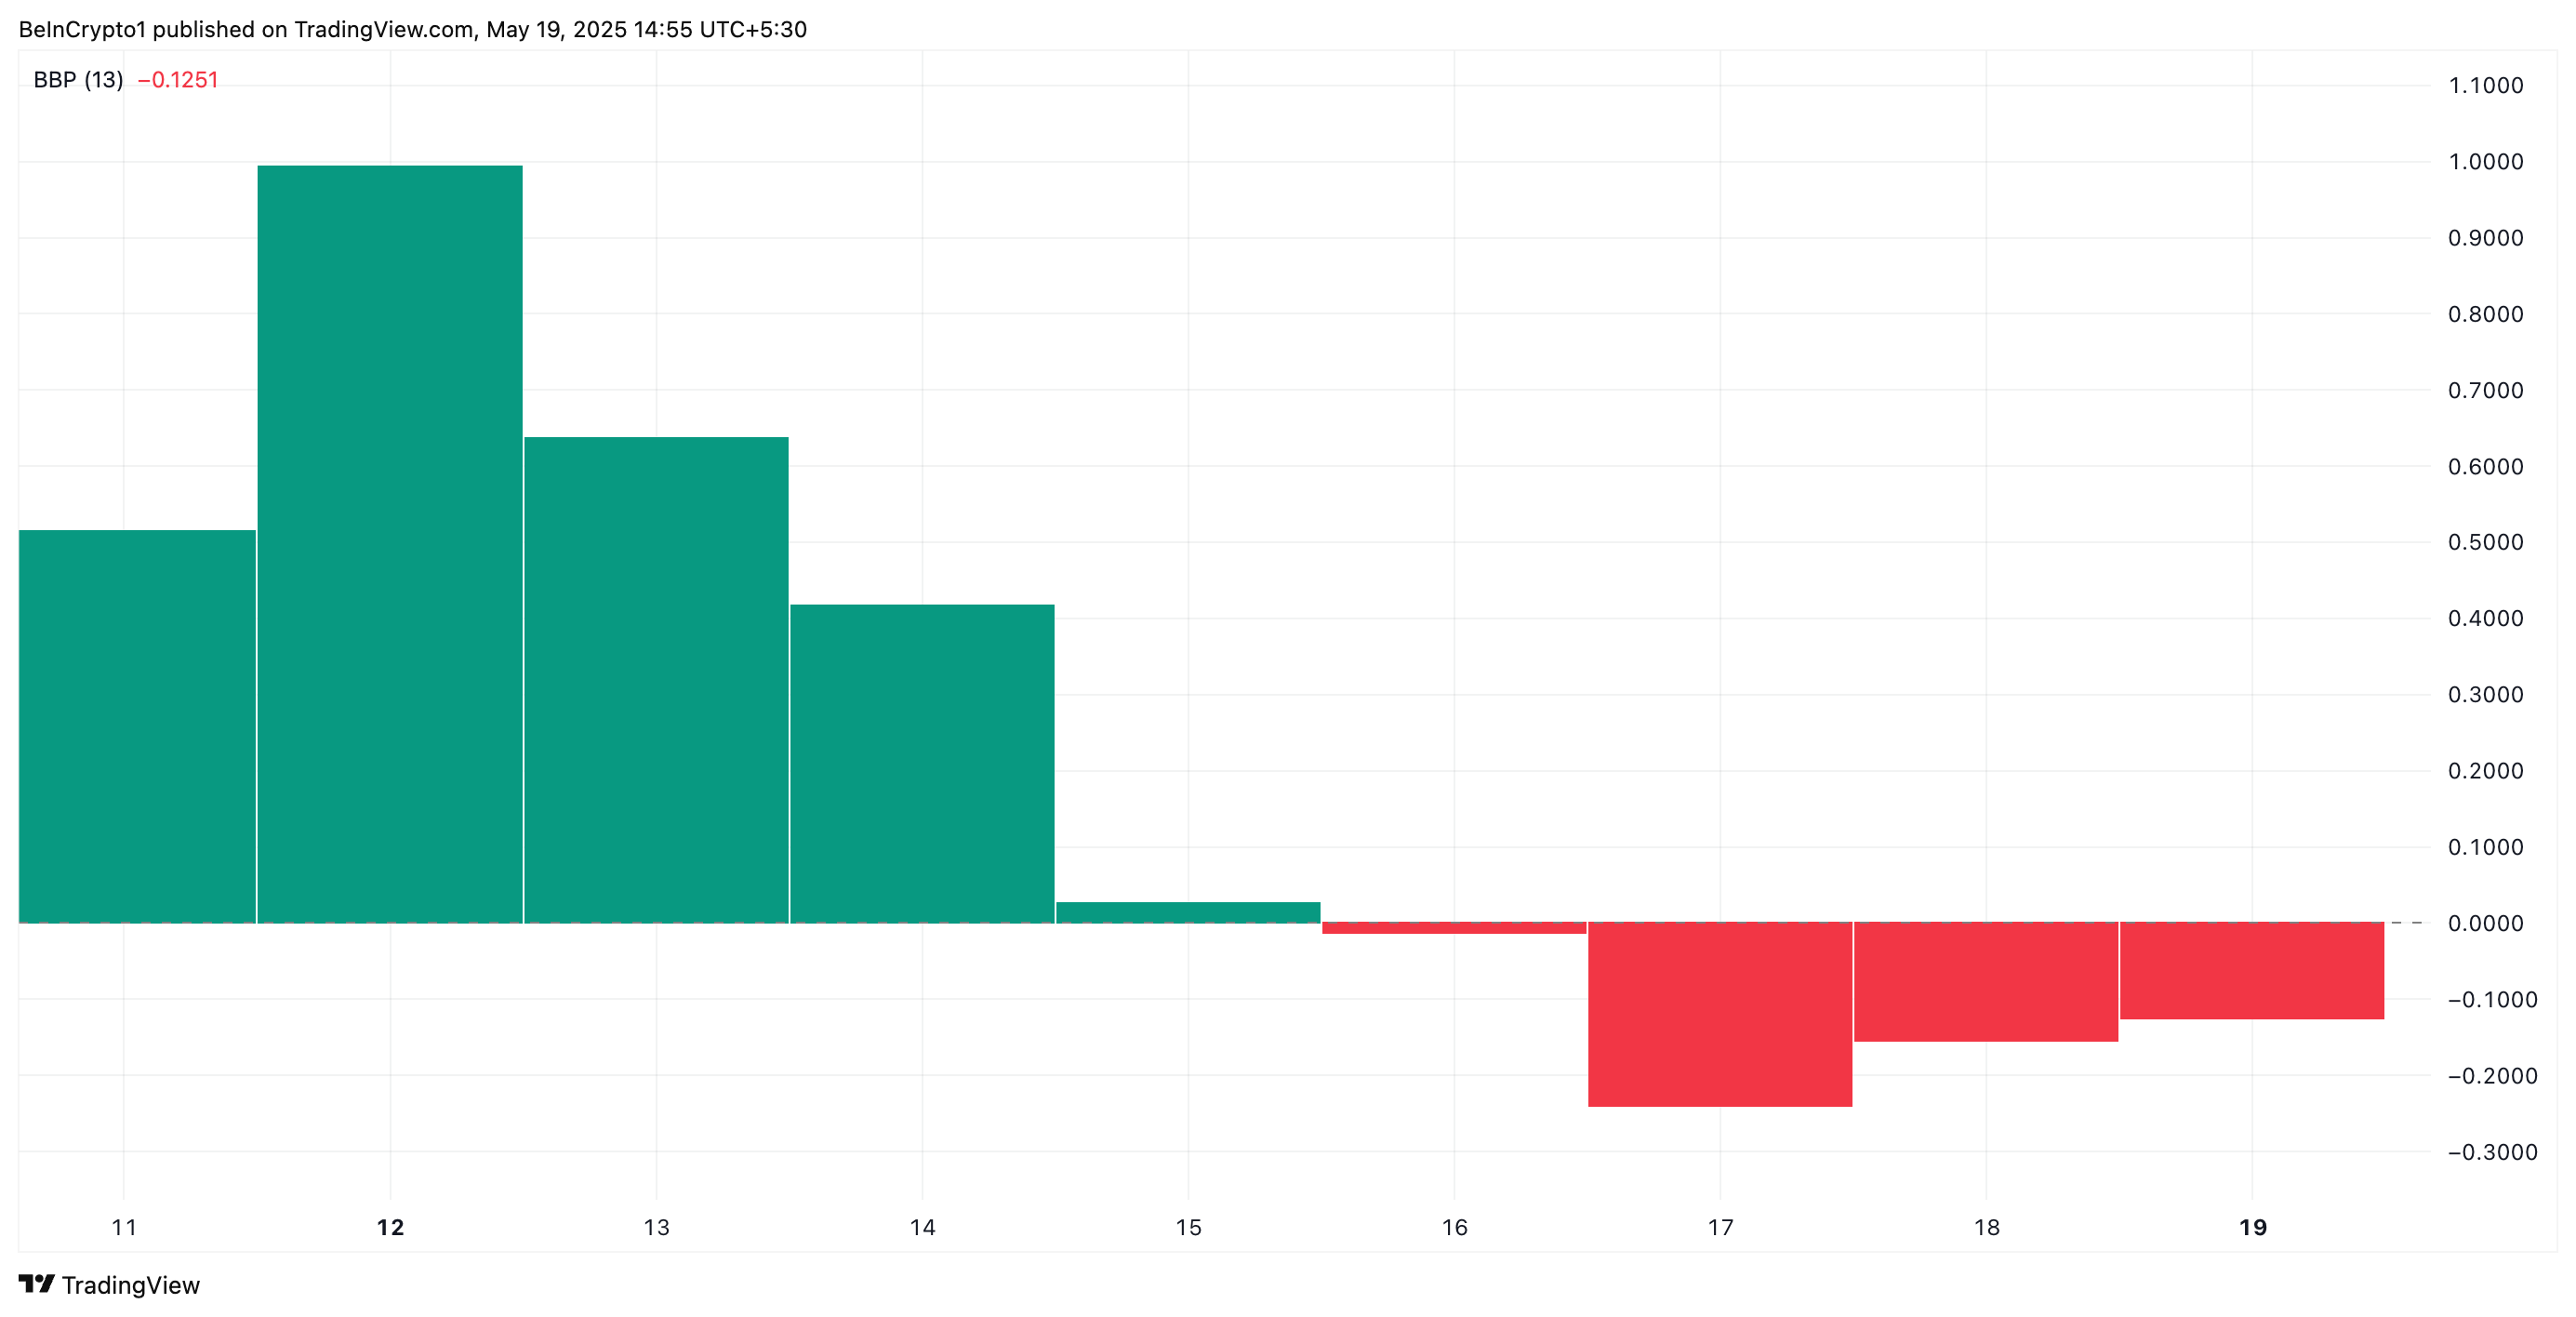
The Elder Ray Index measures the strength of buying and selling pressure in the market, using two key components: Bull Power and Bear Power. 

When the index is negative, sellers dominate the market. This signals a bearish trend and hints at a continued downward momentum for PI.

Resistance at 20-Day EMA Caps Recovery Hopes

The PI token trades below its 20-day exponential moving average (EMA), which forms dynamic resistance above it. The 20-day EMA measures an asset’s average price over the past 20 trading days, giving more weight to recent prices. 

When an asset trades below its 20-day EMA, recent price action is weaker than the short-term trend. This is a bearish signal indicating a lack of buying momentum.

If the trend continues, PI could fall to $0.55.

PI Price Analysis
PI Price Analysis. Source: TradingView

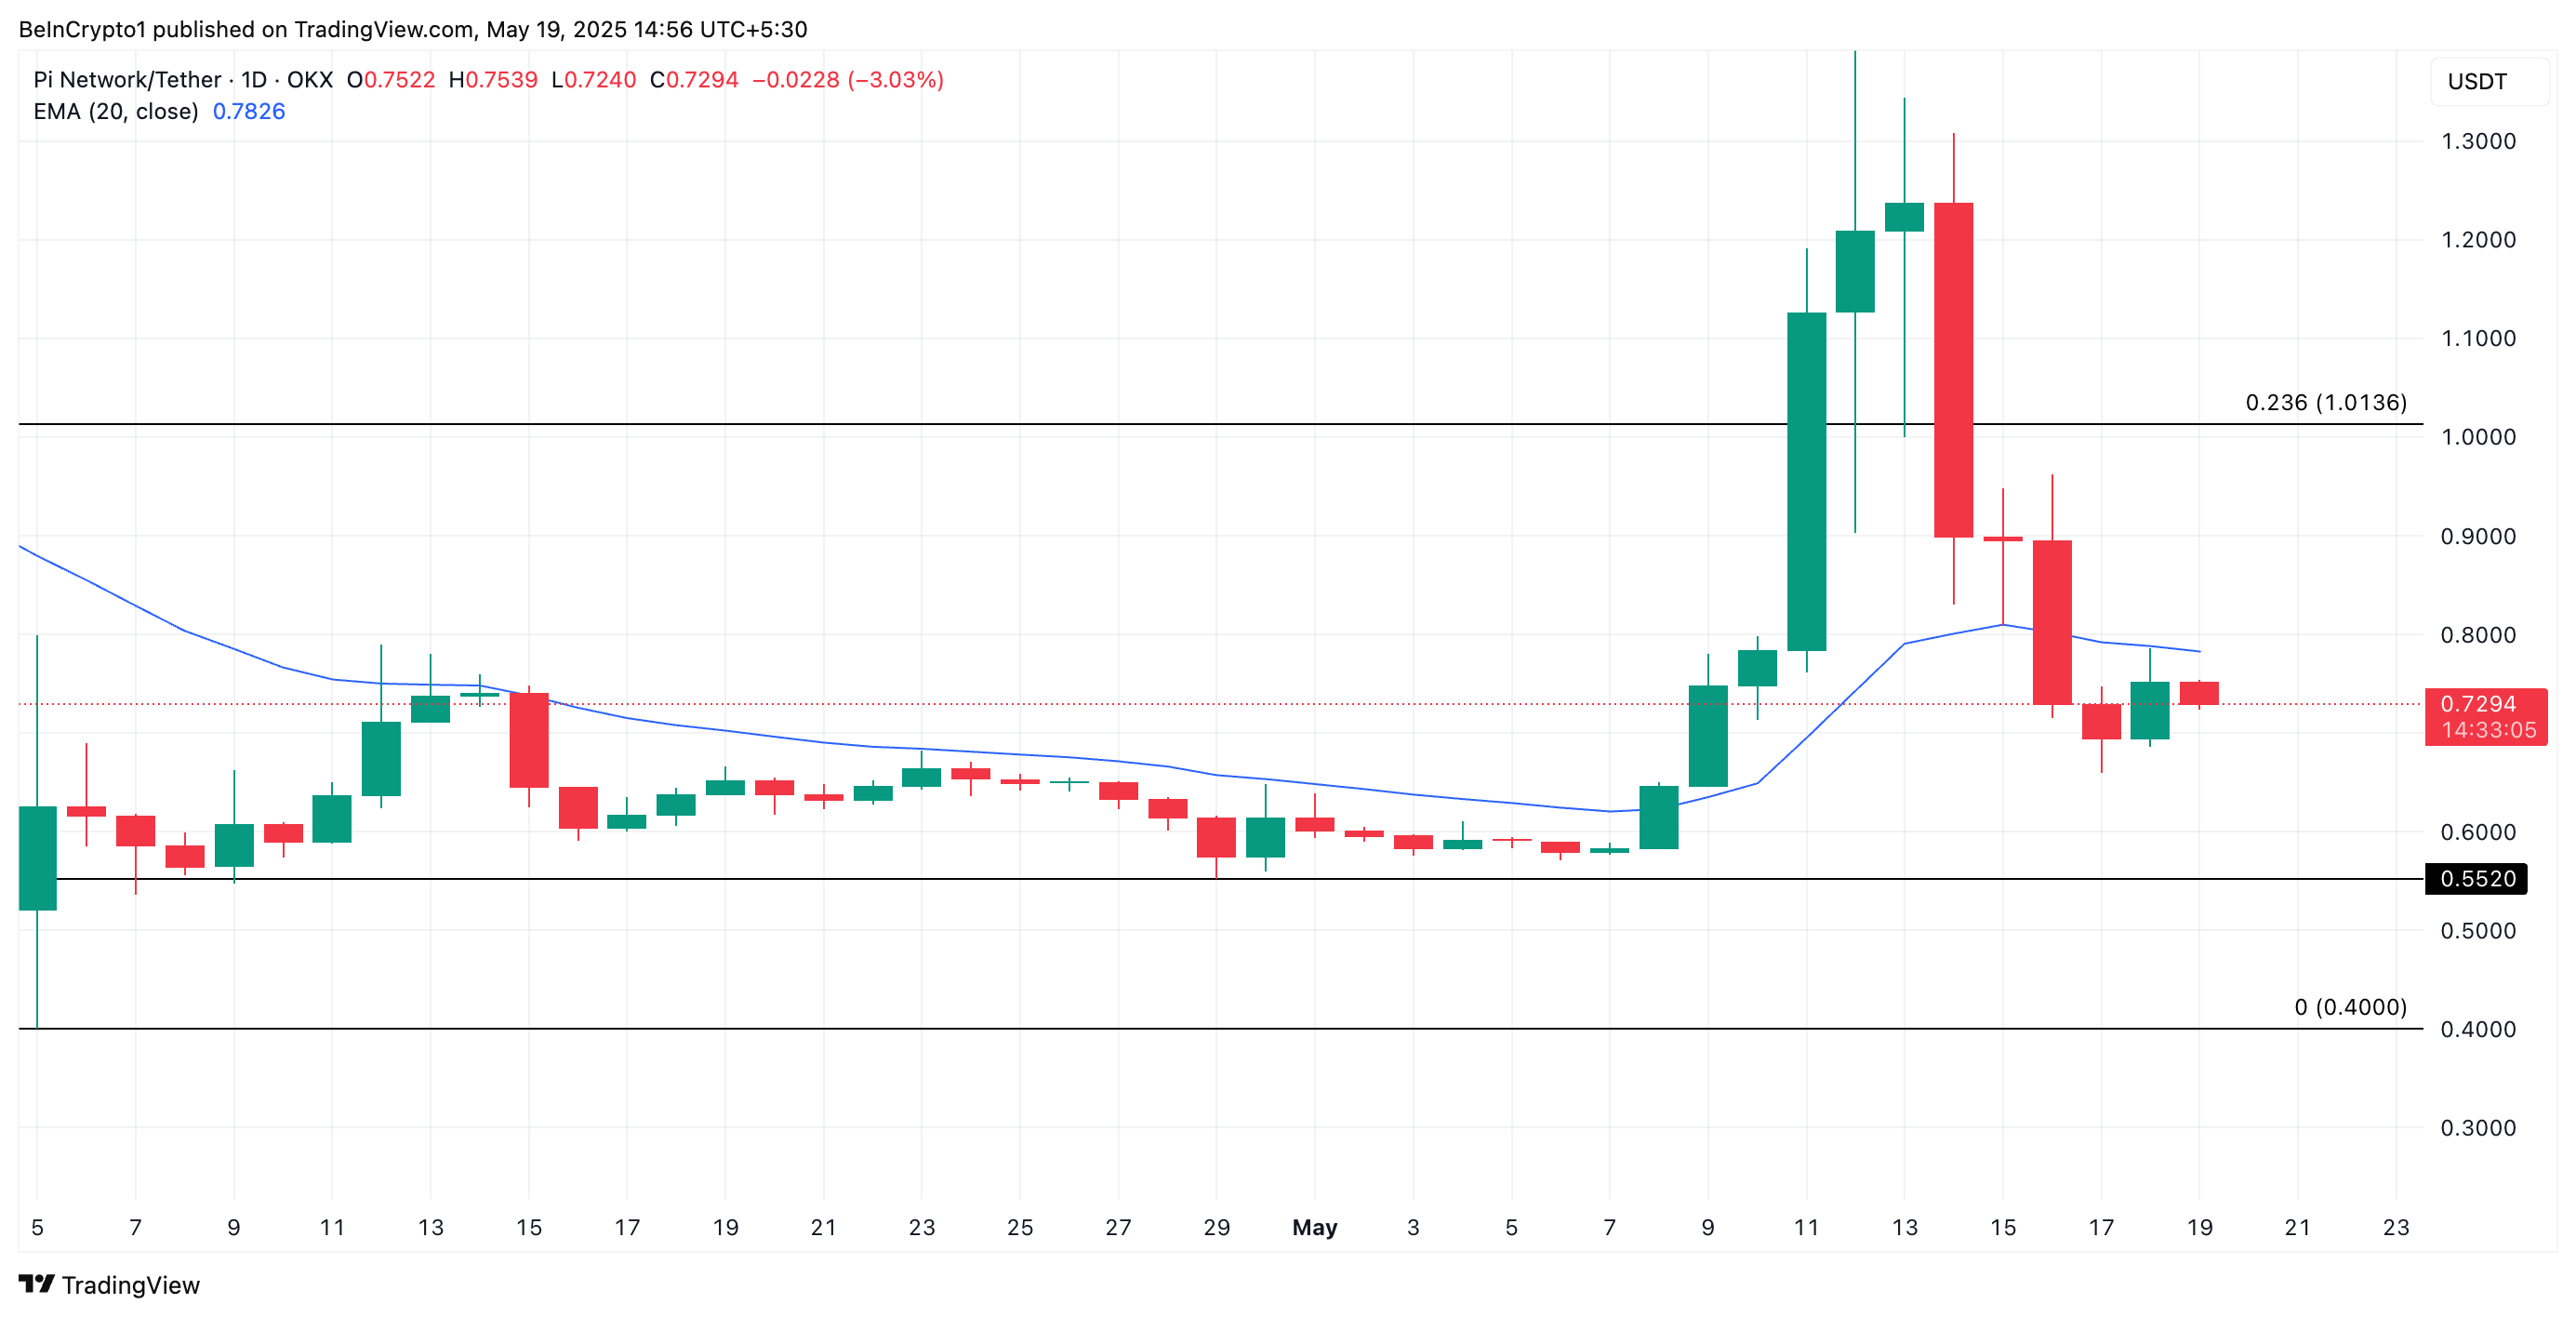
On the other hand, if buying pressure spikes, the PI token could rebound and climb to $1.01.

Best crypto platforms in Europe
eToro eToro Explore
YouHodler YouHodler Explore
Arkham Arkham Explore
Wirex Wirex Explore
Best crypto platforms in Europe
eToro eToro Explore
YouHodler YouHodler Explore
Arkham Arkham Explore
Wirex Wirex Explore
Best crypto platforms in Europe
eToro eToro
YouHodler YouHodler
Arkham Arkham
Wirex Wirex
NEXO NEXO

Disclaimer

In line with the Trust Project guidelines, this price analysis article is for informational purposes only and should not be considered financial or investment advice. BeInCrypto is committed to accurate, unbiased reporting, but market conditions are subject to change without notice. Always conduct your own research and consult with a professional before making any financial decisions. Please note that our Terms and ConditionsPrivacy Policy, and Disclaimers have been updated.

Untitled-1.png
Abiodun Oladokun
Abiodun Oladokun is a Technical and On-Chain Analyst at BeInCrypto, where he specializes in market reports on cryptocurrencies from diverse sectors, including decentralized finance (DeFi), real-world assets (RWA), artificial intelligence (AI), decentralized physical infrastructure networks (DePIN), Layer 2s, and meme coins. Previously, he conducted market analysis and technical assessments of various altcoins at AMBCrypto, utilizing on-chain analytics platforms like Messari, Santiment...
READ FULL BIO
Sponsored
Sponsored