
PI has been in a persistent downtrend since reaching an all-time high of $3 on February 26. In fact, it has traded below a descending trendline since April 12, highlighting the negative bias against the altcoin.
However, the tide may finally be turning. Technical indicators now point to a potential bullish resurgence, hinting at a PI rebound in the short term.
PI’s Quiet Accumulation Phase Could Trigger a Rally
BeInCrypto’s assessment of the PI/USD one-day chart suggests that the altcoin may be preparing for a bullish breakout. For example, its on-balance volume (OBV) has spiked over the past two days, showing early signs of accumulation.
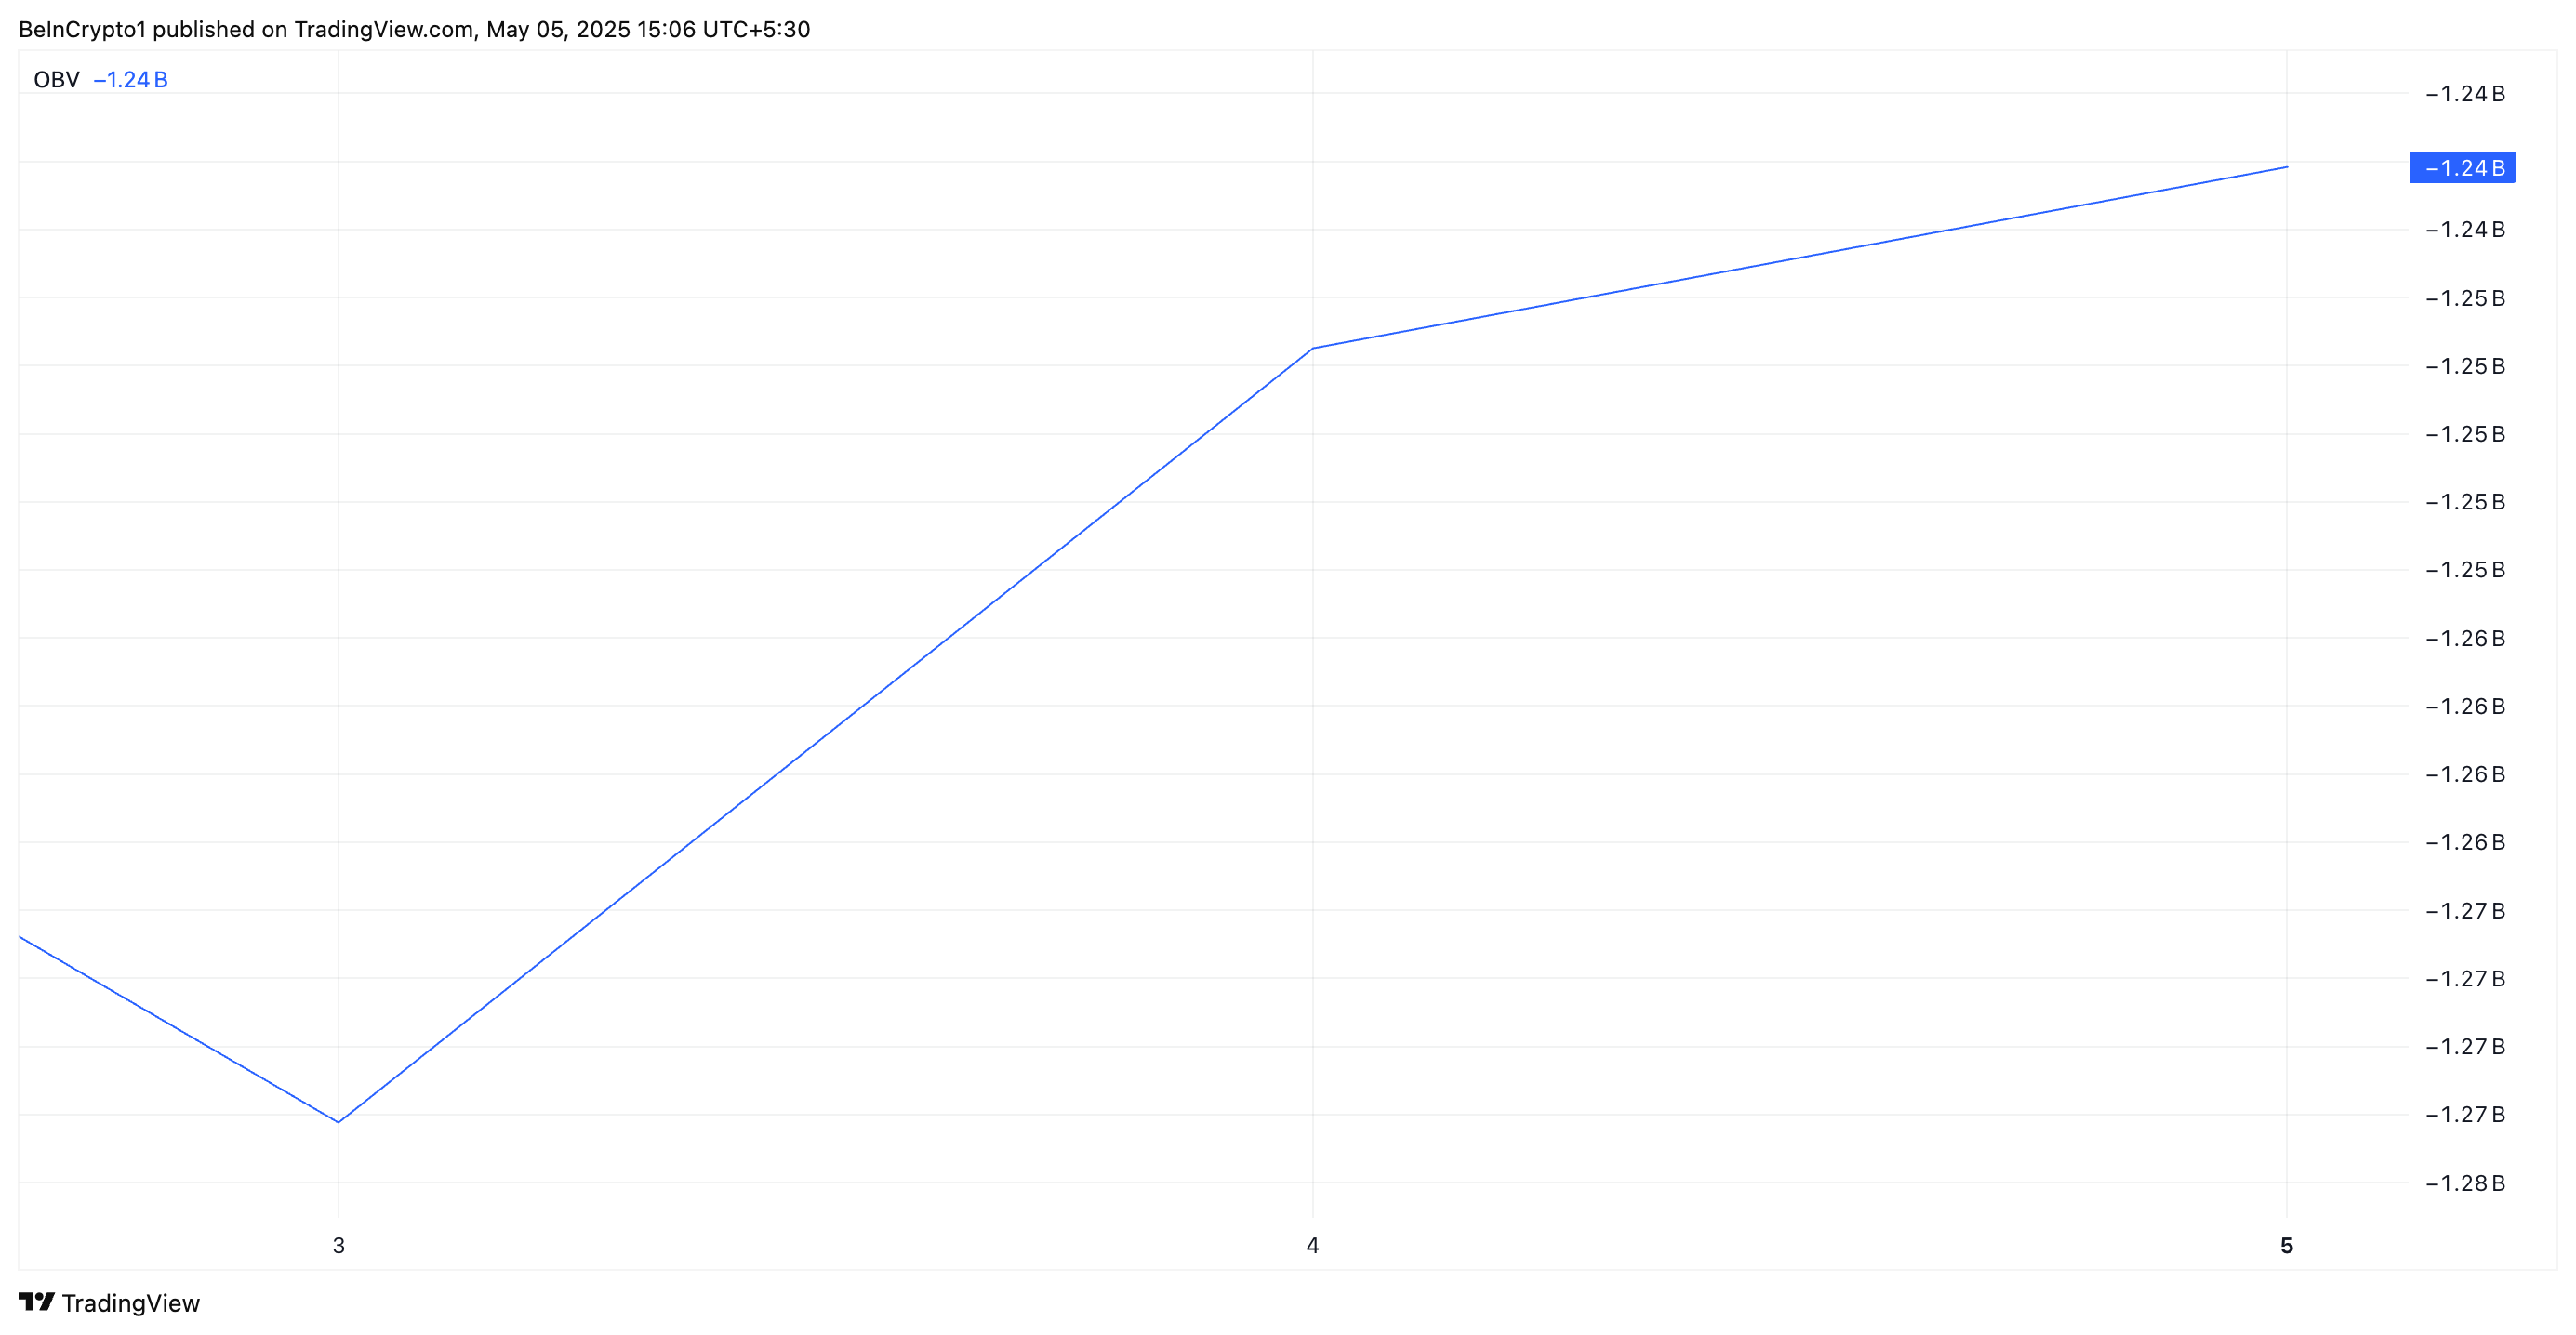
The OBV indicator uses trading volume to predict price movements, adding volume on up days and subtracting it on down days. When its value rises like this, it suggests a surge in buying pressure.
OBV is considered a leading indicator, meaning it often moves ahead of price action and can signal shifts in market sentiment before they are reflected in the asset’s price. Therefore, PI’s rising OBV indicates that buyers are quietly accumulating the token, even as its price remains subdued.
This divergence signals that bullish momentum is building, increasing the likelihood of a PI breakout once broader market sentiment aligns.
Furthermore, the red bars forming PI’s BBTrend indicator have gradually shrunk. This reduction suggests that selling pressure is weakening, serving as an early signal that the current downtrend may be losing steam.
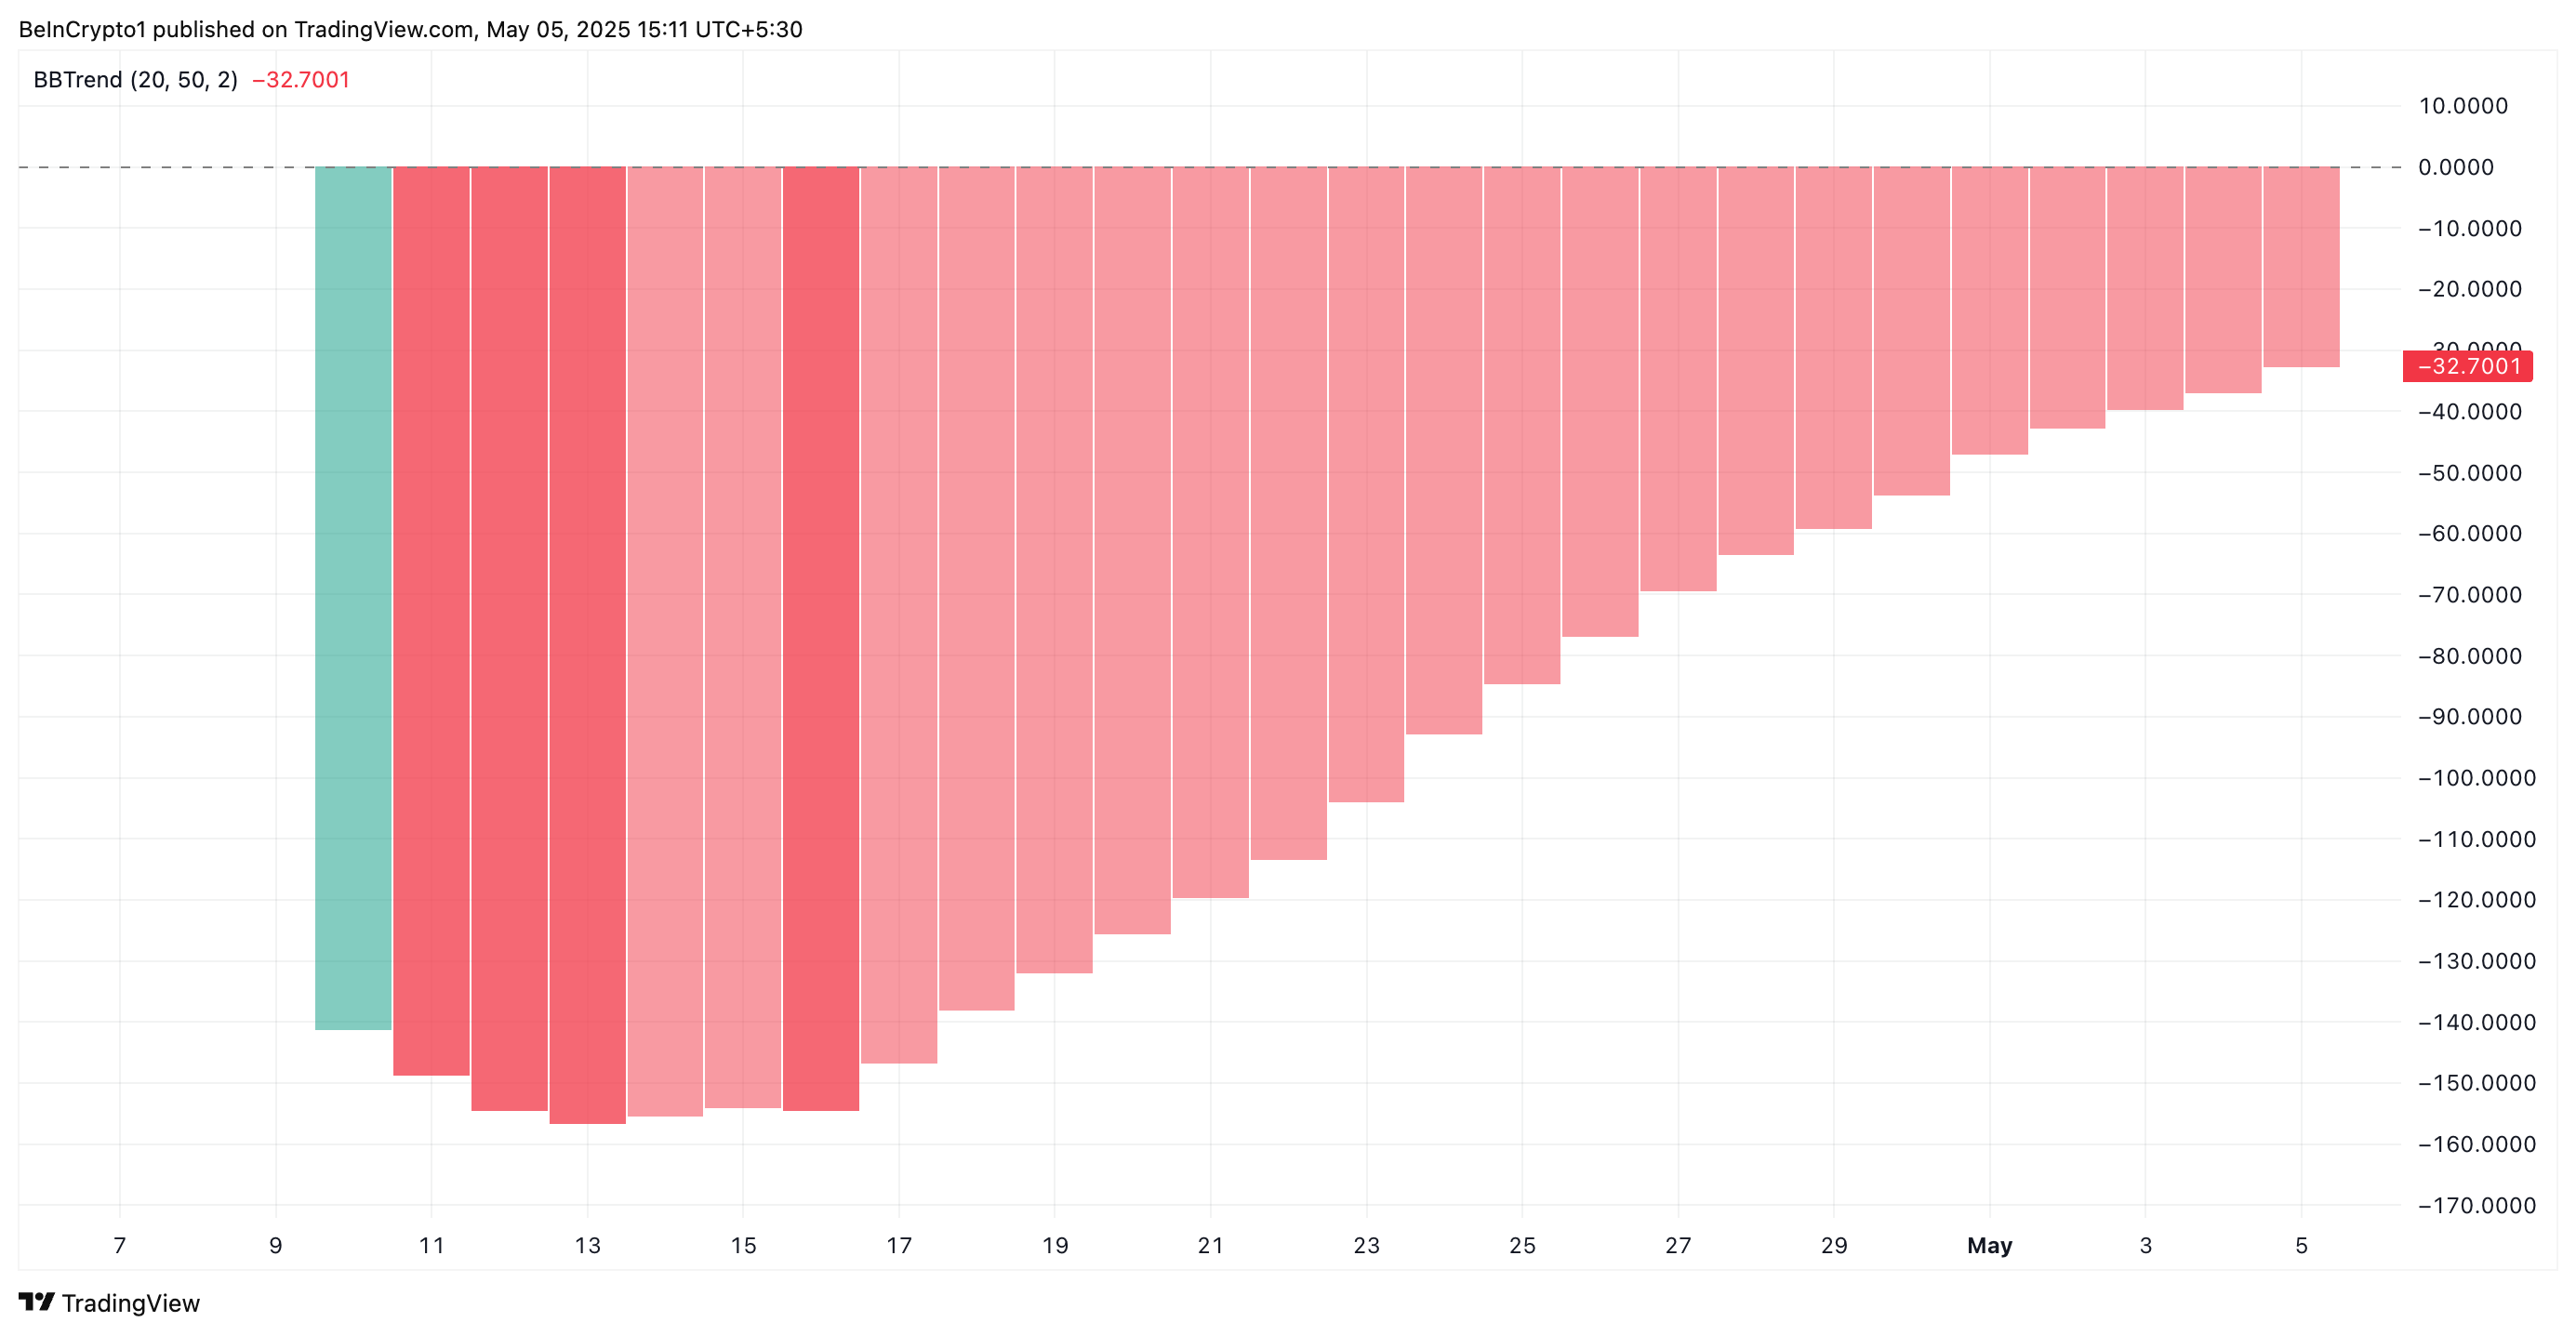
In technical analysis, a contraction in the BBTrend histogram is a precursor to a potential trend reversal, especially when accompanied by rising volume and other bullish indicators.
As the bars shorten, it indicates that volatility is stabilizing in the PI market and that a bullish shift in price is increasingly likely.
PI for Reversal as Bullish Signals Point to $1 Breakout
PI currently trades at $0.591, resting below its descending trend line, which forms resistance above it at $0.605. If bullish pressure strengthens and PI demand rockets, it could flip this price point into a support floor and climb toward $1.01.
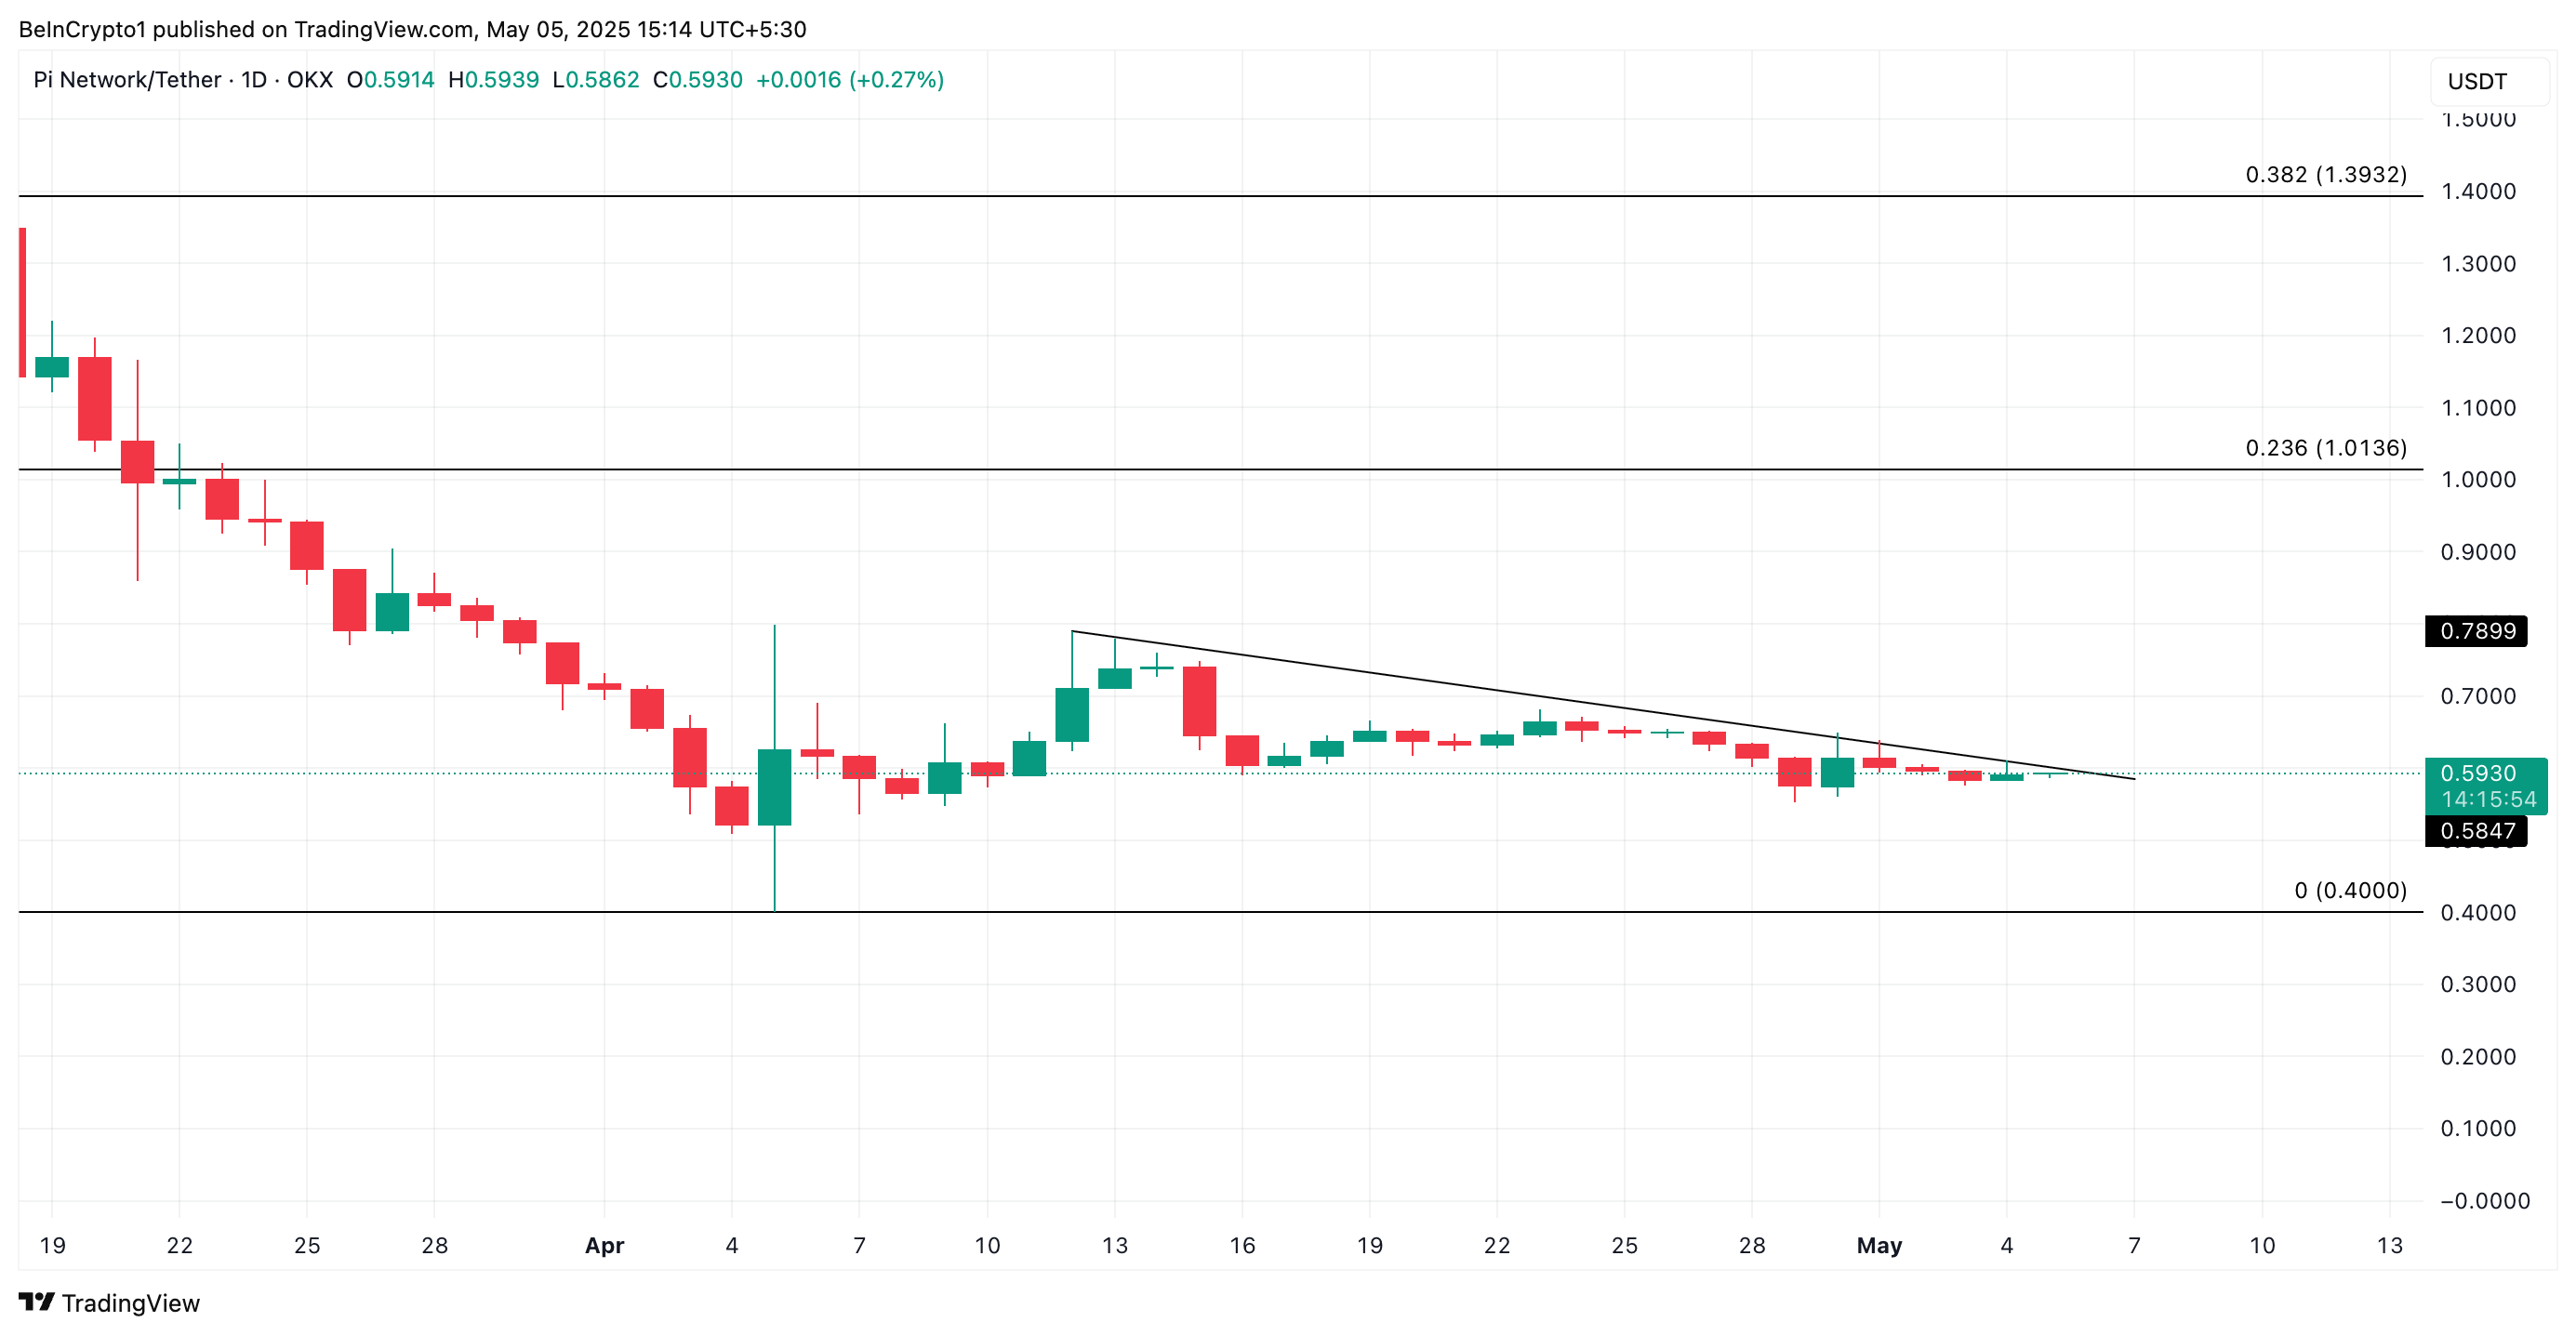
PI Price Analysis. Source: TradingView
On the other hand, if selloffs persist, the PI token could revisit its all-time low of $0.40.
