
PI Network’s PI token has surged 15% over the past week, thanks to renewed optimism in the broader crypto market.
However, the rally is approaching a make-or-break moment as the token faces intense selling pressure at the $0.40 level. This price point once acted as strong support but has now flipped into resistance.
PI Price Stuck Under $0.40 as Bears Keep Tight Grip
Readings from the PI/USD one-day chart reveal that, over the past week, PI has made two unsuccessful attempts to break above the $0.40 barrier.
On each occasion, the token briefly breached this threshold, only to be met with a wave of sell-side pressure that dragged prices back below the mark before the daily close. This pattern reflects the strength of the resistance and the firm grip sellers still hold at this level.
While PI’s price is up 2% today in line with broader market growth, the 26% drop in trading volume paints a more cautious picture. This falling volume has created a negative divergence with the token’s price, hinting at the possibility of a pullback in the near term.
For token TA and market updates: Want more token insights like this? Sign up for Editor Harsh Notariya’s Daily Crypto Newsletter here.
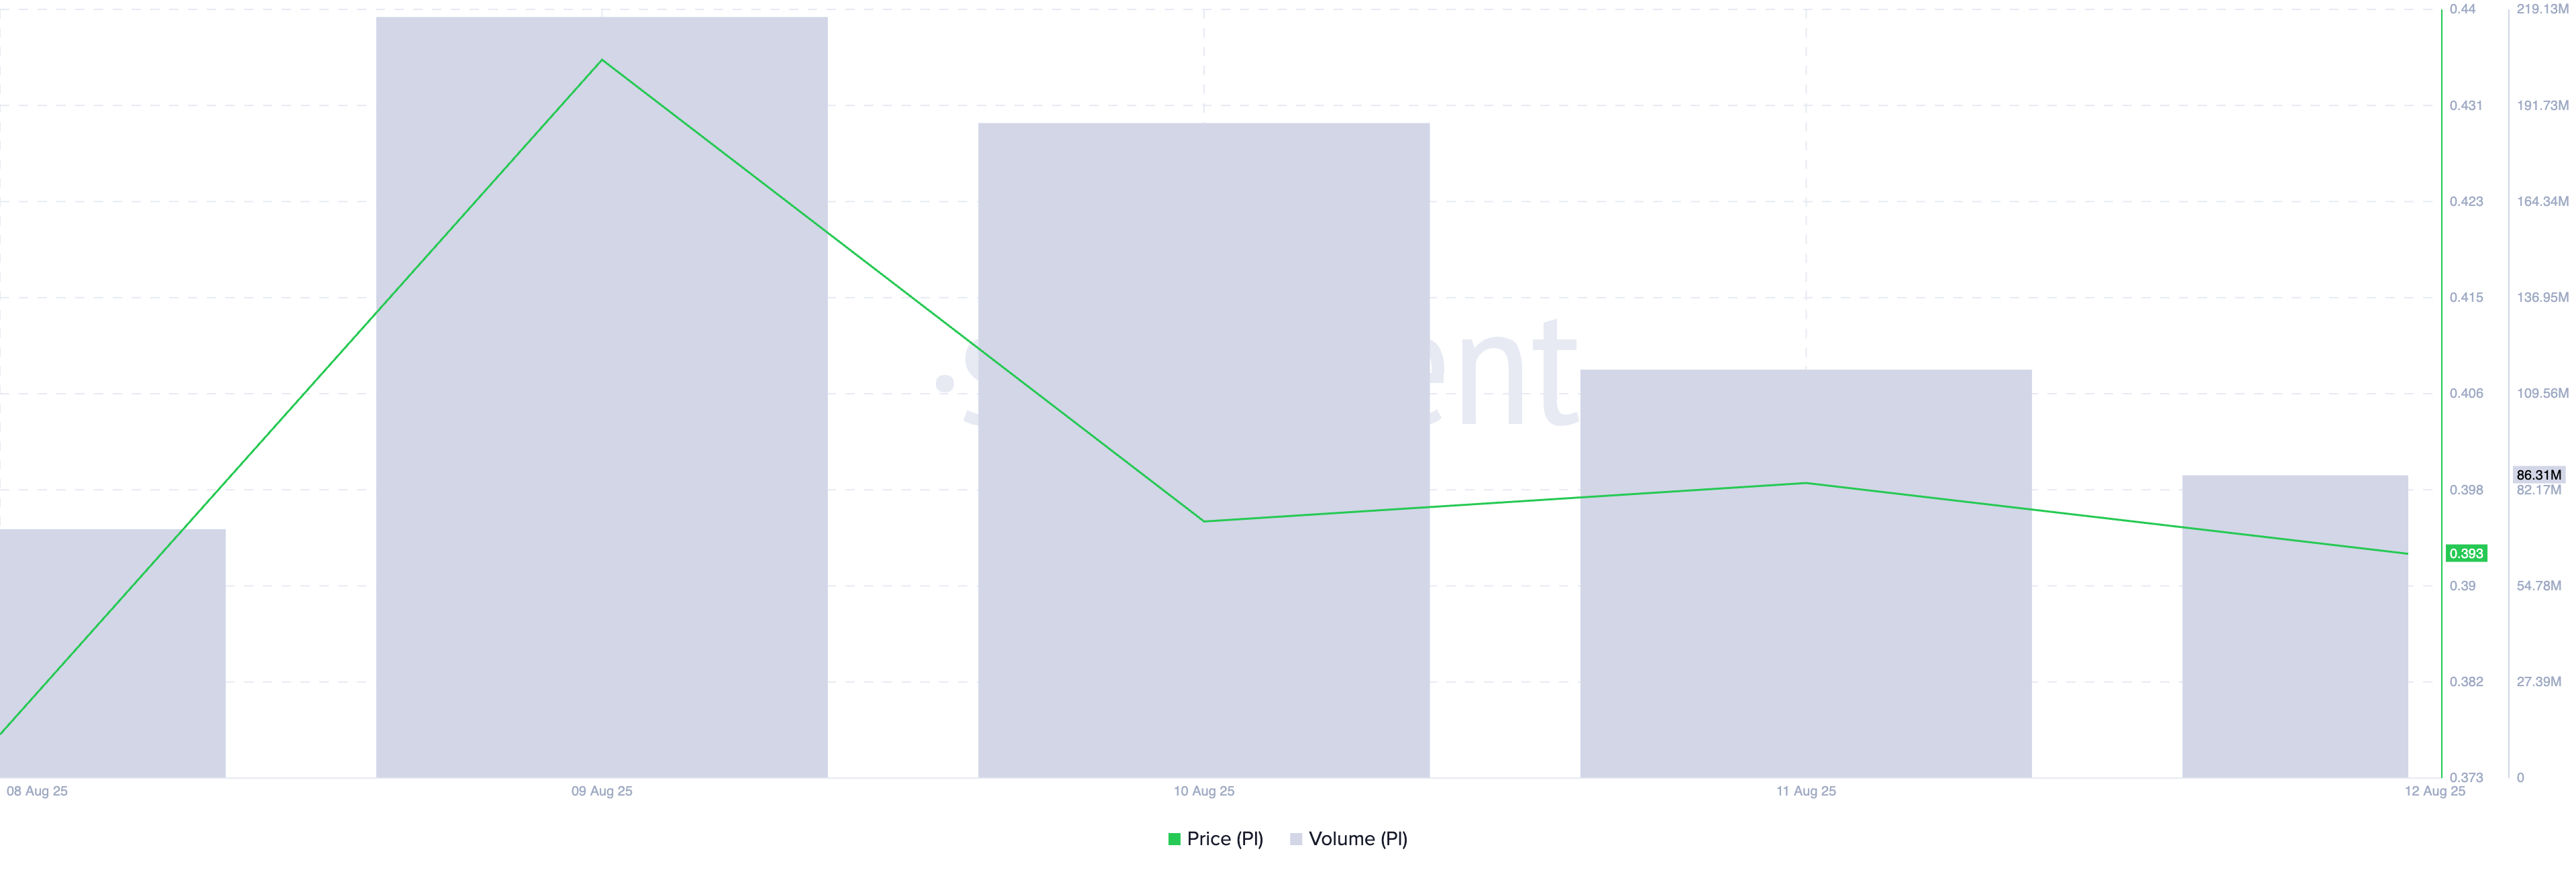
When an asset’s price rises while trading volume falls, it often signals weakening buying strength. This divergence suggests the PI’s rally may lack conviction and be at risk of a reversal once the daily demand starts to wane.
Moreover, PI’s Elder-Ray Index, observed on a daily chart, paints a similar bearish picture. Over the past two trading sessions, this indicator has posted negative values. At press time, this sits at -0.0056, indicating that the bears remain in deep control of PI spot markets.
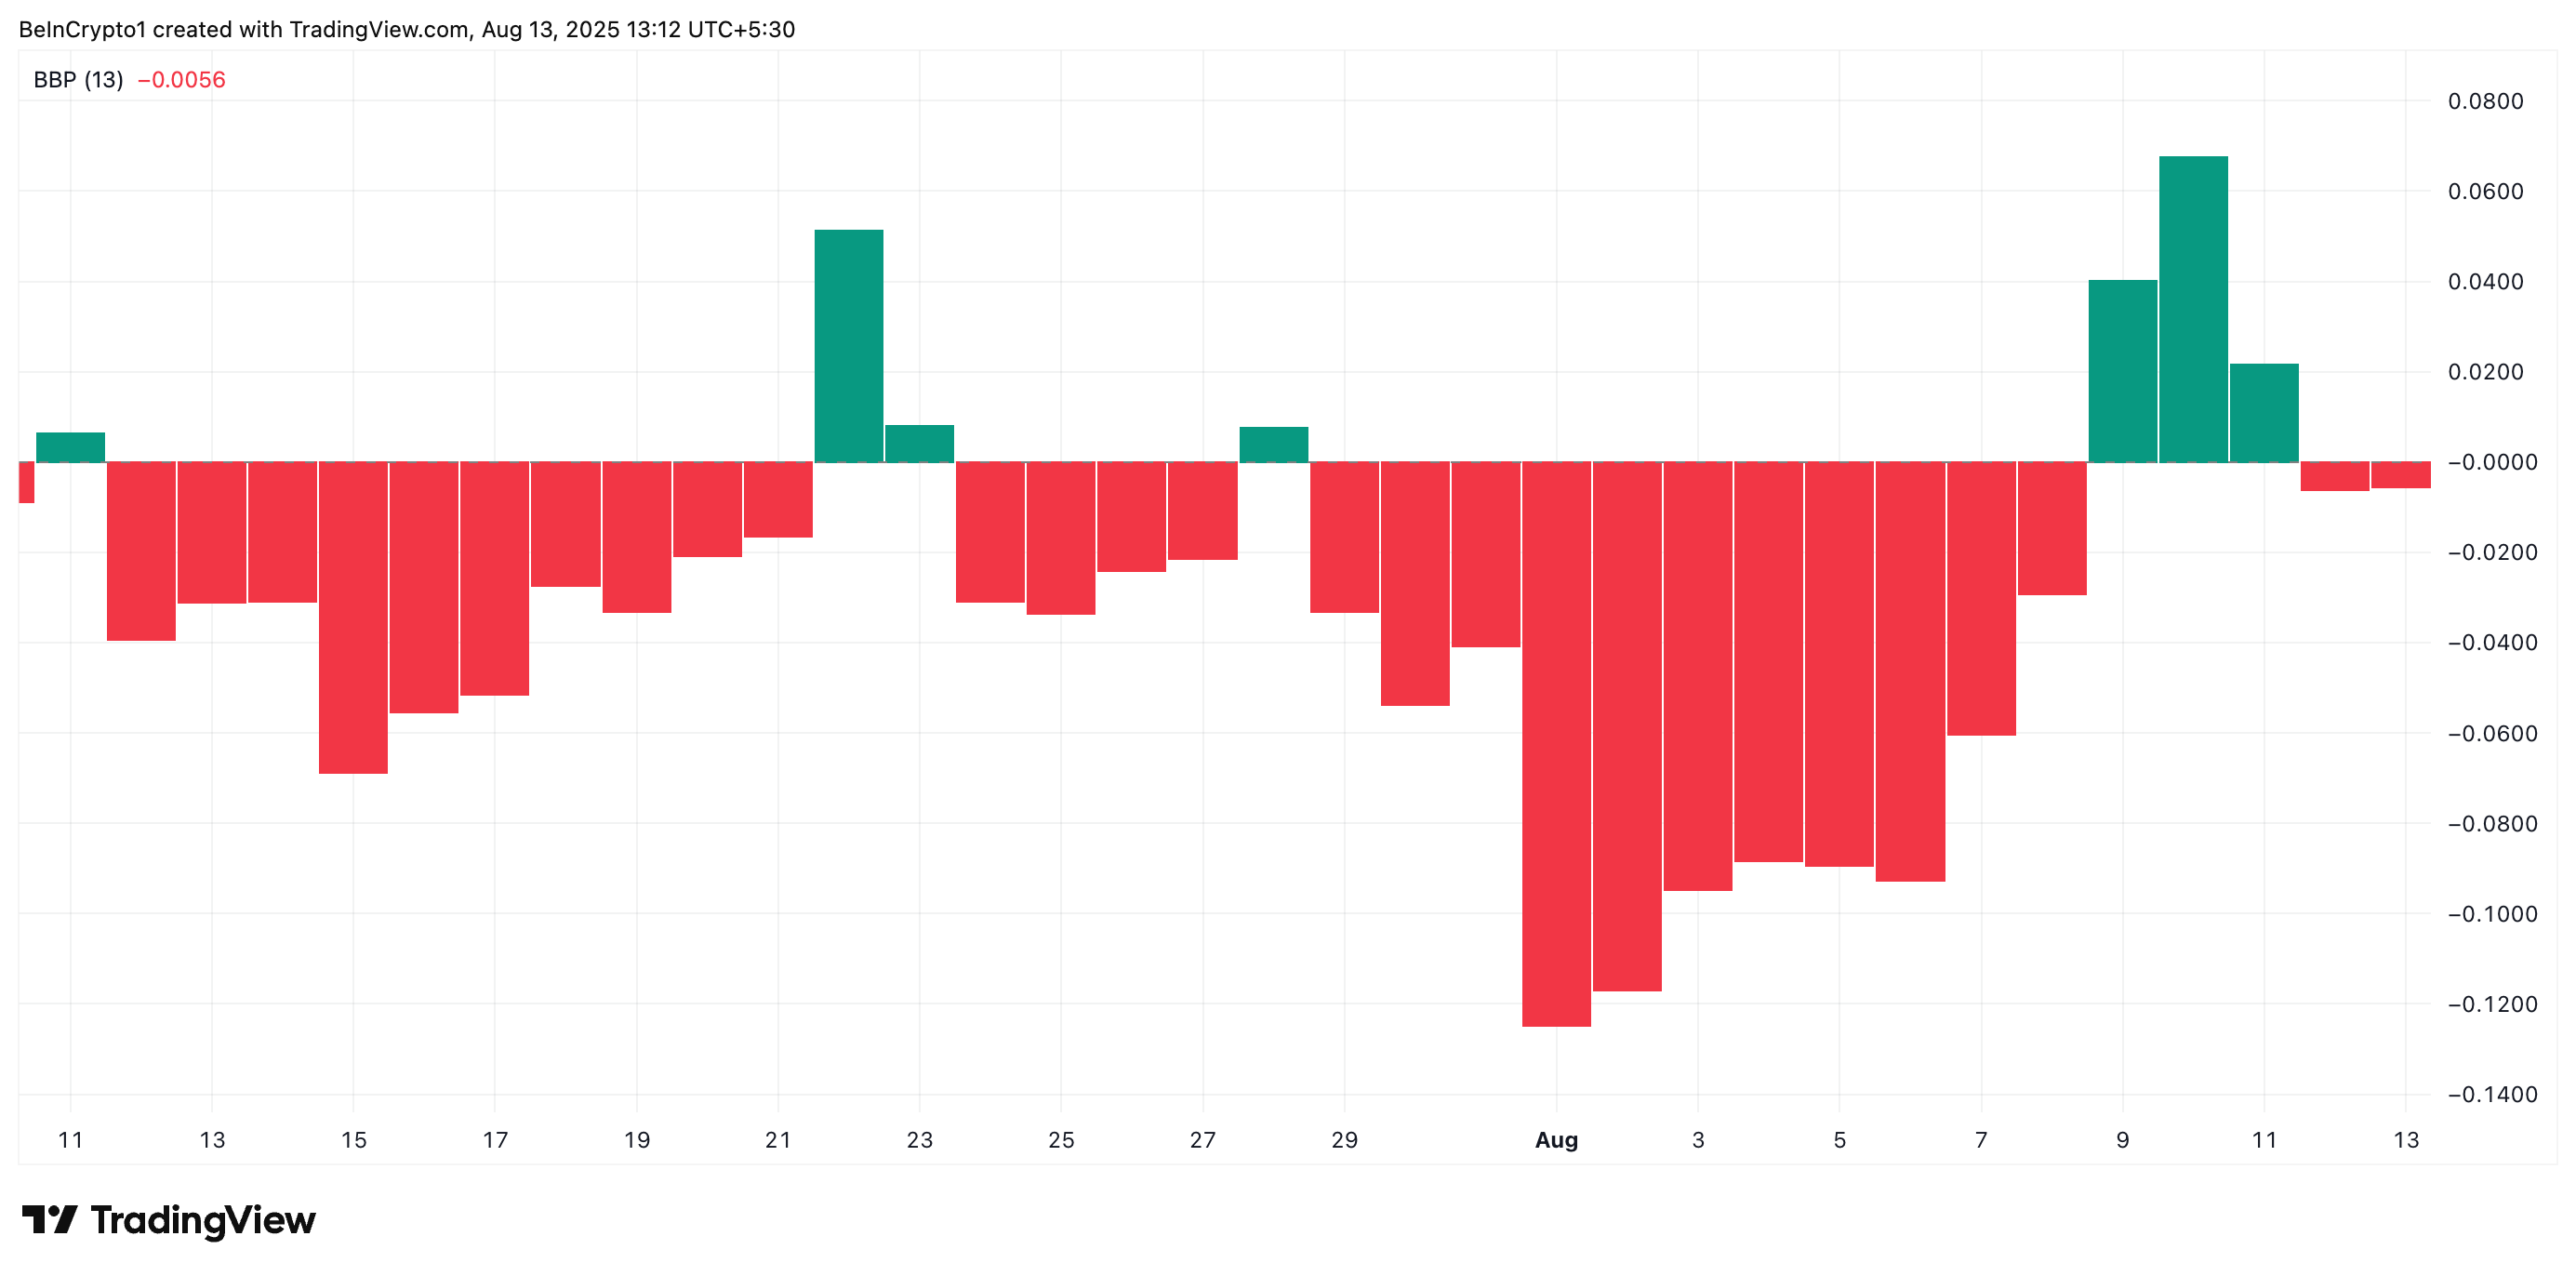
The Elder-Ray Index measures the balance of buying and selling pressure by comparing price movements to a short-term moving average. When negative, selling pressure outweighs buying power, confirming bearish market control.
$0.32 Crash or $0.46 Rally?
PI’s failure to secure a decisive close above $0.40 soon could trigger a revisit to its all-time low of $0.32.
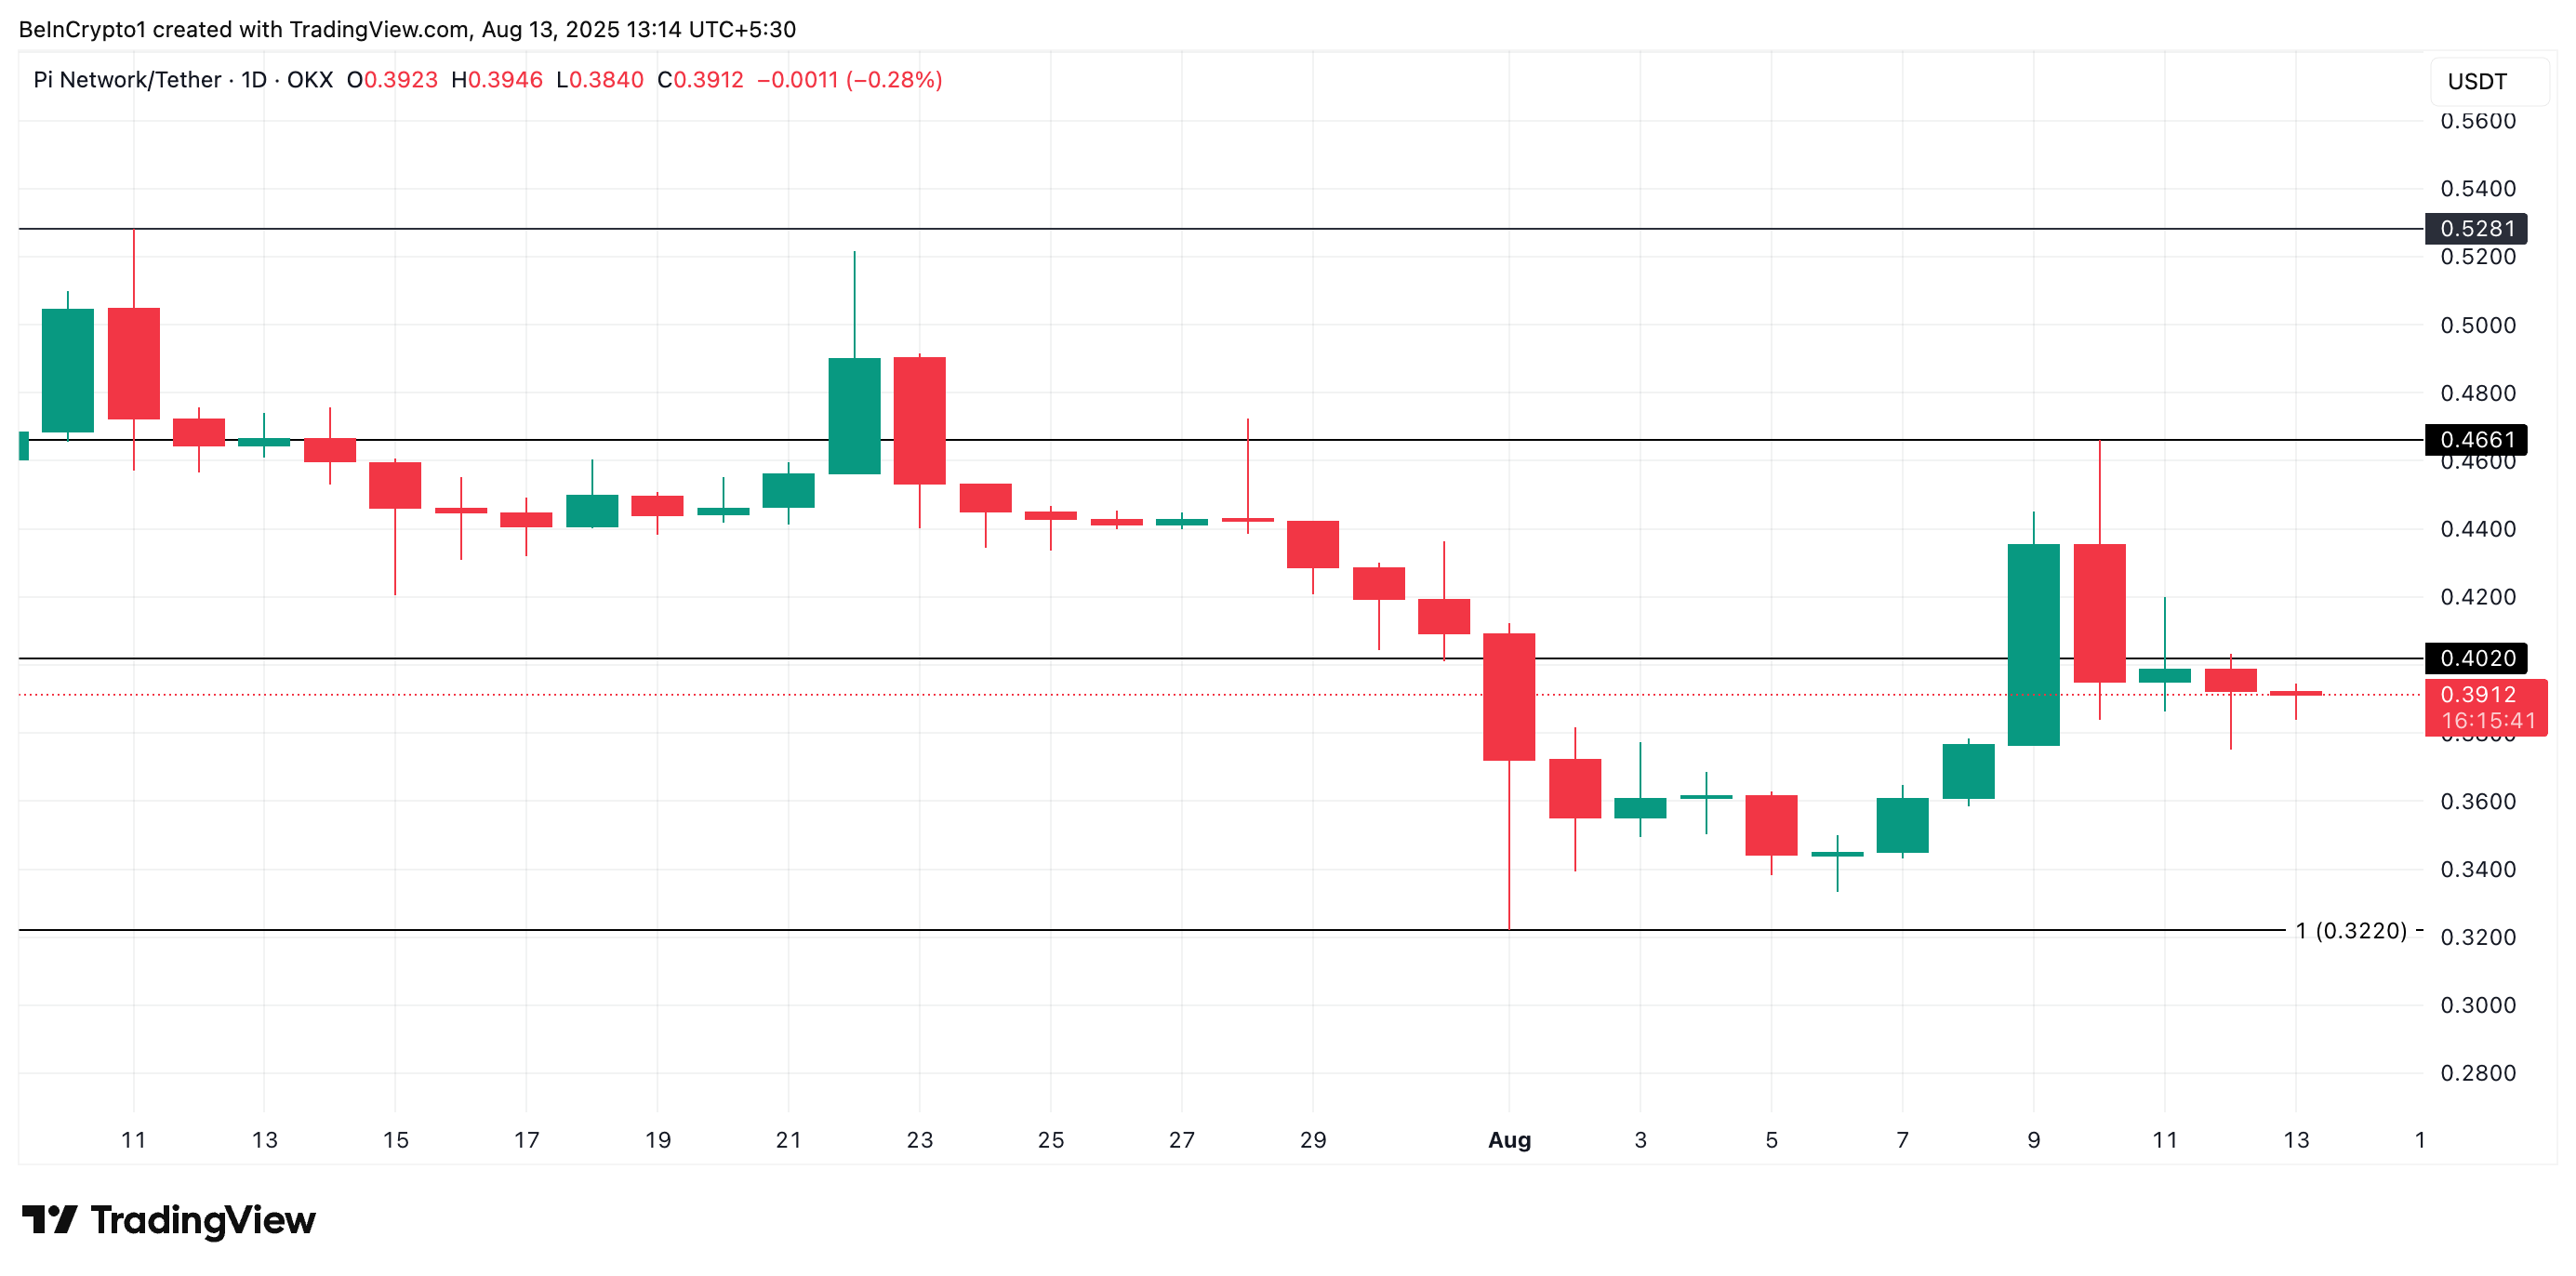
PI Price Analysis. Source: TradingView
A successful breakout, however, could unlock the door for a sustained recovery, potentially pushing PI’s price toward $0.46 in the sessions ahead.
