
PI Network’s price has remained resilient around the $0.47 mark over the past four days. Bullish traders are stepping in to prevent a break below this level and a potential revisit of its all-time low.
With technical signals reflecting a period of relative calm in the market, and the token’s price consolidating over the past few days, it remains to be seen where the price might be headed next.
PI Price Stalls Between $0.47–$0.50
Readings from the PI/USD one-day chart suggest a tug-of-war between bulls and bears since the beginning of the week. The token’s price has remained mostly lackluster, trading within a narrow price range.
Since Tuesday, the altcoin has faced resistance at $0.50 and found support at $0.47. This sideways trend indicates a relative balance between buying and selling pressures, as market participants remain on the sidelines, awaiting a catalyst to trigger movement in either direction.
PI’s flat Relative Strength Index (RSI) confirms this trend. The indicator has remained narrow over the past few days, signaling a period of low volatility and reduced price fluctuation. As of this writing, it is at 35.93.
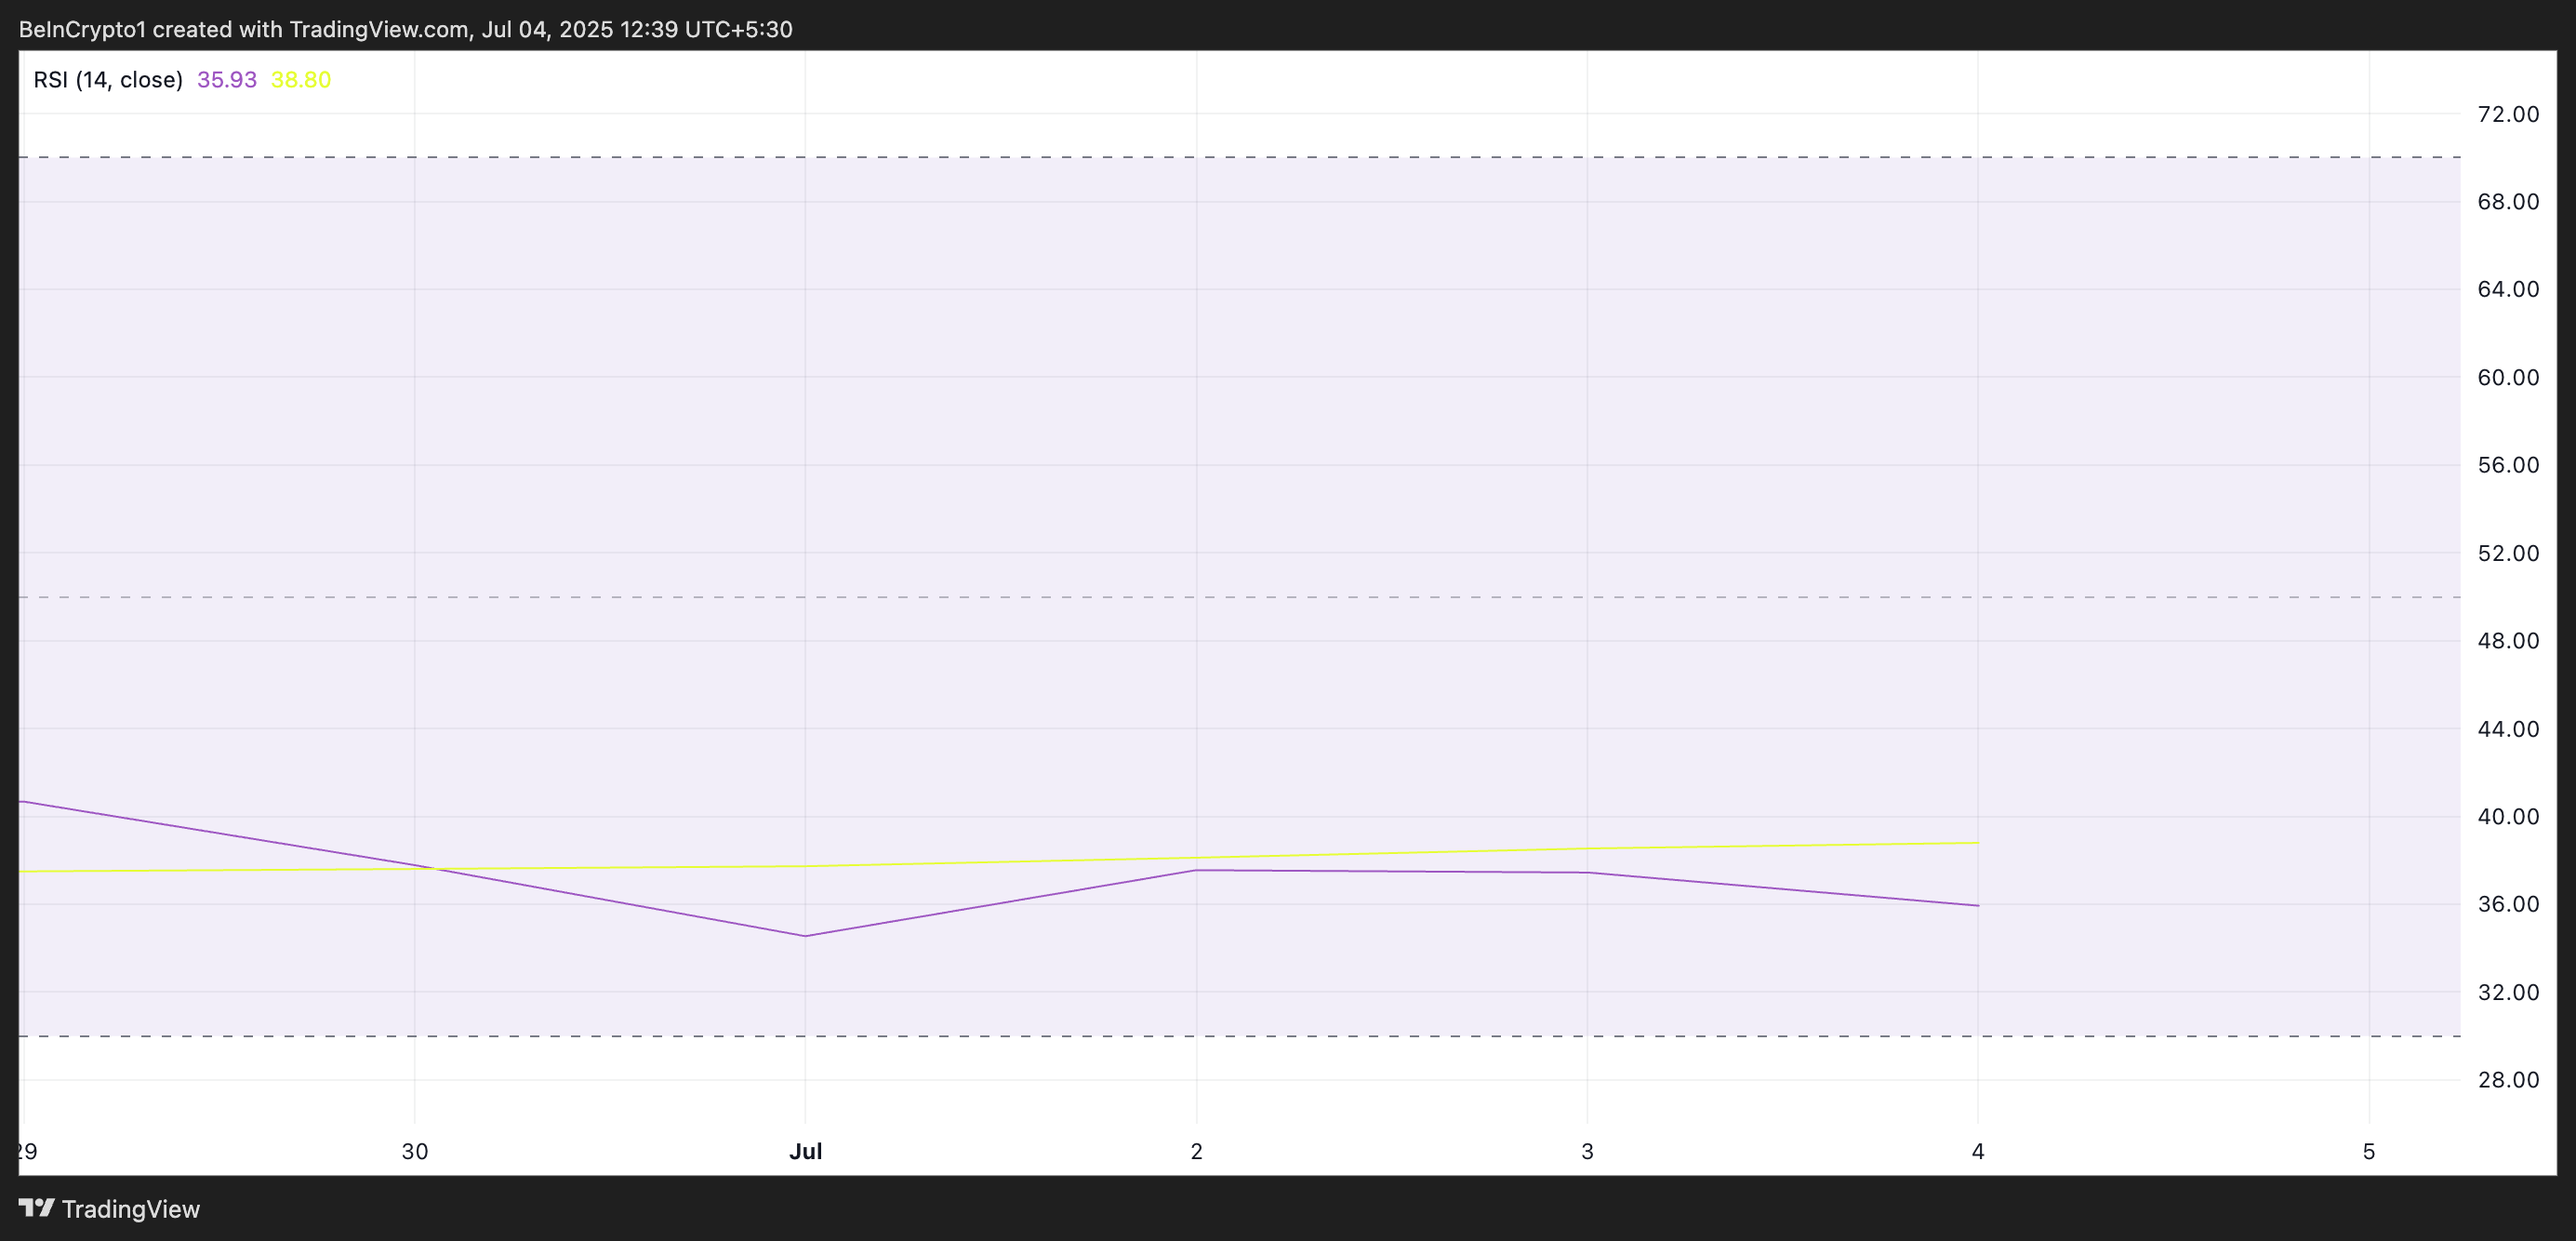
A flat RSI indicates the market lacks strong conviction in either direction. This pattern signals that PI traders are hesitant to commit to significant buy or sell positions and await a catalyst or trend confirmation.
Furthermore, the token’s plummeting Average True Range (ATR) confirms the steady drop in market volatility. At press time, it was at 0.048, noting a 12% decline since Tuesday.
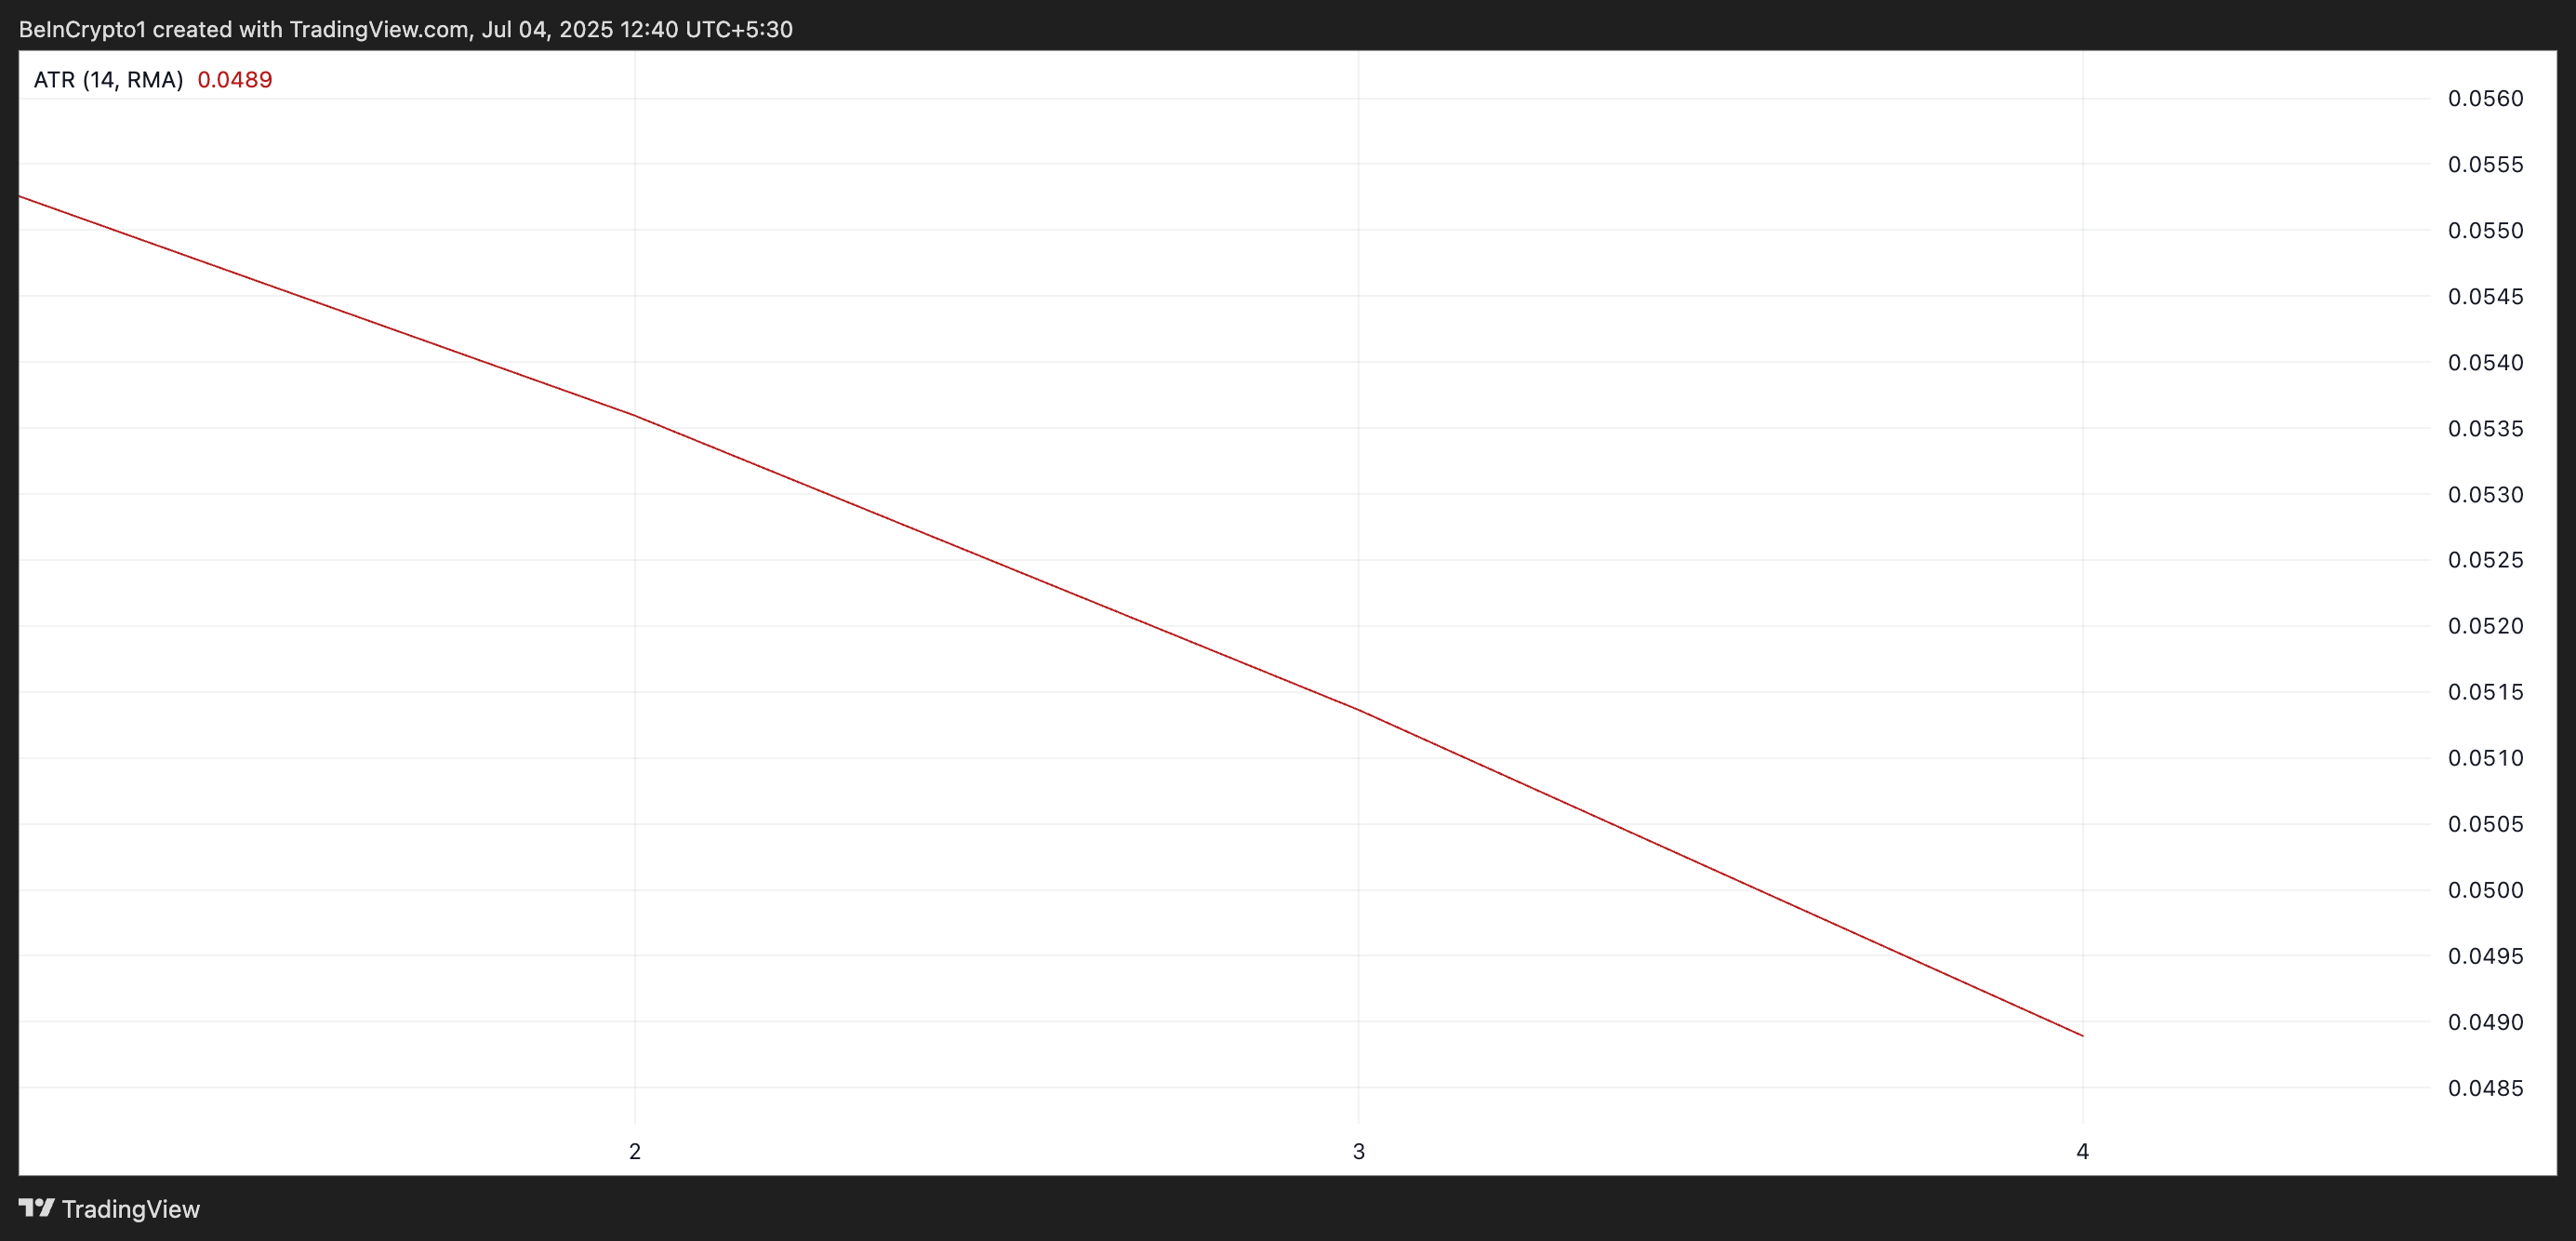
PI ATR. Source: TradingView
The ATR indicator measures the degree of price movement over a given period. When it trends downward like this, it often suggests that price fluctuations are narrowing and momentum is weakening.
These trends indicate shrinking volatility in the PI markets and a lack of strong directional momentum.
PI at Make-or-Break Moment
Periods of low volatility often give way to sharp breakouts or breakdowns once momentum returns. If bearish sentiment resurfaces and the $0.47 support level fails, PI could slide to its all-time low of $0.40.
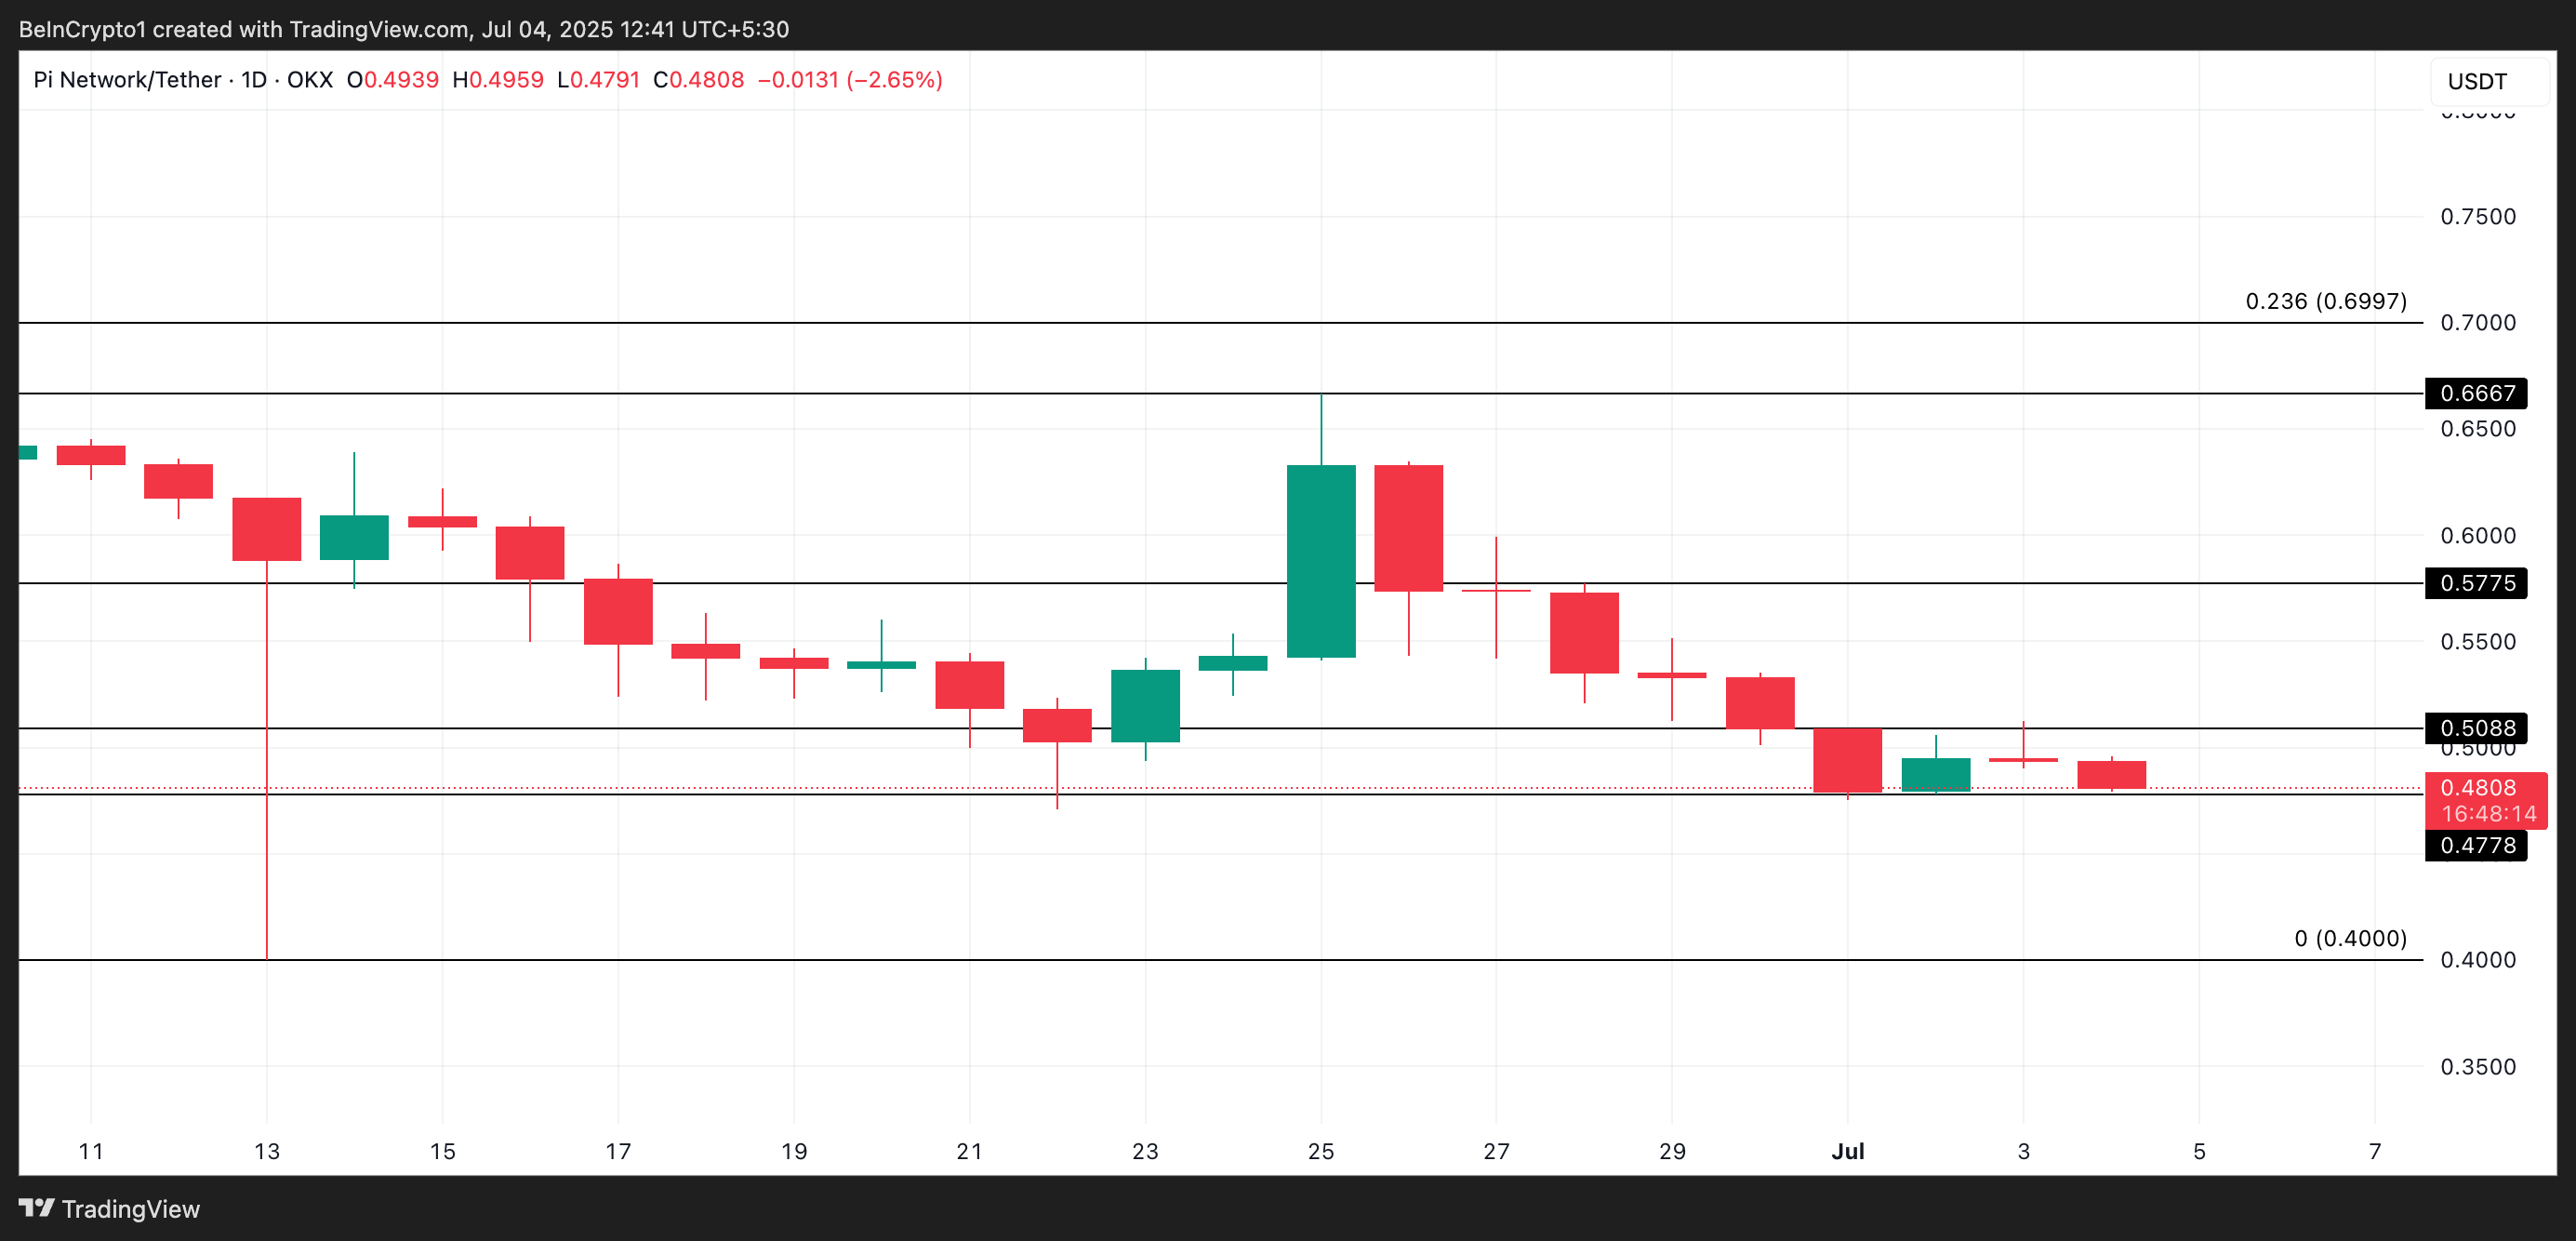
On the other hand, renewed bullish pressure could trigger a breakout above $0.50, with potential upside toward the $0.57 price zone.
