
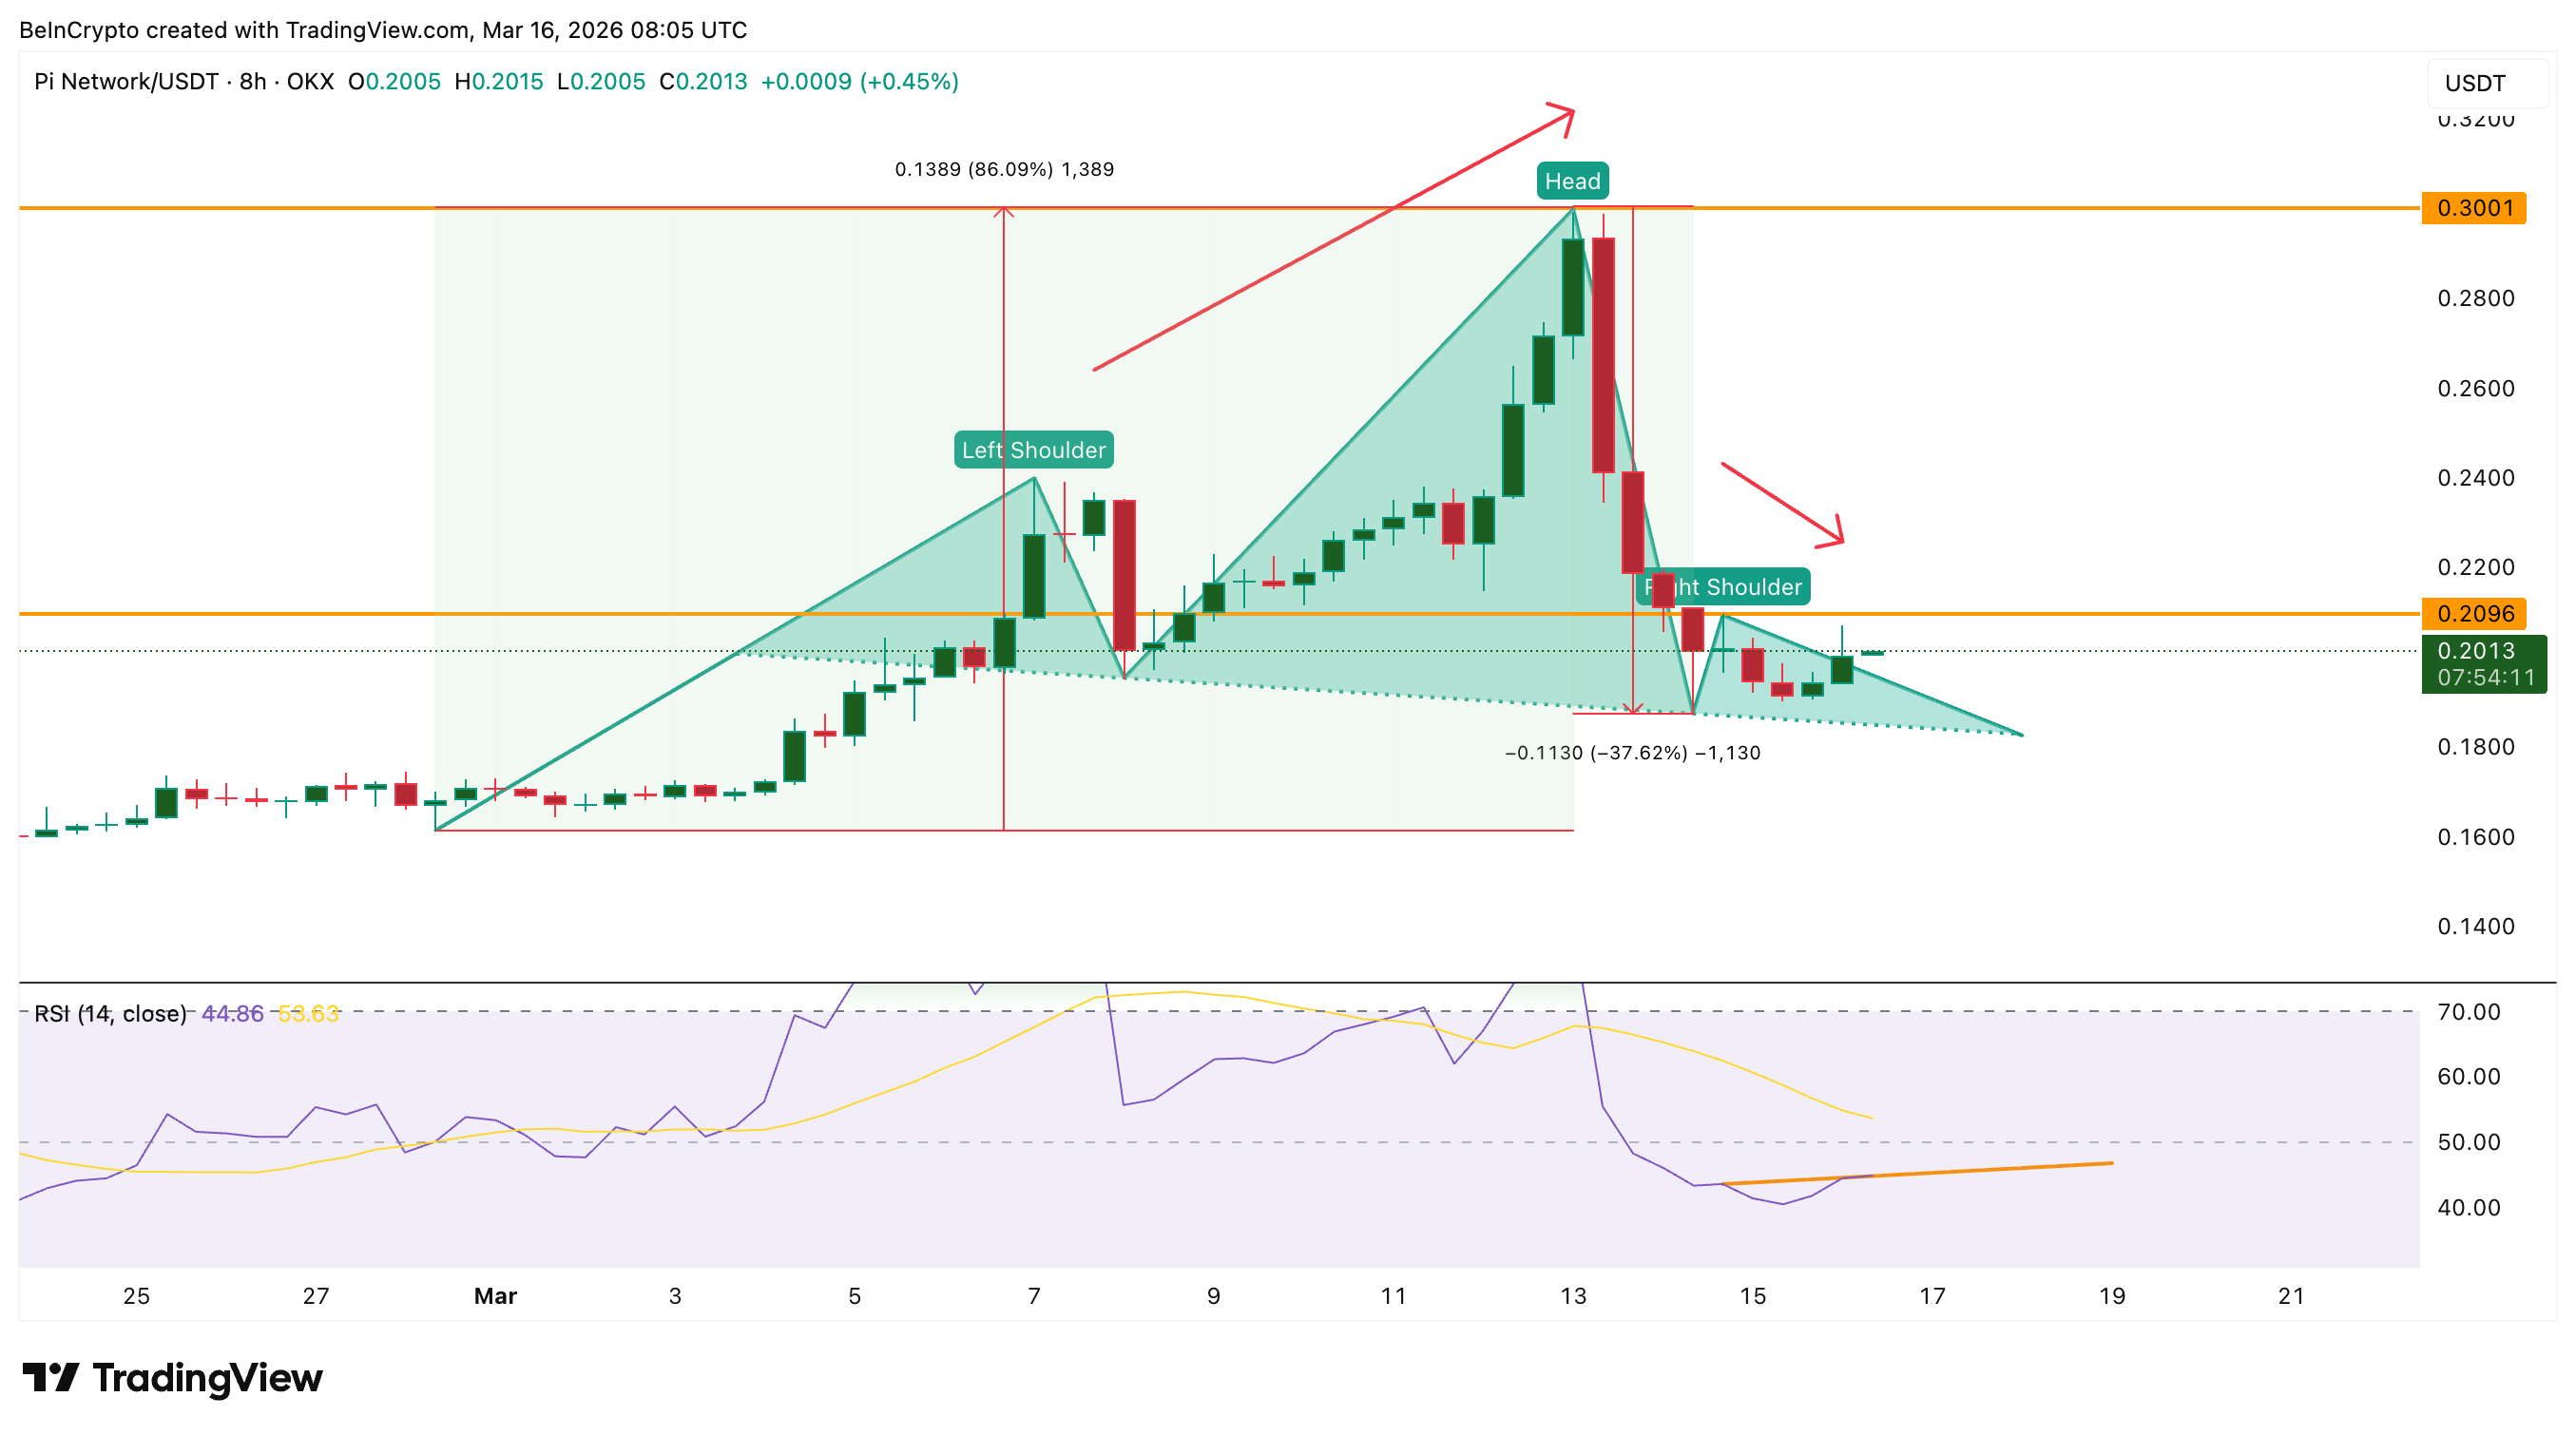
Pi Coin surged nearly 86% between February 28 and March 13, climbing to nearly $0.30. The rally briefly made it one of the strongest movers among smaller crypto tokens.
Momentum, however, shifted quickly. The token dropped about 37% within a day and now trades inside a developing head-and-shoulders pattern, raising the possibility that the rally may be giving way to a deeper correction.
One Divergence Ended Pi Coin’s Rally; Another May Extend the Downtrend
The first warning appeared through a bearish divergence between price and the Relative Strength Index (RSI).
Between March 7 and March 13, the Pi Coin price formed higher highs (new cycle peak at $0.300), while the RSI formed lower highs.
RSI measures the speed and strength of price movements. When the price rises, but the RSI weakens, momentum is usually fading. This is a standard bearish divergence and often points to a trend reversal.
Soon after that divergence appeared, Pi Coin reversed sharply. The token dropped around 37% in a single day, confirming that buying pressure had weakened. Now another signal may be forming.
Want more token insights like this? Sign up for Editor Harsh Notariya’s Daily Crypto Newsletter here.
Between March 14 and March 16, Pi Coin’s price has formed a lower high, while RSI appears to be forming a higher high. If confirmed, this setup would create a hidden bearish divergence, which often signals continuation of the existing downtrend.
In other words, the earlier divergence likely ended the rally, while this new signal could extend the decline.
But technical momentum rarely changes alone. To understand why the rally lost strength so quickly, it helps to examine how market sentiment shifted during the peak.
Pi Coin Sentiment Just Hit a Six-Month High, and History Shows What Happened Next
Market sentiment around Pi Coin surged sharply during the rally. On March 13, positive sentiment climbed to 12, the highest level in six months. Such spikes often occur when optimism becomes excessive near price tops.
The last time sentiment crossed 10 was on September 23, when Pi Coin traded near $0.27. Soon after that sentiment peak, the price fell to roughly $0.198 by mid-October, marking a decline of about 26%.
A similar pattern followed.
Following the March sentiment spike, Pi Coin dropped from nearly $0.30 to around $0.20, representing roughly a 37% decline from the peak, noticeably deeper than the September 2025 drop, all thanks to the bearish pattern.
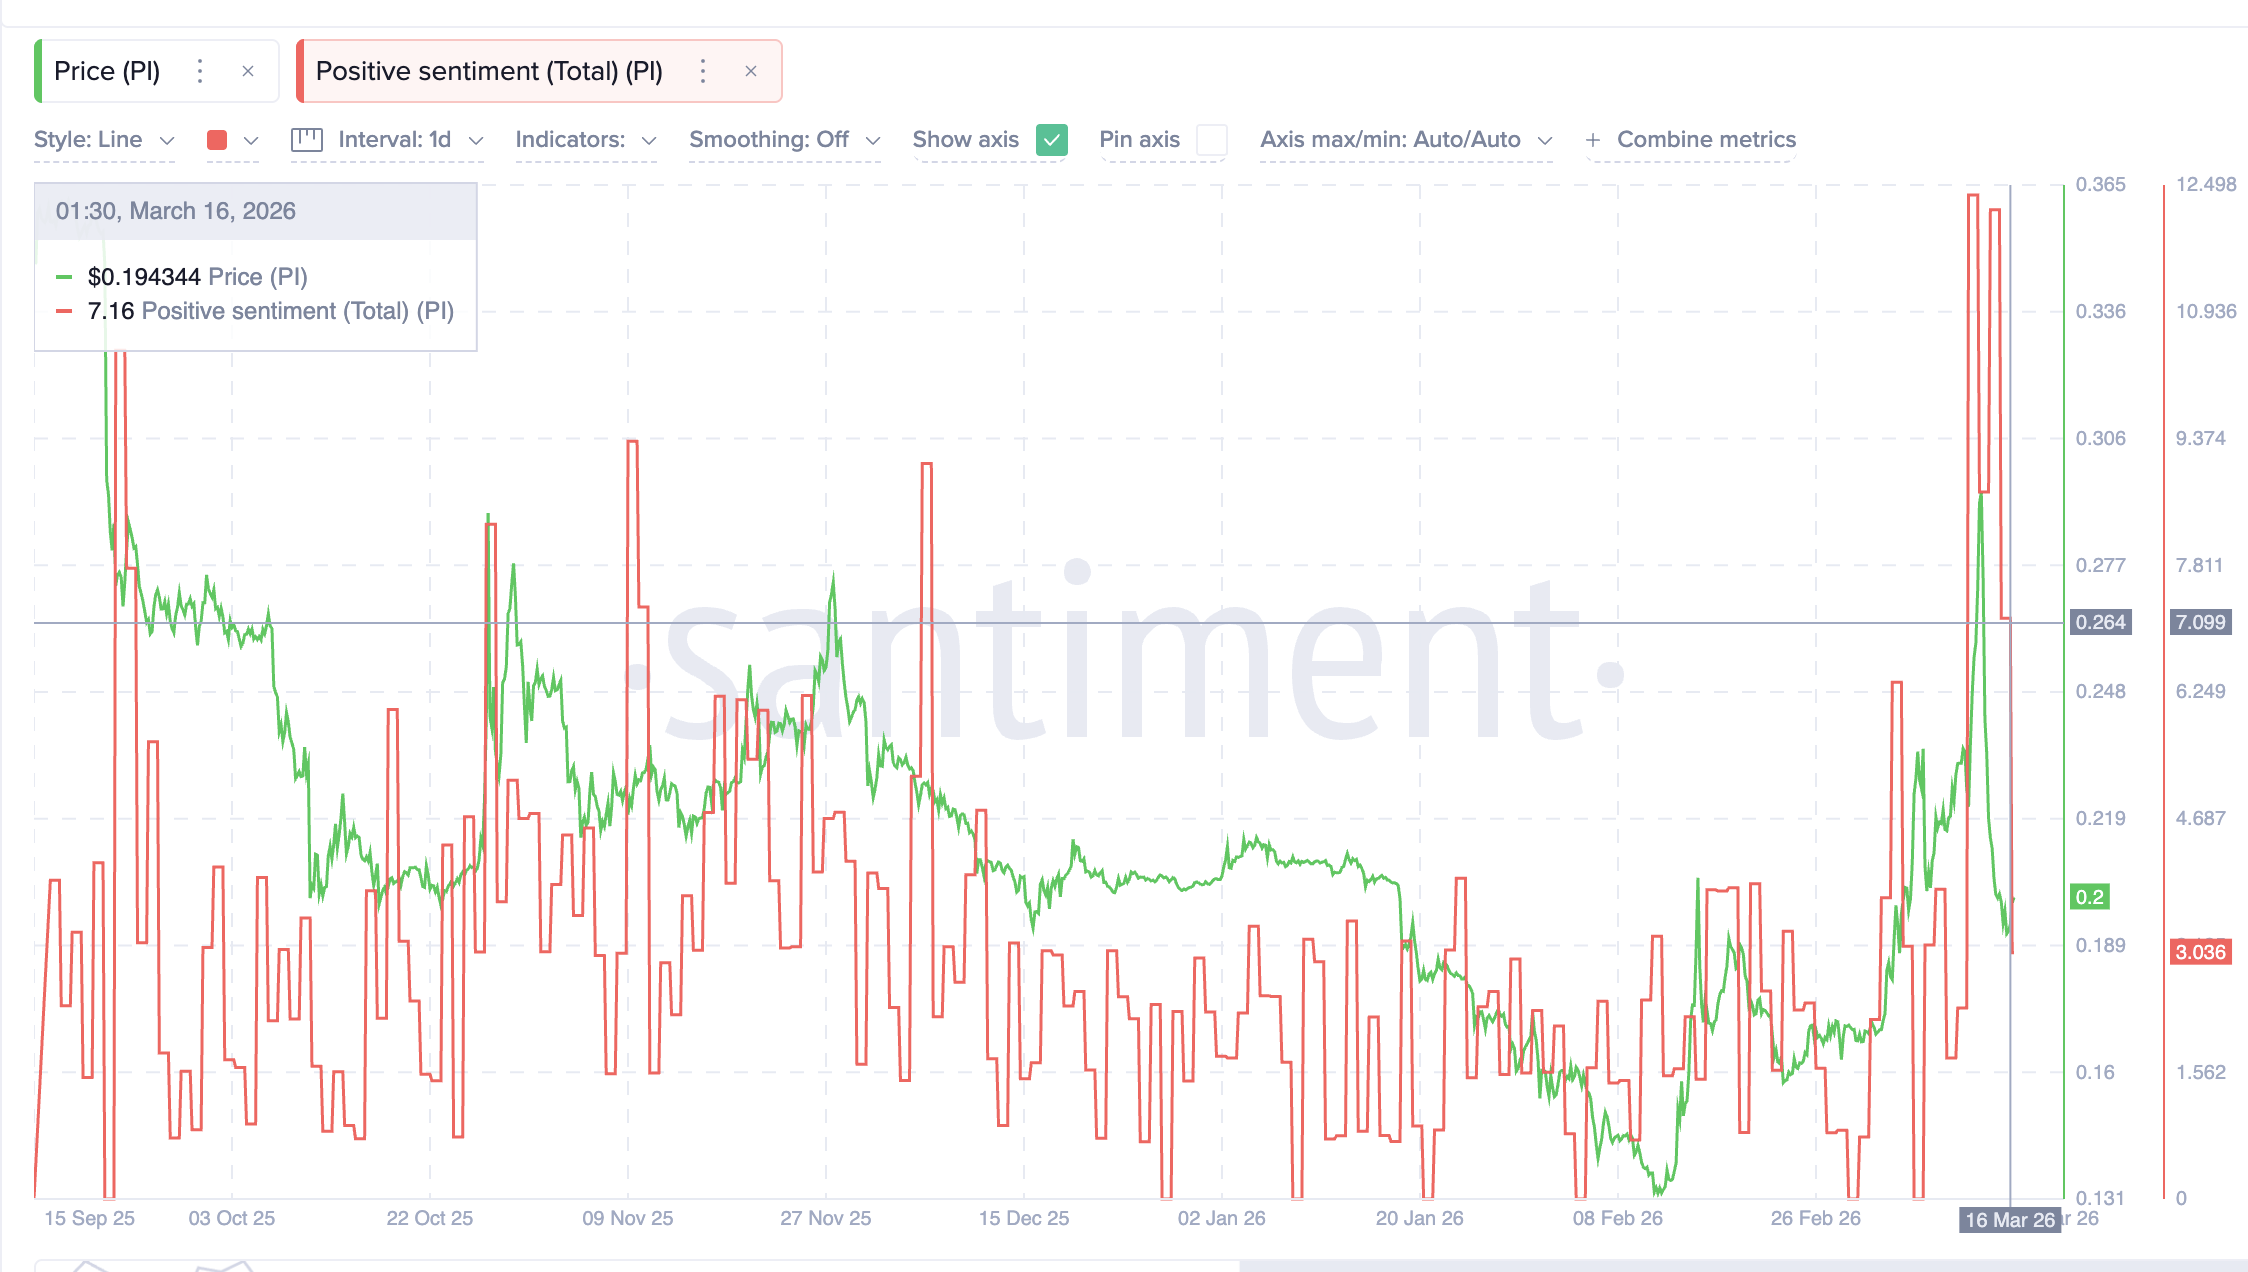
Sentiment has also weakened quickly. After briefly rebounding to around 7 on March 16, the score dropped again to roughly 3, signaling fading optimism among traders.
When sentiment fades while price continues forming a bearish chart pattern, traders often shift their focus to the broader market for recovery hopes.
Weak Bitcoin Correlation And Smart Money Positioning Leave Pi Coin Exposed
Another factor weakening Pi Coin’s recovery is its fading relationship with Bitcoin.
Over the past month, the correlation between Pi Coin and Bitcoin has dropped to roughly 0.04, which effectively means the two assets are moving independently. Correlation measures how closely two assets move together. Values near 1 indicate strong alignment, while values close to zero suggest almost no relationship.
This matters because Bitcoin typically acts as the liquidity engine for the broader crypto market. When Bitcoin rallies (which it currently is), smaller tokens often benefit from the inflow of capital and positive sentiment.
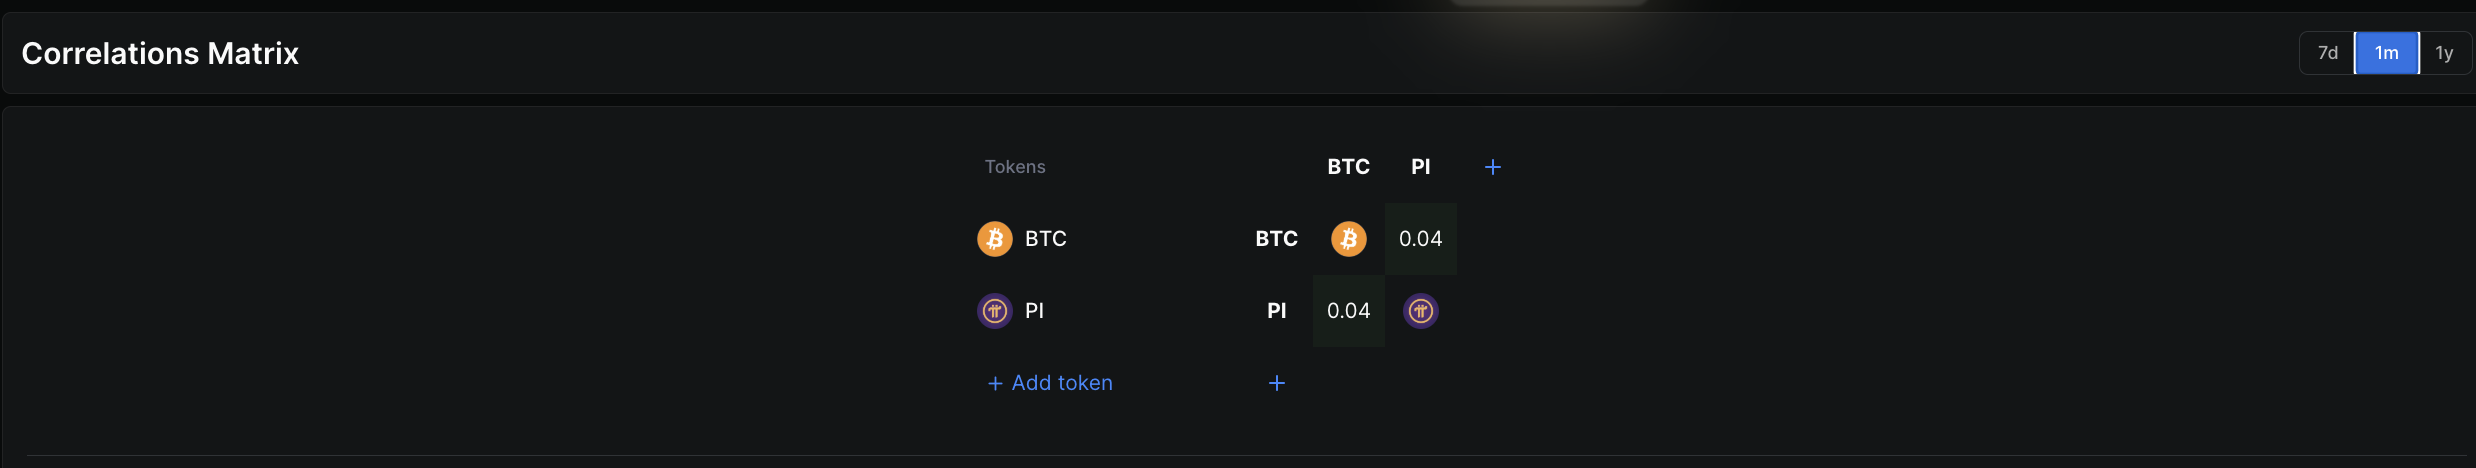
However, Pi Coin’s near-zero correlation suggests the token may not benefit from Bitcoin’s recent strength. Even as Bitcoin has moved higher, Pi Coin has struggled to regain momentum after its March peak.
With sentiment fading and momentum weakening, the lack of correlation means Bitcoin’s rally may not provide the support Pi Coin would normally receive. But that’s not all. The Smart Money Index, which tracks the positioning of informed traders, seems to be aware of this lack of correlation. They started moving out when the Pi Network token peaked on March 13 and has been trending lower than the signal line.
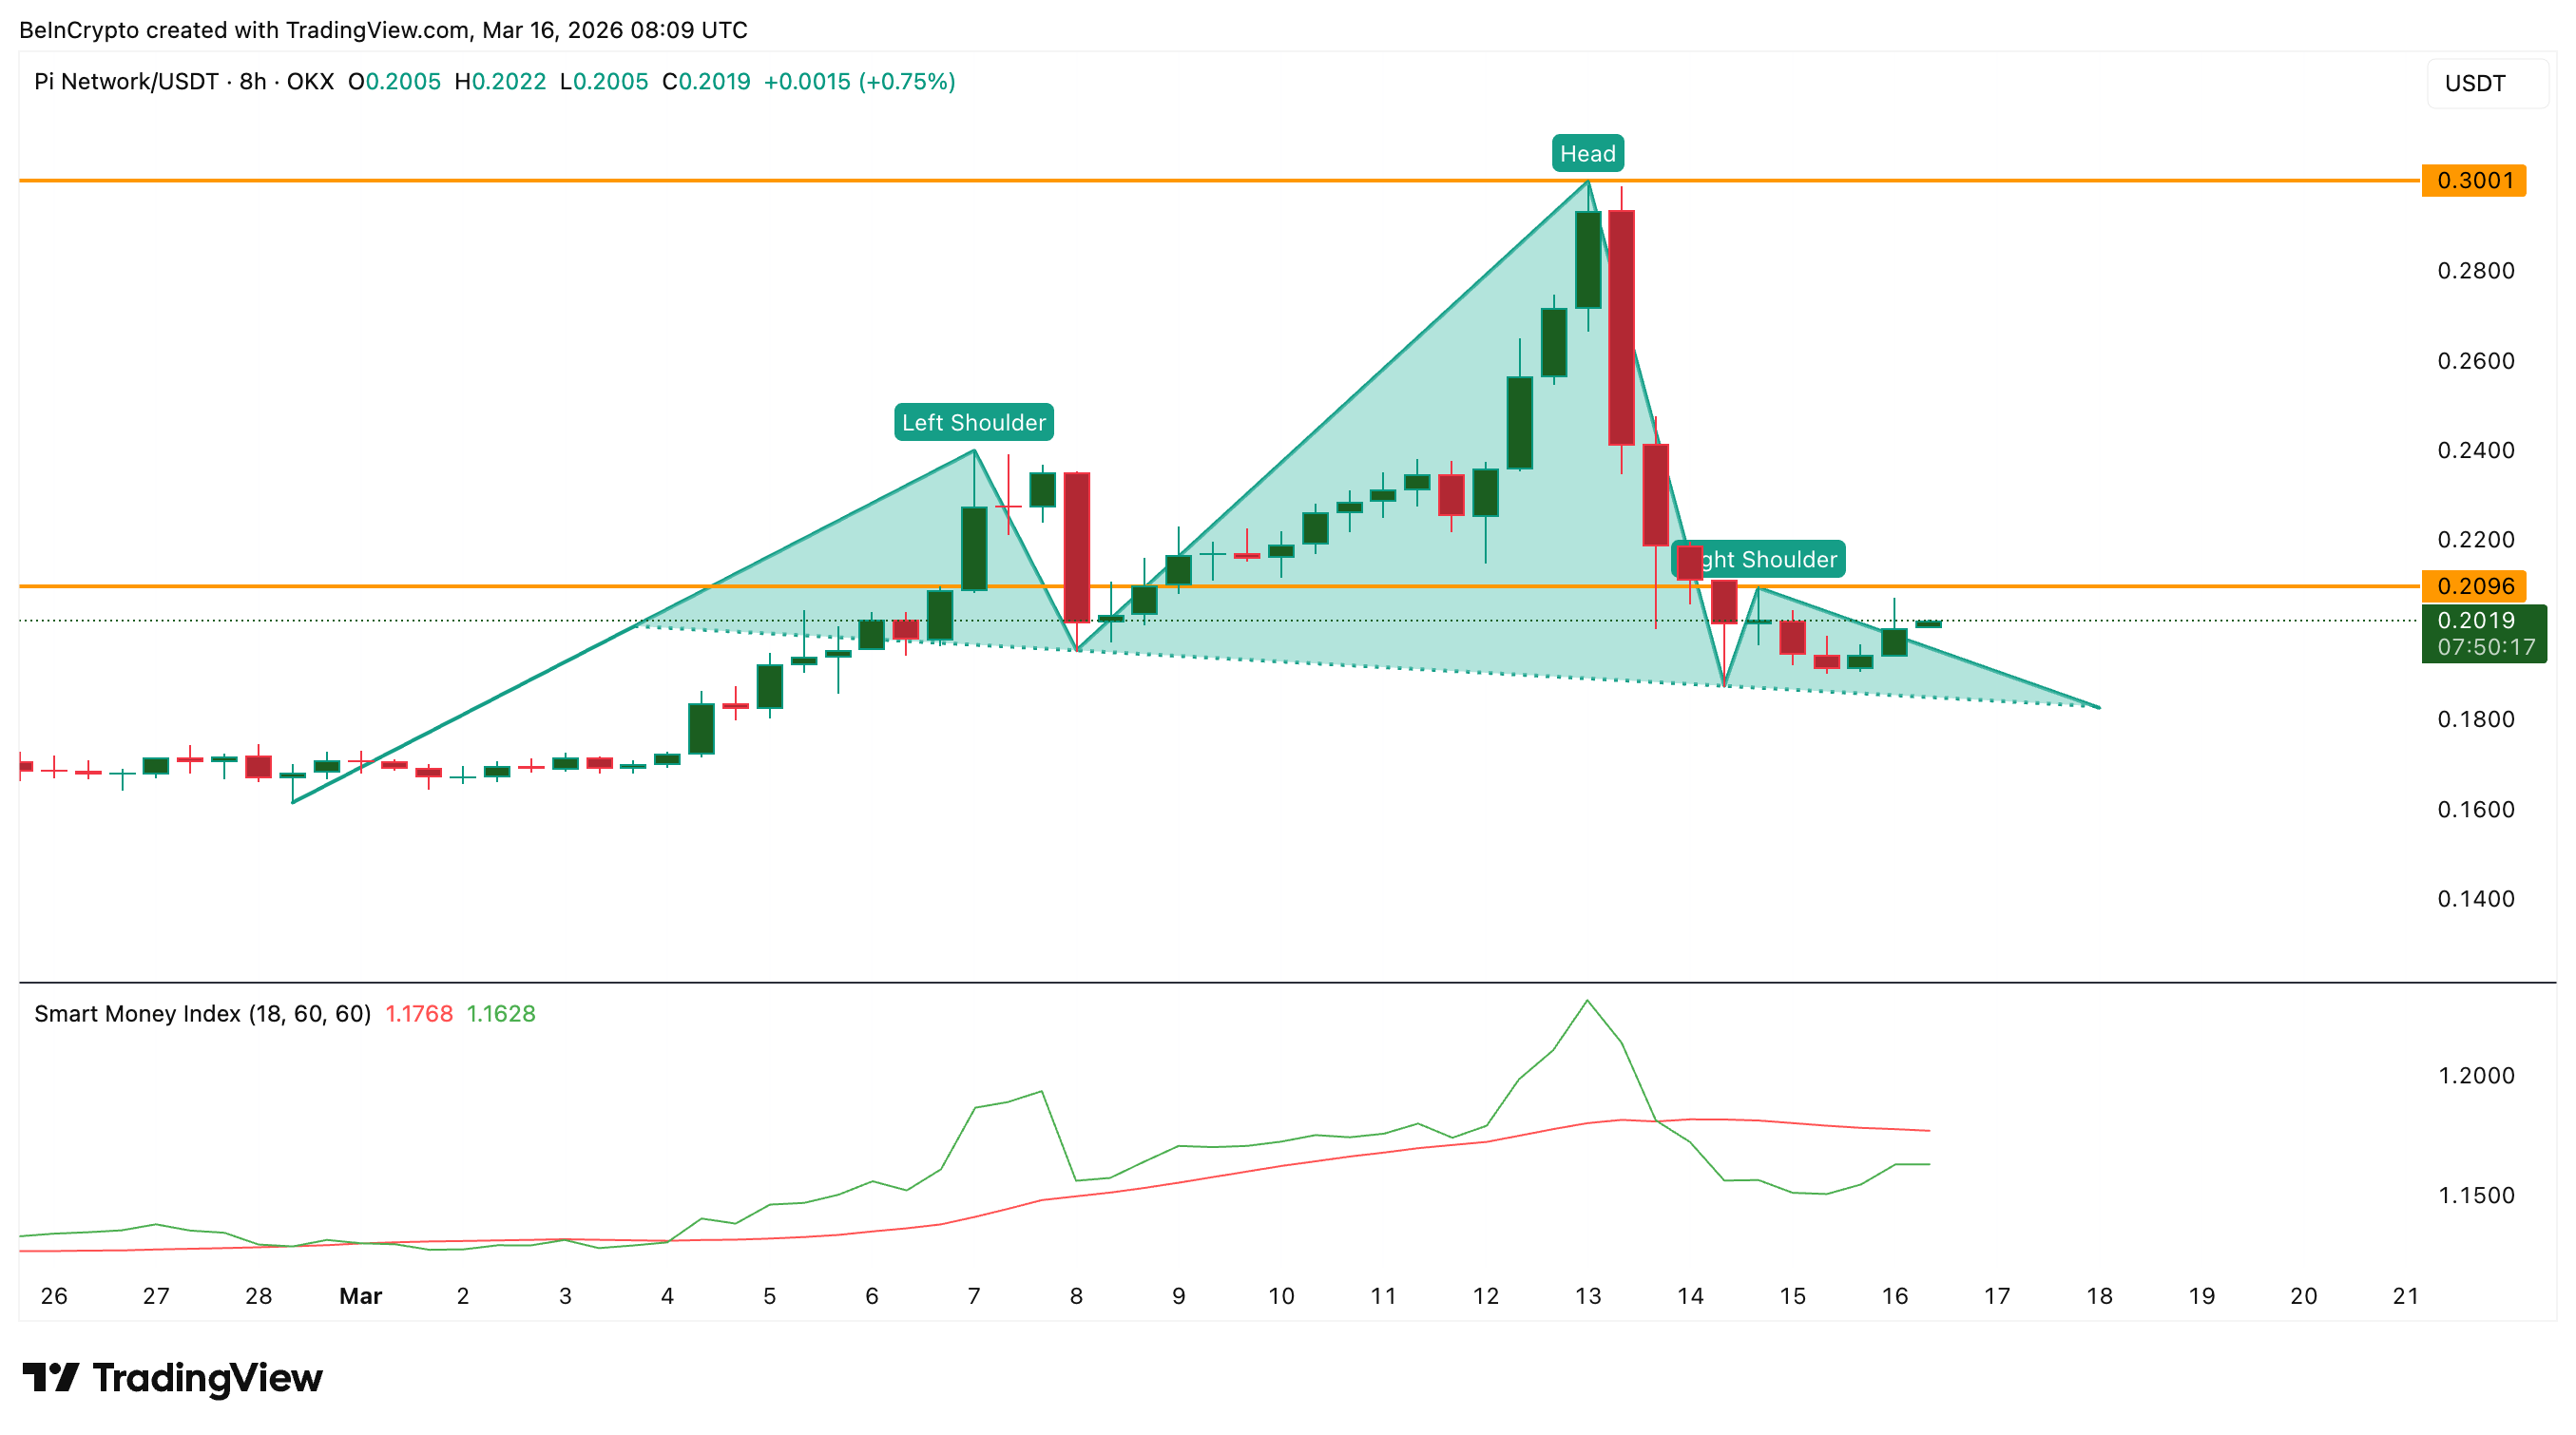
This shows that even the most informed traders aren’t expecting a bounce, yet. That shifts the focus back to the key technical levels that could determine whether the correction deepens further.
Key Pi Coin Price Levels And Positioning Now Amplify the Bottom Risk
Pi Coin currently trades within a head-and-shoulders pattern.
The first level to watch on the upside sits near $0.209. A clean 8-hour close above this level could allow a short-term rebound. However, even a move toward this level would still keep the right-shoulder structure intact.
Only a decisive move above $0.300, the level corresponding to the pattern’s head, would invalidate the bearish structure and signal a broader trend reversal. Until that happens, rallies may remain limited.
On the downside, the most critical support lies near $0.183. If Pi Coin breaks below this level, the head-and-shoulders pattern could trigger its measured move.
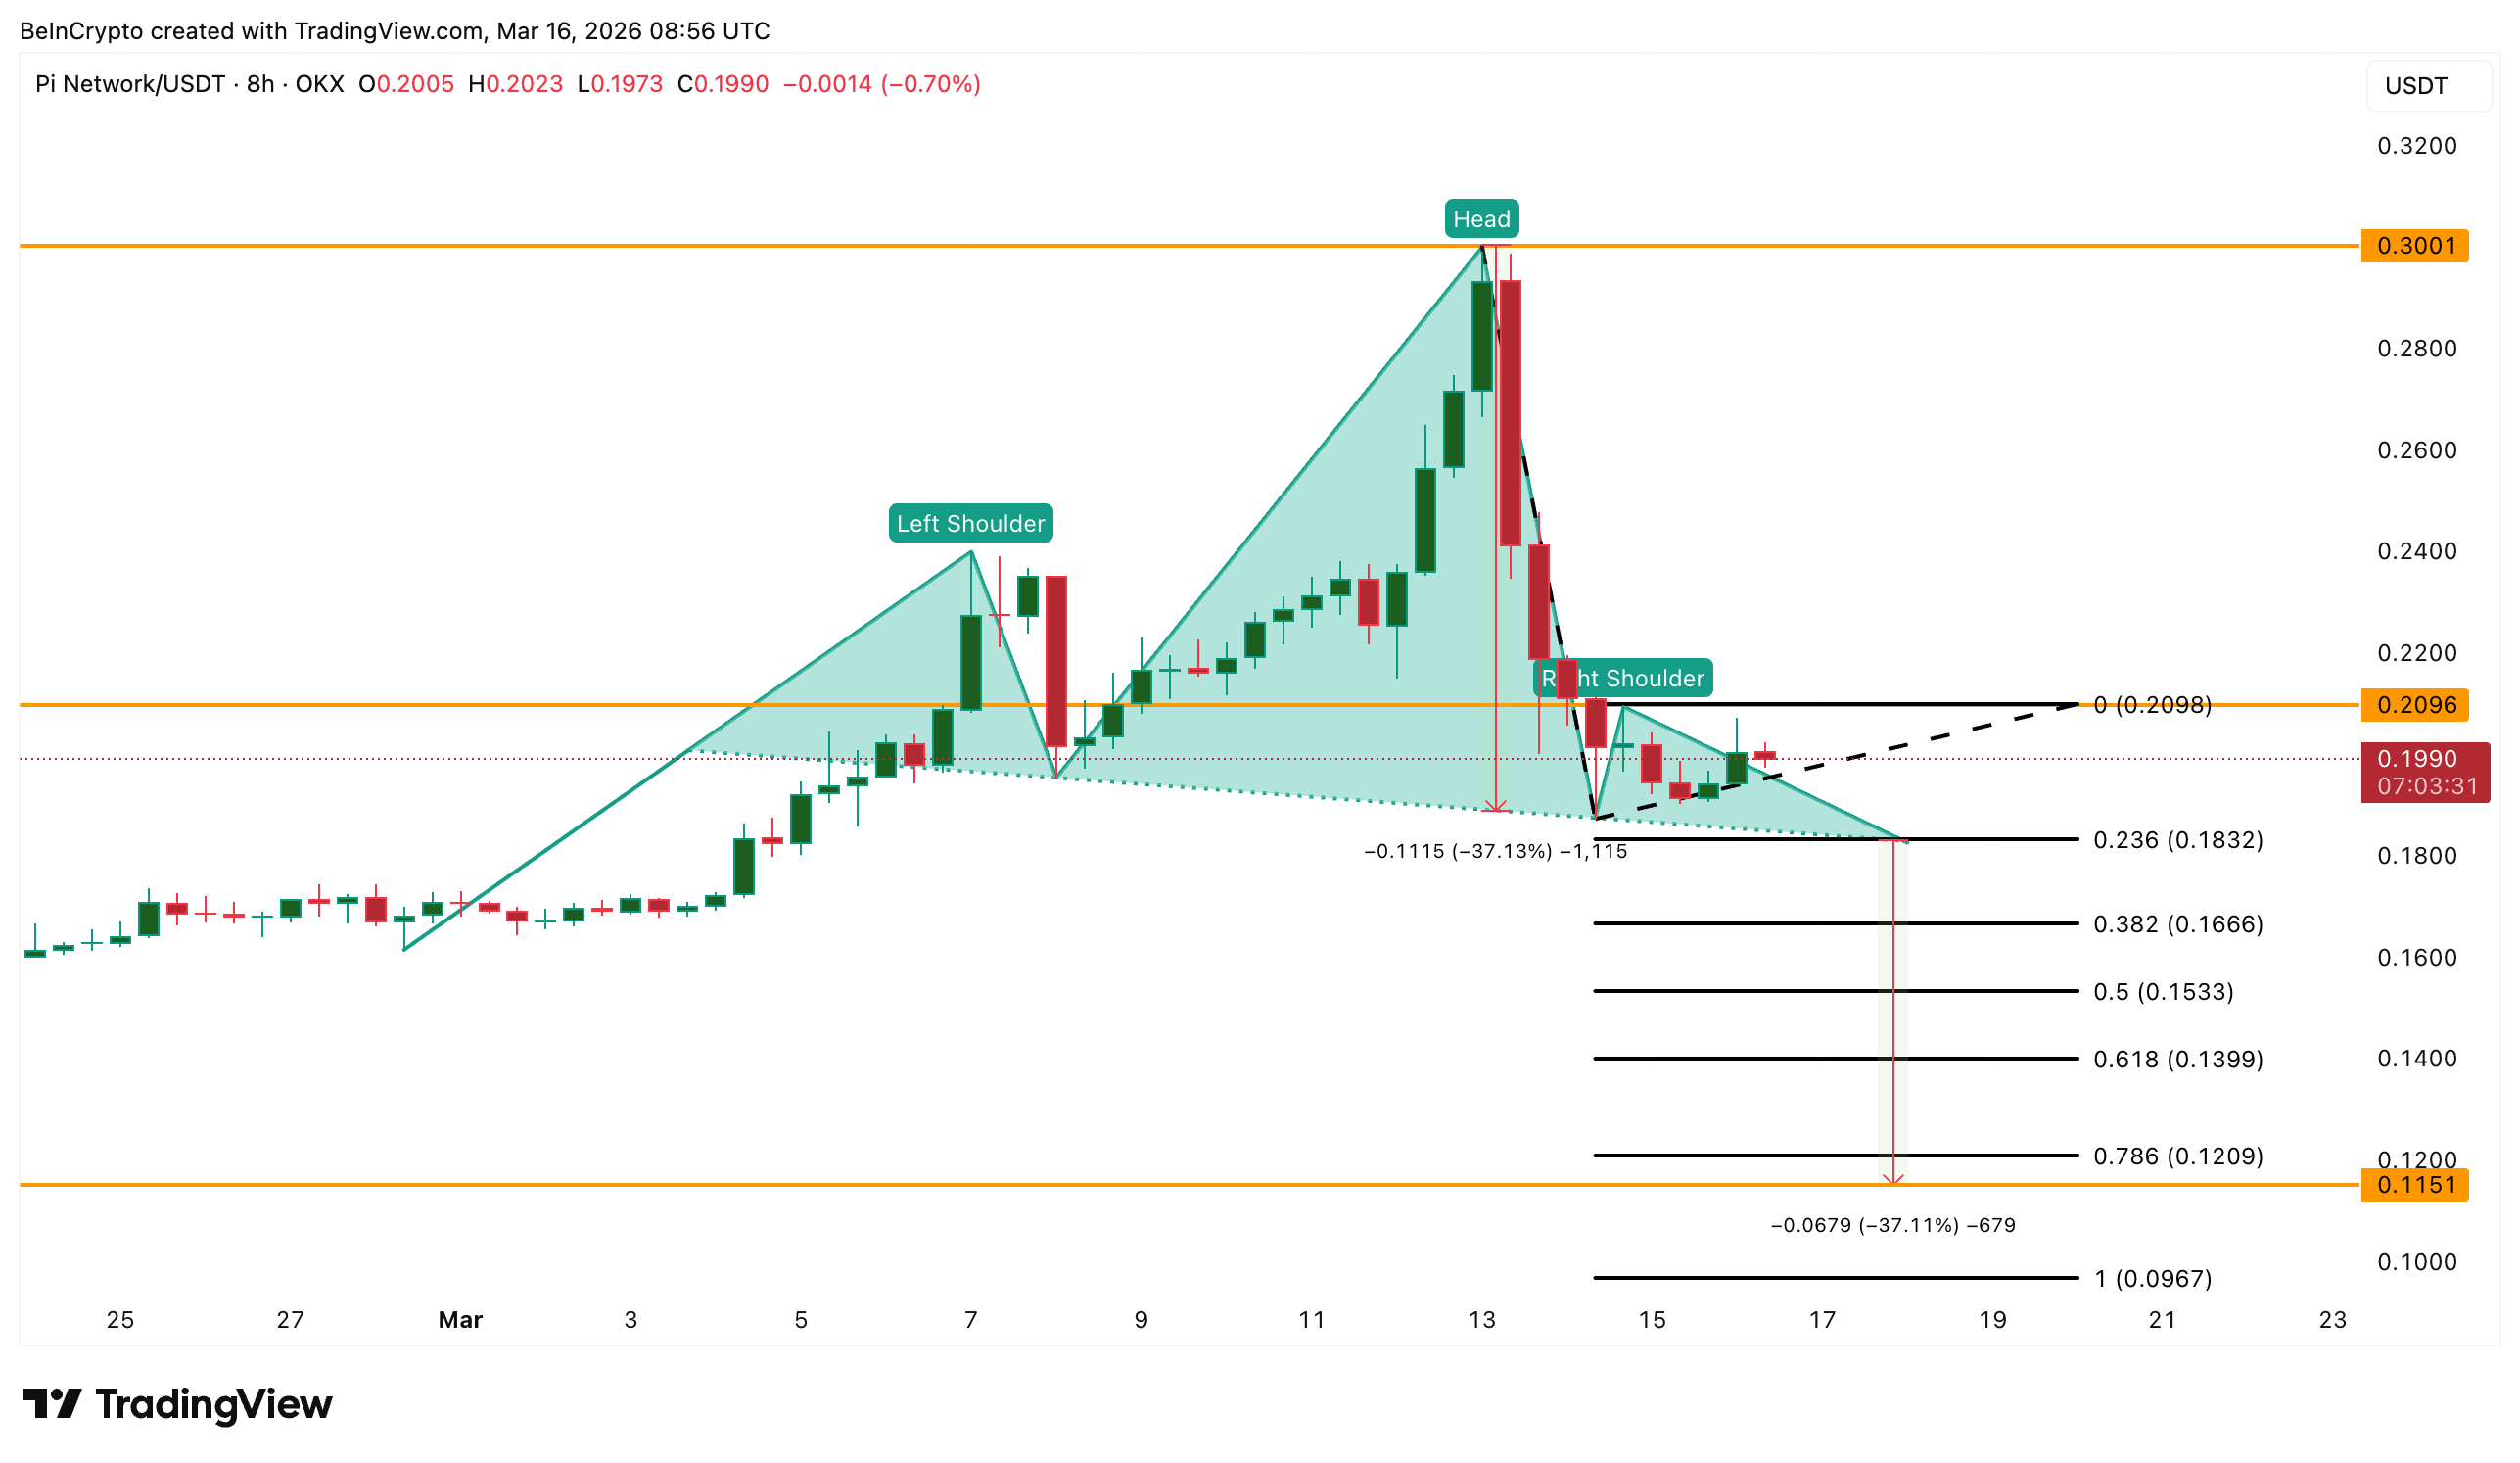
That projection suggests a potential decline toward roughly $0.115, which would push Pi Coin below its current all-time low and create a fresh bottom for the token.
For now, Pi Coin’s shift from an 86% rally to renewed downside pressure highlights how quickly momentum and sentiment can reverse in volatile crypto markets.
