


The Perlin (PERL) price has lost more than 80% of its value since its August highs. While the price has returned to an important support level, there are no definite bullish reversal signs in place yet.
After a similar decrease, Coti (COTI) also reached an important support level and has shown some bullish reversal signs.
PERL Drops Significantly
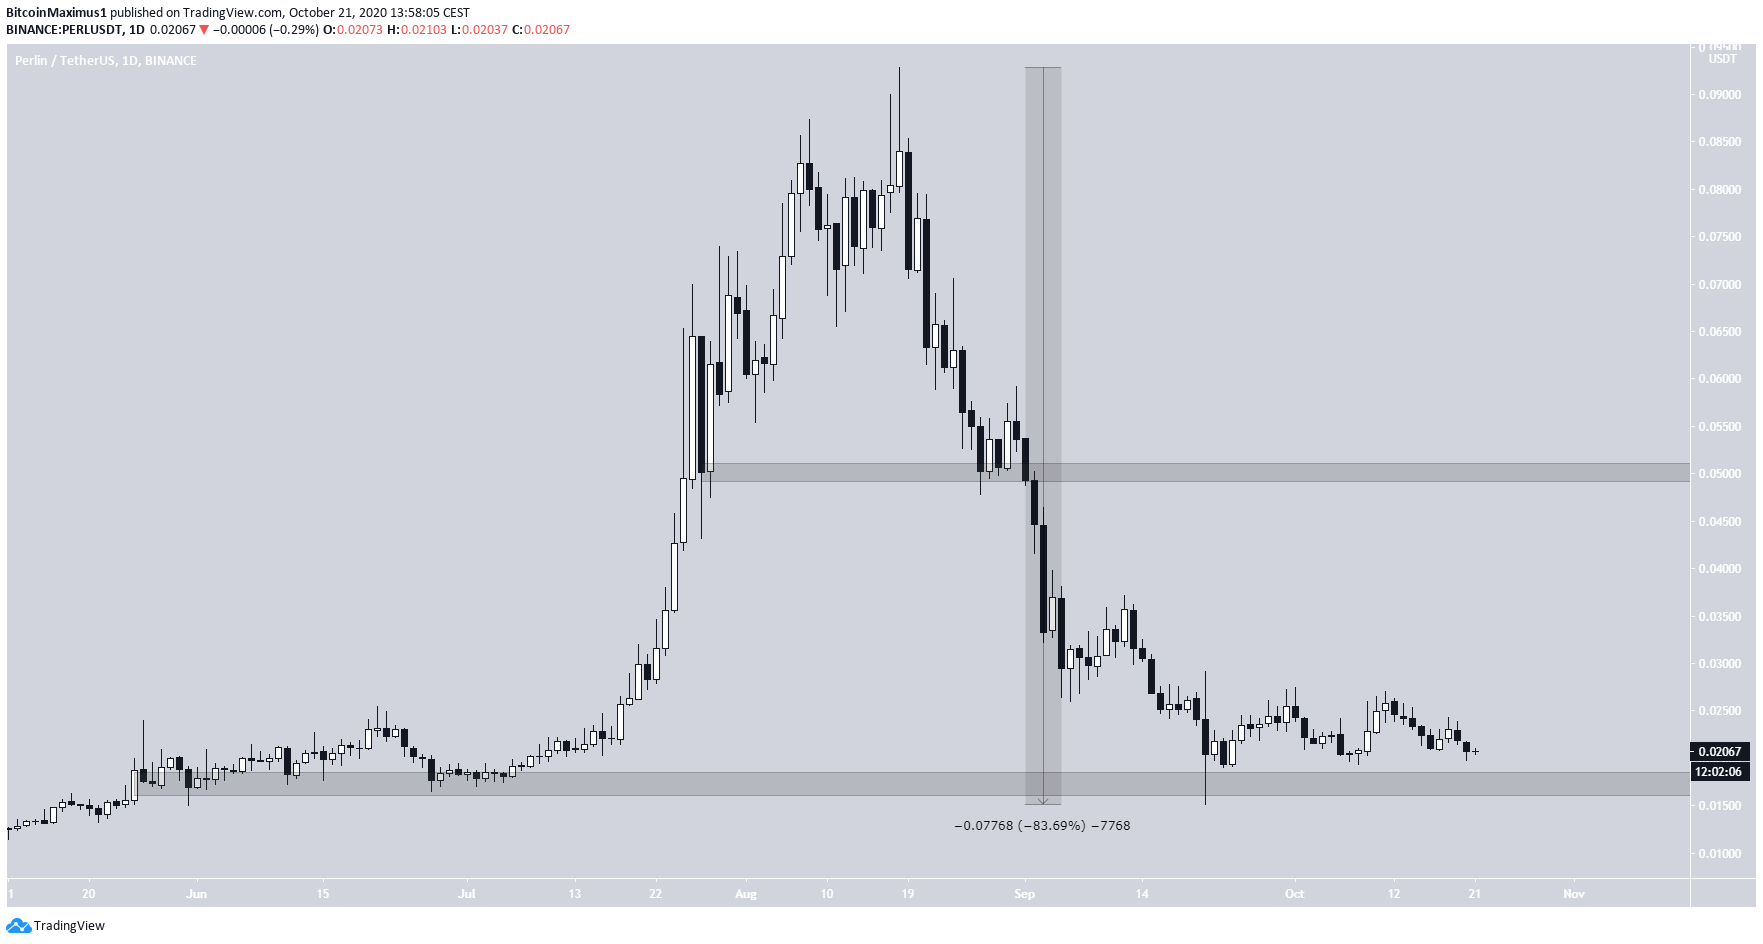
Since it reached a high of $0.098 on Aug 18, PERL has been subject to a significant drop that culminated in a low of $0.015 on Sept 21. This makes for an 83.69% decrease from the aforementioned high.
Since then, the price has been trading very close to the long-term $0.018 support area, which has not been broken since May. If the price were to begin an upward move, the closest significant resistance area would be found at $0.05.
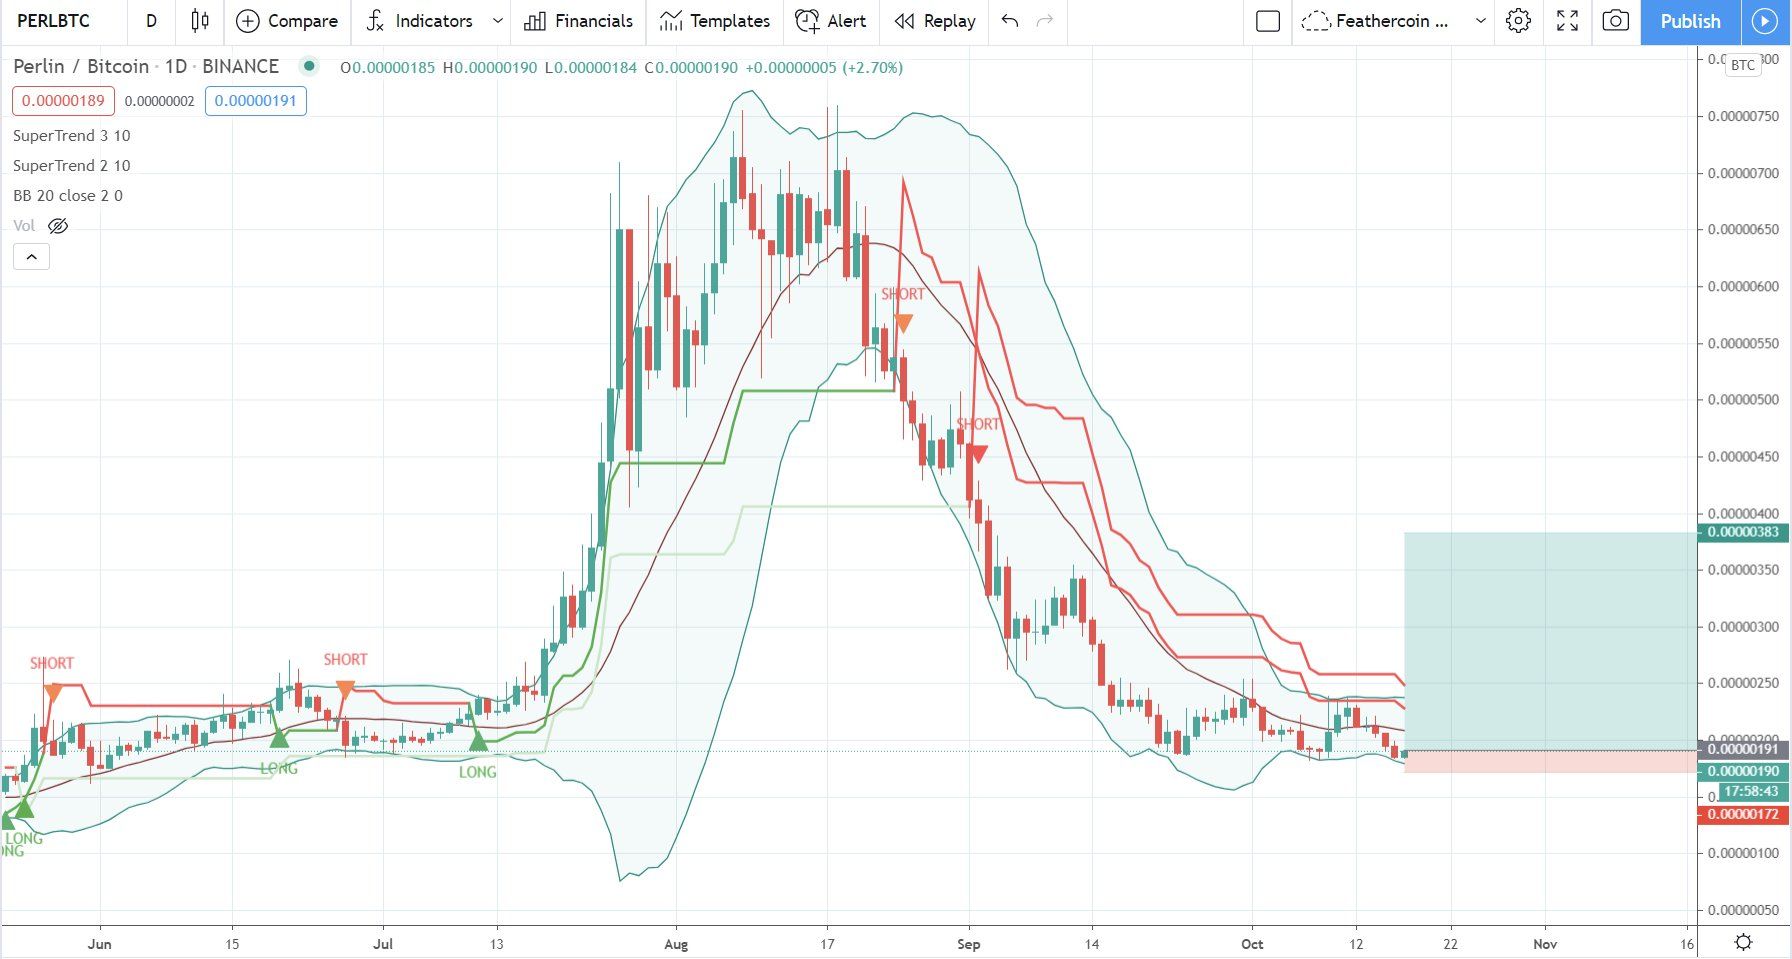
Cryptocurrency trader @Incomesharks outlined a PERL chart, stating that the current price offers a decent opportunity to catch what is likely the bottom.
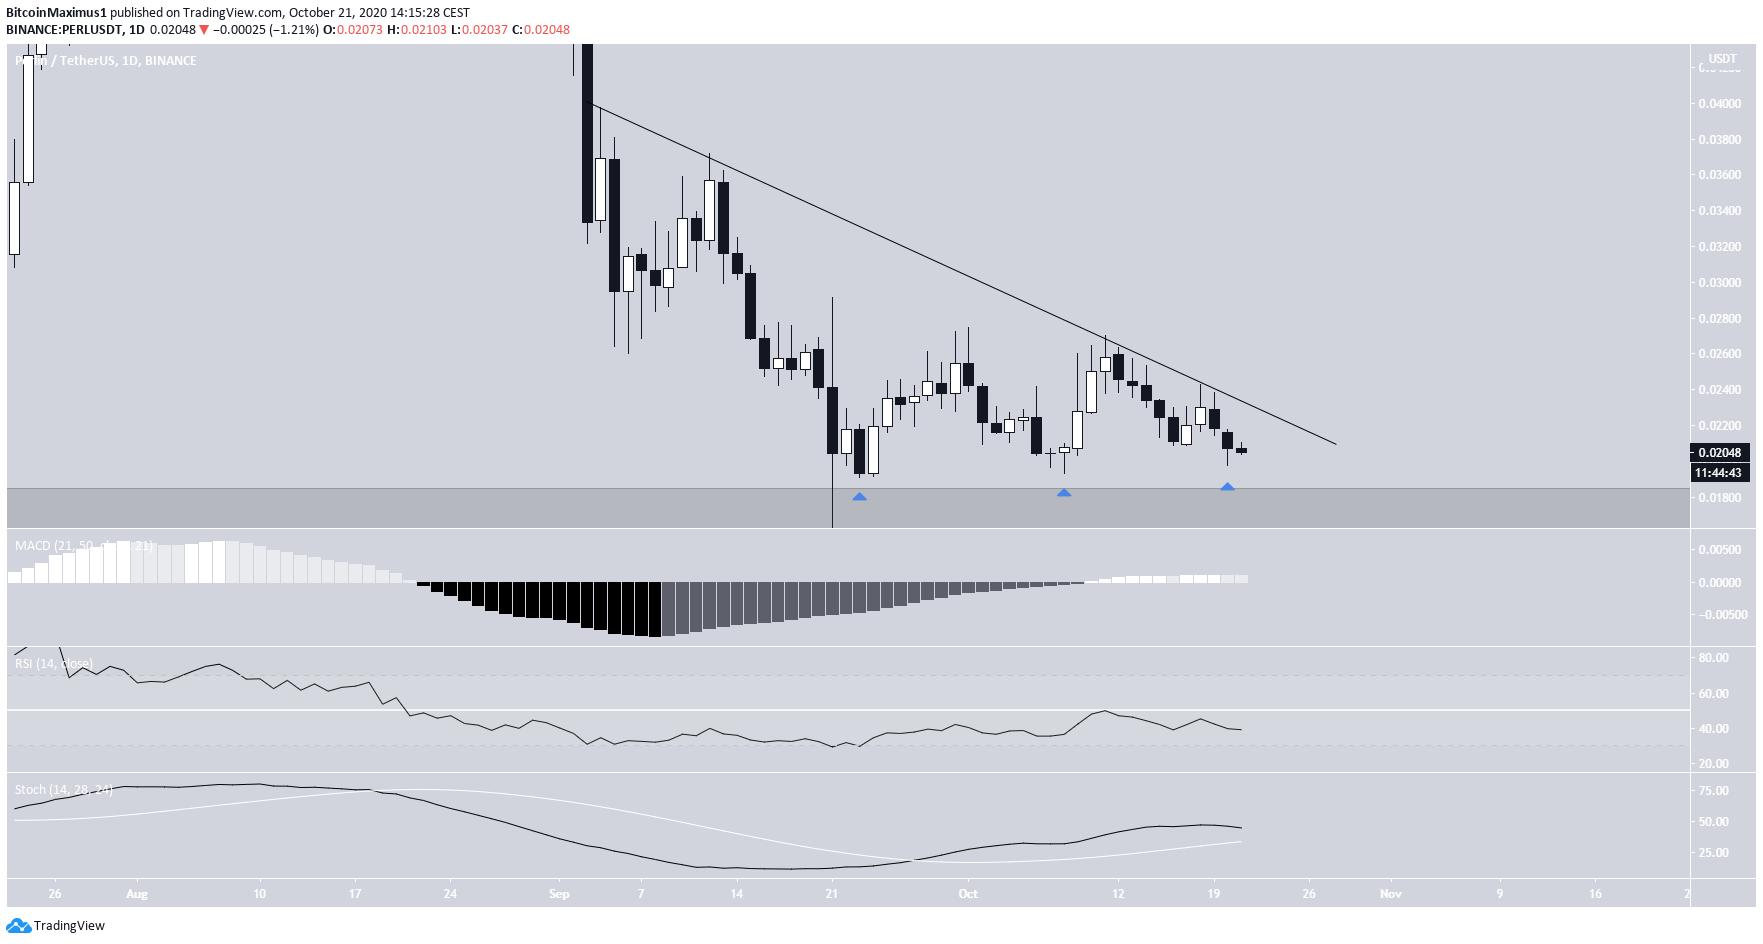
Despite being near a strong support area, the price has not given definite bullish reversal signs. While there is a possible triple-bottom pattern being created, it has not been confirmed yet nor is it combined with any type of bullish divergence.
Furthermore, the RSI is below 50 and the MACD has seemingly lost its strength.
While a breakout above the current descending resistance line would be a sign that the price will likely head upwards, currently there are no signals that this will happen anytime soon.
COTI Drops to Support
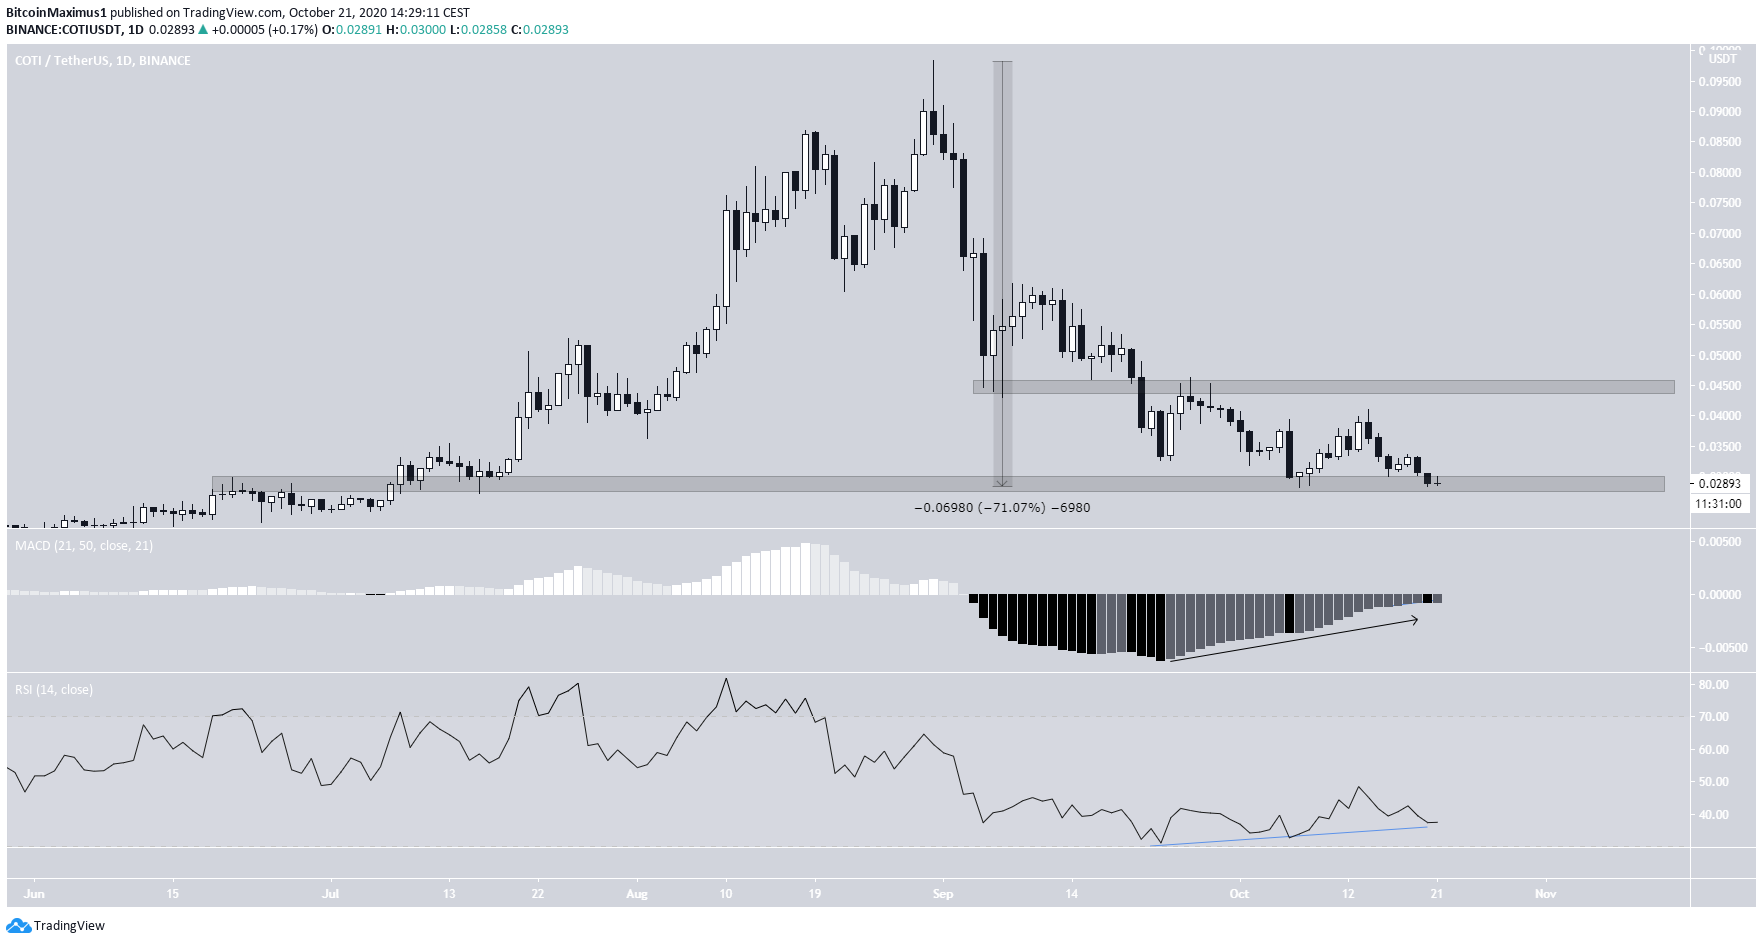
Similarly, the COTI price has lost over 70% of its value since it reached a high of $0.098 on Aug 21. The decrease culminated with a low of $0.028, reached on Oct 7.
COTI is trading inside a significant support area at $0.0285 where it has possibly created a double-bottom. The pattern has been combined with a considerable bullish divergence in both the RSI and MACD, indicating a likely upward move.
If the price begins to increase, the closest resistance area would be found at $0.045.
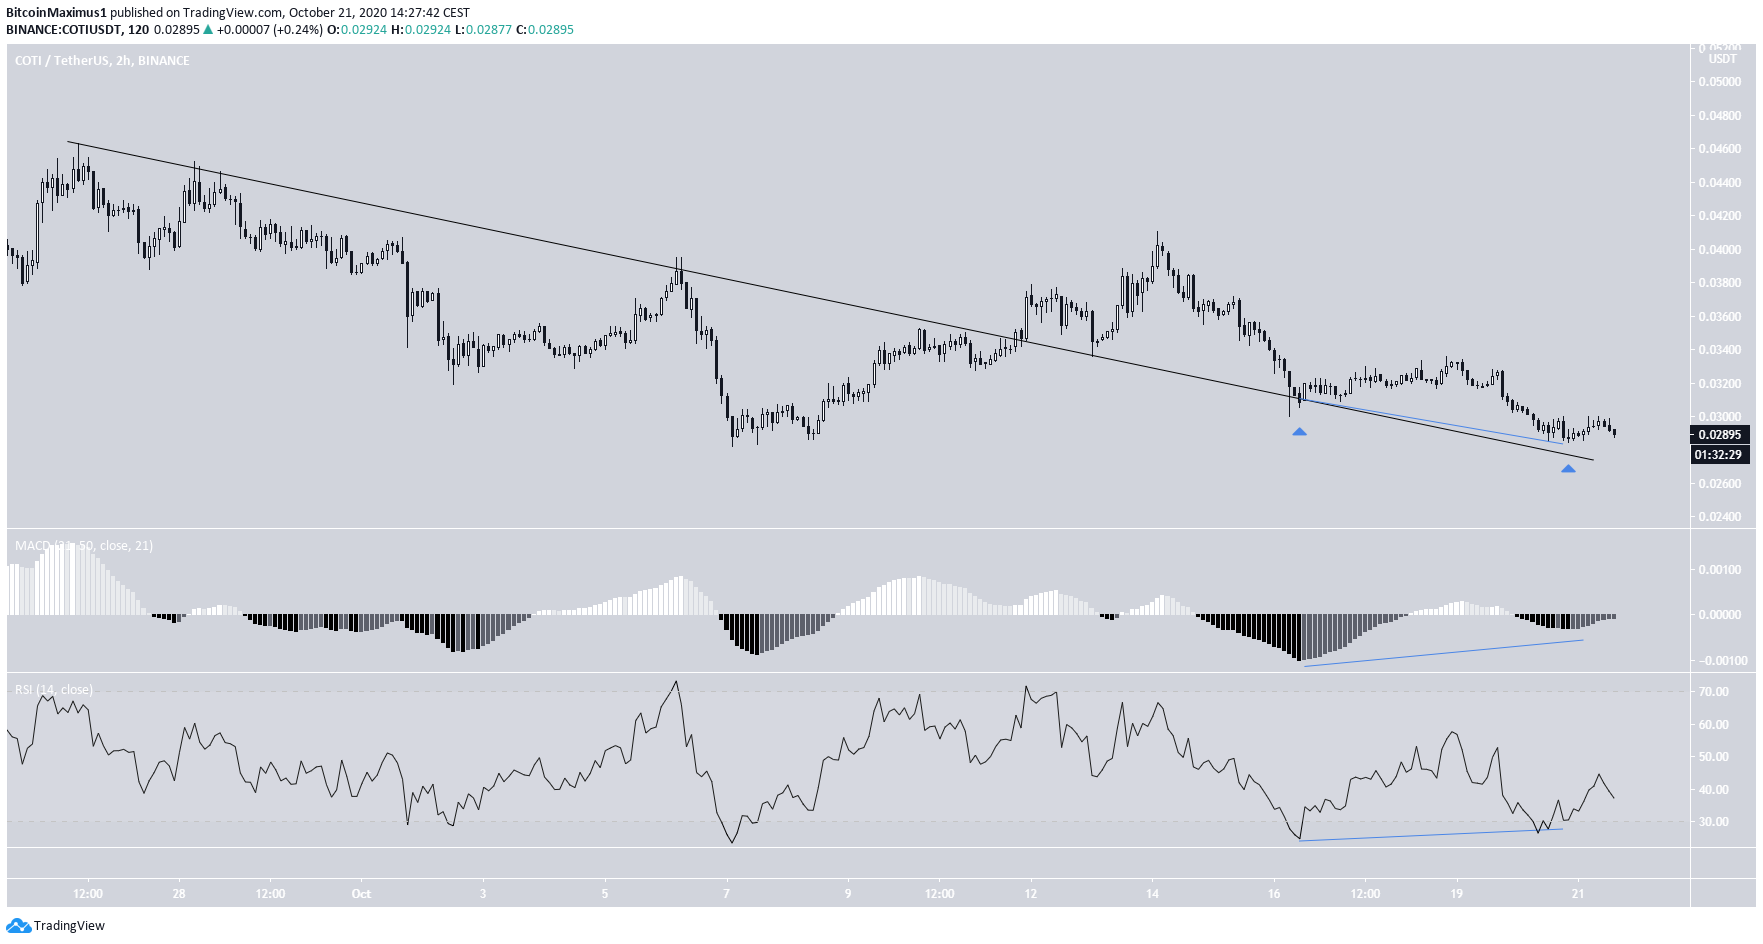
The shorter-term 2-hour chart shows a breakout from a descending resistance line and its validation as support afterward.
The movement has also been combined with a bullish divergence in both the RSI and MACD, supporting the possibility that the price will soon begin to move up.
For BeInCrypto’s previous Bitcoin analysis, click here!
Disclaimer: Cryptocurrency trading carries a high level of risk and may not be suitable for all investors. The views expressed in this article do not reflect those of BeInCrypto.


