


The Chainlink (LINK) price has generated long-term bullish reversal signs. A breakout from the short-term resistance line could accelerate the rate of increase.
LINK is the native token of the Chainlink network. It connects smart contracts with each other through a decentralized oracle network. The network is supported by node operators, data providers, and smart contract developers.
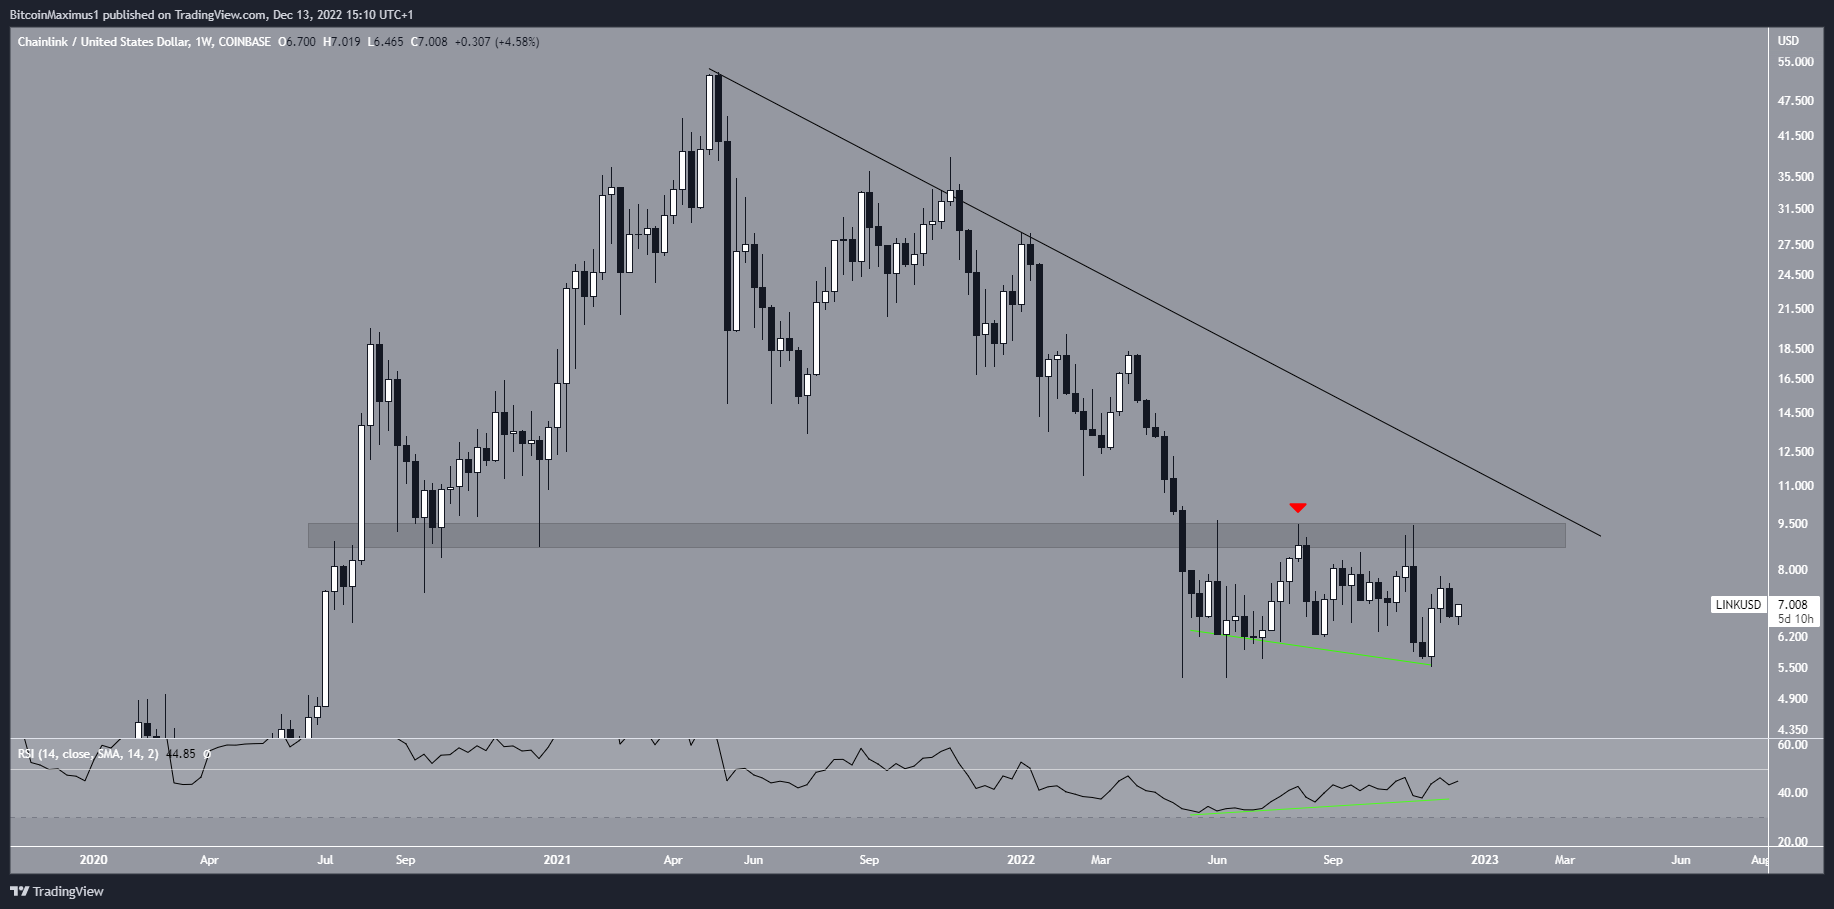
The Chainlink price has decreased since its $53 all-time high in May 2021. So far, it reached a low of $5.30 in June 2022.
Since then, the Chainlink price has made several unsuccessful attempts (red icons) at breaking out above the $9 resistance area. Despite the rejections, the LINK price never fell below its June lows.
The bullish divergence in the weekly RSI (green line) is a very gripping development. The divergence is occurring for the first time in Chainlink’s price history.
This catalyzed an upward movement toward the $9 resistance area and suggests the future price movement may be bullish.
If Chainlink reclaims the $9 area and breaks out from the descending resistance line, it would confirm that the trend is bullish.
Will Chainlink Break Out Successfully?
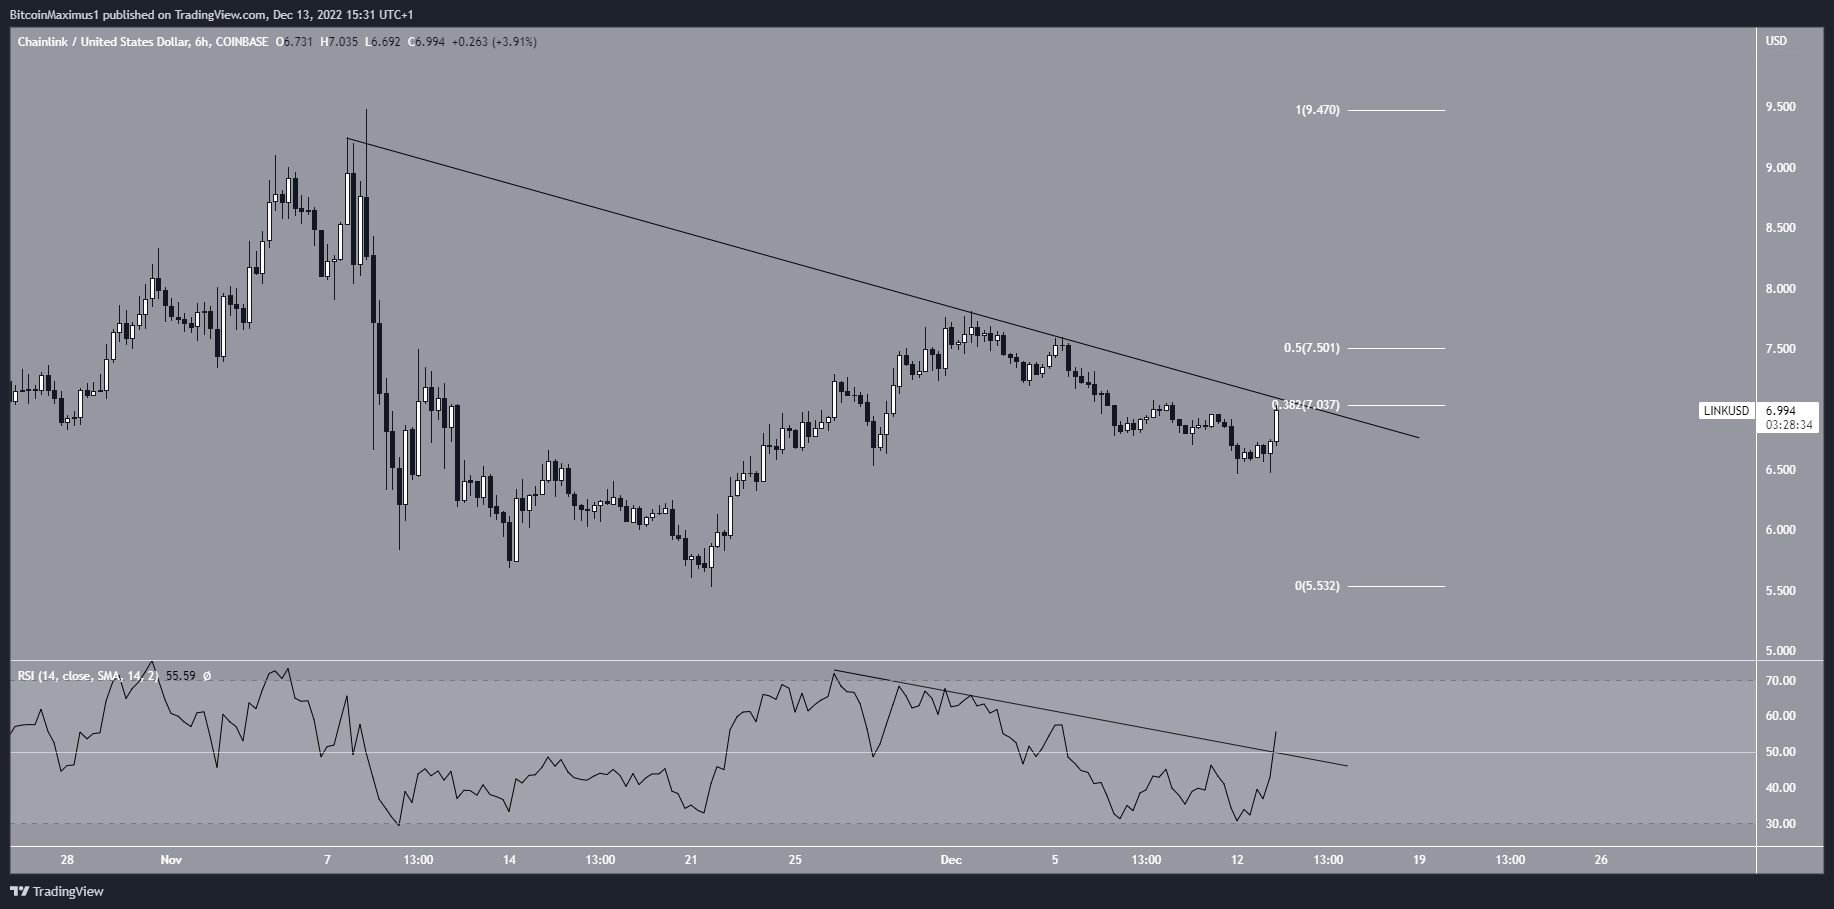
The six-hour chart supports the continuation of the upward movement.
While the Chainlink price is following a descending resistance line, it is currently making its fourth attempt at breaking out. Since lines get weaker each time they are touched, an eventual breakout is expected.
Moreover, the six-hour RSI broke out from its own descending resistance line, something which often precedes price increases.
The resistance line coincides with the 0.382 Fib retracement resistance level. If LINK successfully breaks out, the final resistance area prior to the $9.40 highs would be $7.50. This is created by a horizontal resistance area and the 0.5 Fib retracement resistance level. So, a breakout above it could quickly take Chainlink to $9.
On the other hand, failure to break out could lead to a fall toward the Nov. lows at $6.
For BeInCrypto’s latest crypto market analysis, click here.


