


PancakeSwap (CAKE) has found support above $18, putting an end to the short-term decrease that has been going on in Sept.
While it seems likely that the token will break out in the short-term, the direction of the longer-term trend is still unclear.
Ongoing descent
CAKE has been decreasing since Aug 26, when it was rejected by the 0.5 Fib retracement resistance level at $26.85. This is a common Fib resistance area that often acts as the top during price bounces.
After the drop, the token found support above the 0.5 Fib retracement support level (white) at $18. Therefore, similarly to how the 0.5 resistance level rejected the price, the 0.5 support level initiated a bounce.
While CAKE is still trading above support, technical indicators provide a relatively neutral picture.
The MACD is at the 0 line. The MACD is created by using short- and long-term moving averages (MA). The fact that it is at the 0 line shows that the short- and the long-term trend are moving at nearly the same rate.
This is also evident by the RSI, which is at the 50 line. The RSI is a momentum indicator, and the fact that it is at 50 shows a neutral trend.
The Supertrend, which uses price volatility to determine the direction of the trend is bearish. This is evident by the fact that the price is below the red line.
Therefore, the direction of the trend cannot be determined by looking at the daily time-frame only.

Cryptocurrency trader @Lomahcrypto outlined a CAKE chart, in which the token moves above the $28.85 area and increases all the way to its all-time highs at $45.
In order to determine if this will occur, a look at lower time-frames is required.

Will CAKE break out?
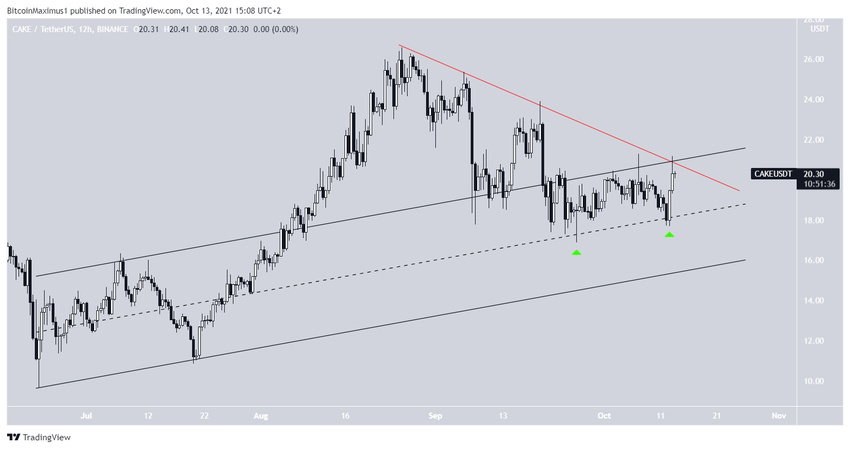
The shorter-term six-hour chart shows that CAKE is following a descending resistance line (red). It has been doing so since the aforementioned Aug 25 high. This fits with the hypothesis that the short-term trend is bearish.
However, the token has also found support in the upper portion of an ascending parallel channel. Since the channel previously served as support and resistance for the movement, the fact that it is still intact supports the longer-term trend being bullish. In addition to this, the middle of the channel coincides with the previously outlined support area.
Therefore, the price action indicates that a breakout is expected.
If a breakout occurs, the closest resistance area would be at $23. This is the 0.618 Fib retracement resistance level and a horizontal resistance area.
While it seems likely that CAKE will get there, the direction of the longer-term trend cannot be currently determined due to the mixed signs in the daily time-frame.

For BeInCrypto’s latest Bitcoin (BTC) analysis, click here.
What do you think about this subject? Write to us and tell us!


