


The Monero (XMR) price is likely nearing the end of a long-term A-B-C corrective pattern, which should end near $180.
This is part two of the Monero analysis. Click here for the first part.
Long-Term Count
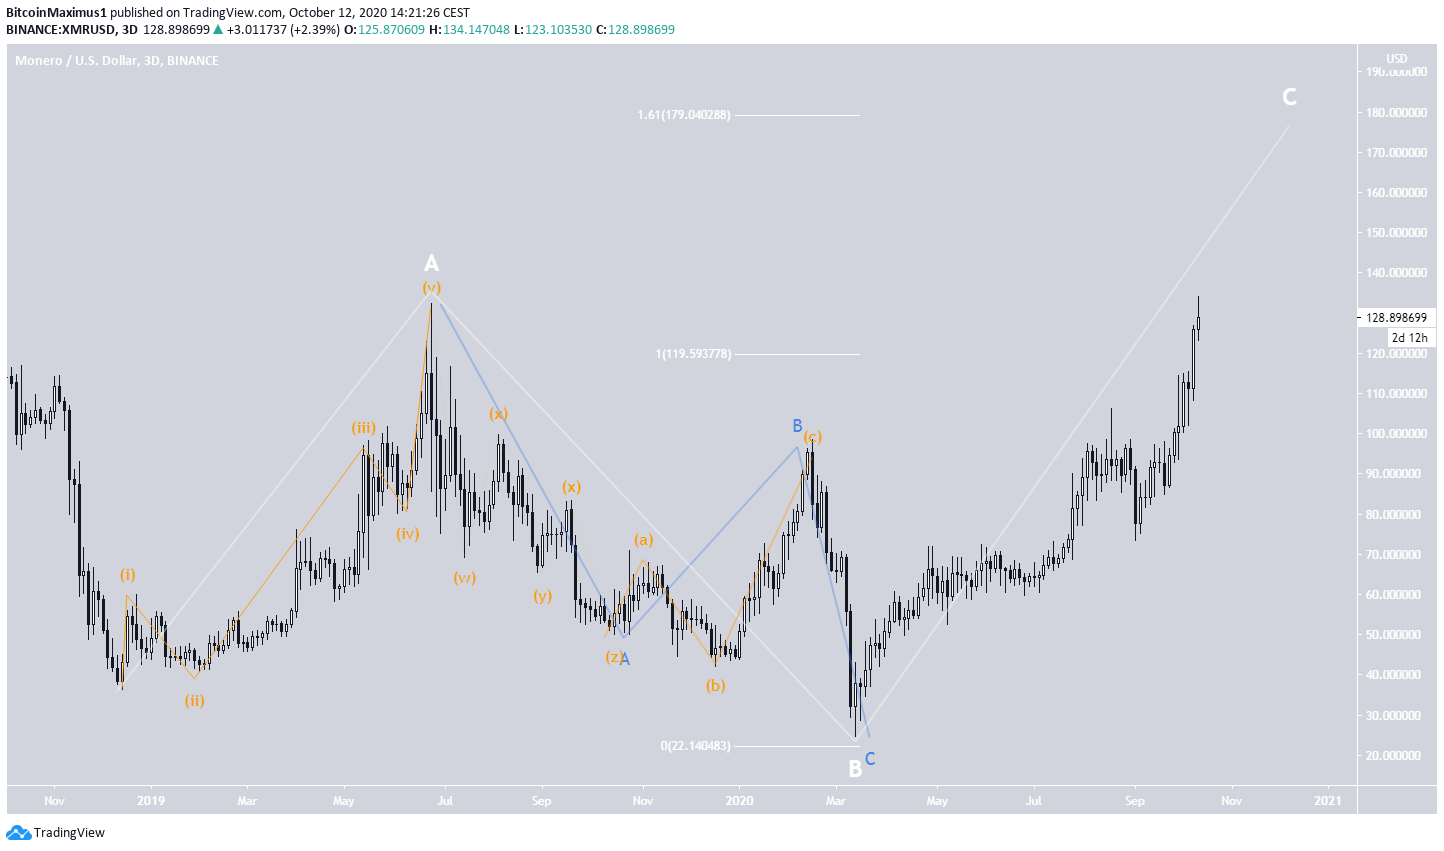
Beginning on Dec 2018, it seems that XMR began an A-B-C corrective formation (shown in white below), and is currently in the C wave.
Based on the length of the A wave, the two most likely targets for the top of C are at $119.50 and $179, in which the A:C waves have a ratio of 1:1 and 1:1.61, respectively.
The first target has already been surpassed, so the $179 area is the most likely to act as the top
Where Will Wave 5 End?
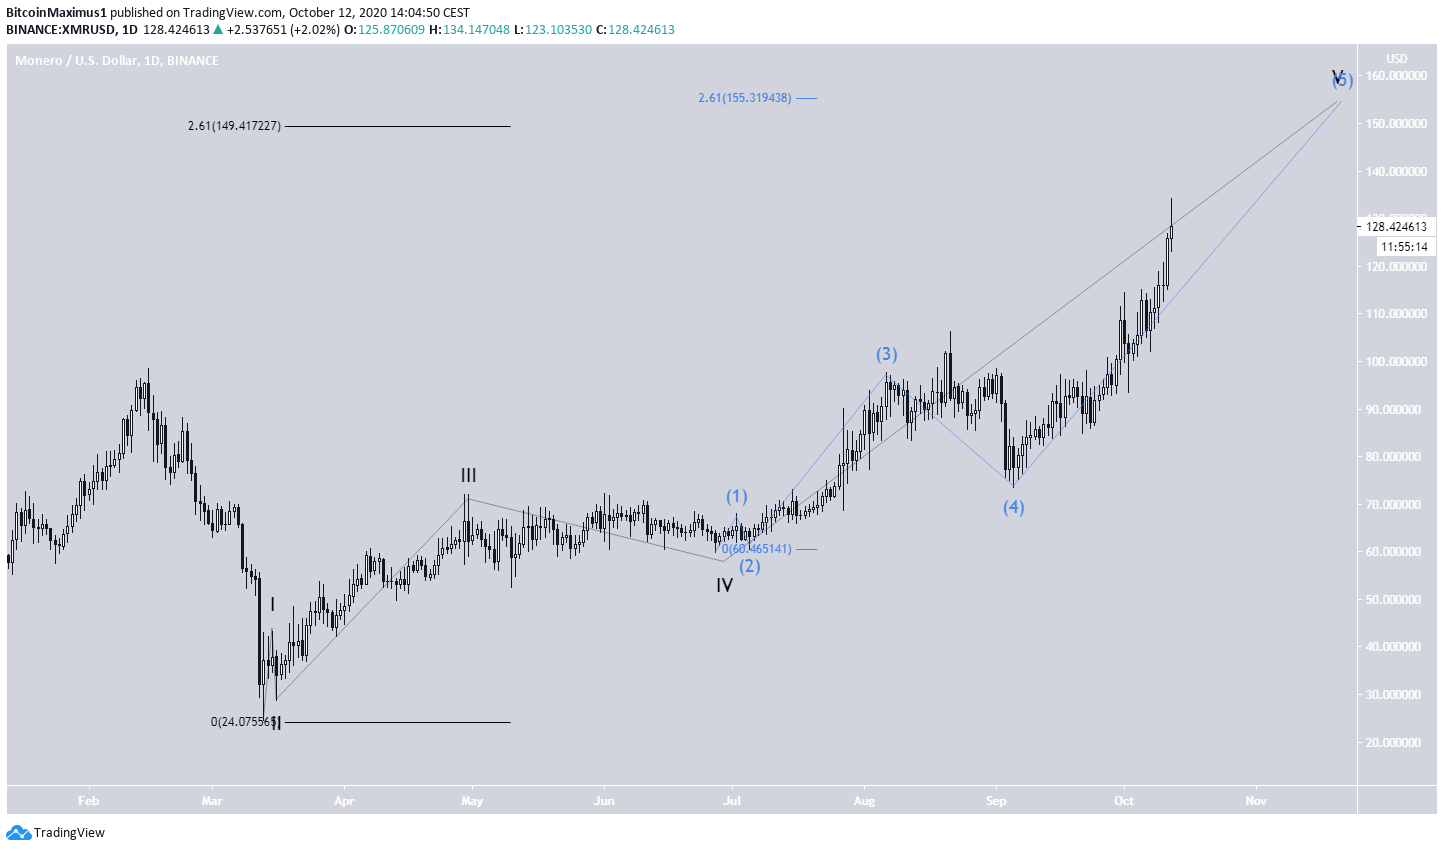
A closer look at wave C reveals a five-wave formation (shown in black below), inside which the price is currently in wave 5, which began in July 2020.
Wave 5 is created by another five sub-waves (blue) in which the price is also in sub-wave 5. This indicates that the price is quickly approaching a top.
Using the 2.61 Fib retracement of waves 1 – 3 (black) and sub-waves 1 – 3 (blue) gives a similar target of $149 and $155, respectively, even though this is below the target from the previous section.
Therefore, a closer look at lower time-frames is required in order to determine where the top will occur. The next section will be a close-up view of sub-wave 5 (blue).
A Look At XMR’s Sub-Waves
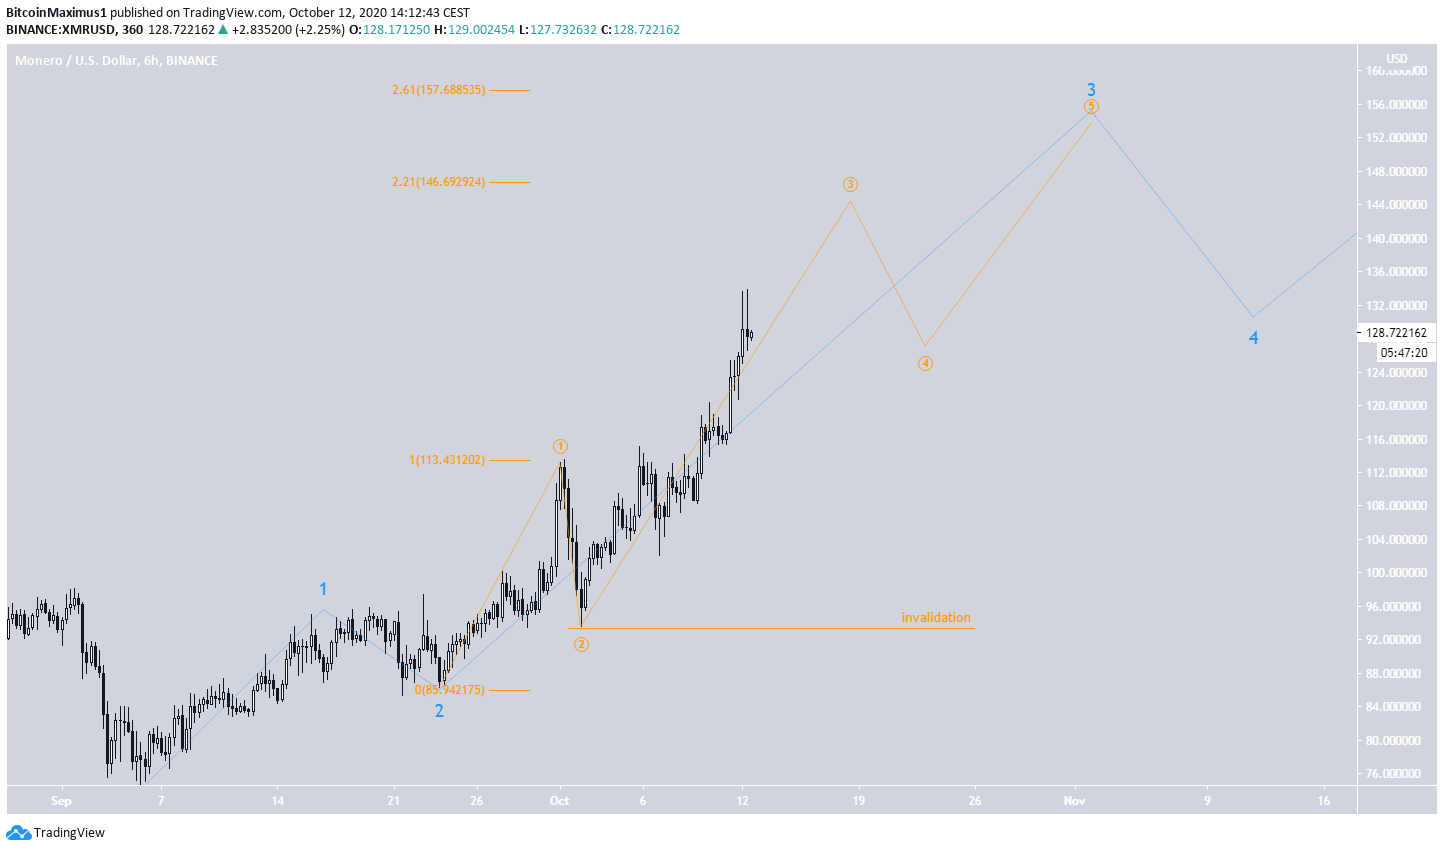
Inside sub-wave 5, we can see another five-wave formation (blue), the price currently trading in wave 3, which is taking place in five sub-waves (orange).
If the count is correct, the entire formation could end between $146 – $157. A decline below the sub-wave 2 low of $93.54 would invalidate this particular wave count.
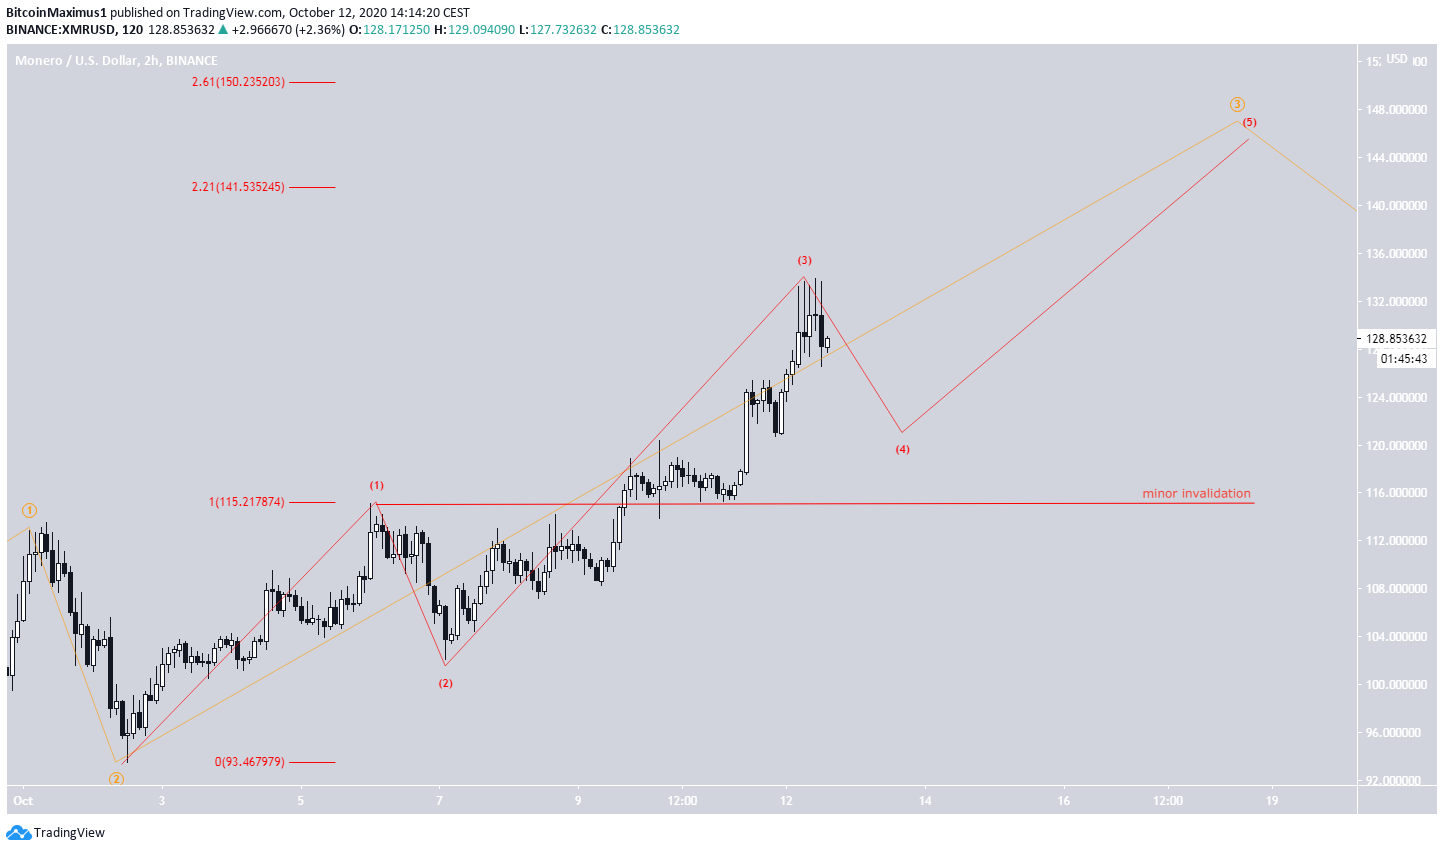
A close-up view of the 2-hour time-frame gives us our final minor sub-wave count (red), which predicts another rally towards $141 – $150, fitting with the analysis from the previous section.
A fall below the $115.21 (w1) high would invalidate this minor formation, but would still allow for the previous bullish formation to play out.
To conclude, the XMR price should continue rallying towards $155 and possibly $179.
For BeInCrypto’s Bitcoin analysis, click here!
Disclaimer: Cryptocurrency trading carries a high level of risk and may not be suitable for all investors. The views expressed in this article do not reflect those of BeInCrypto


