
The Bitcoin price increased throughout the entirety of April 12, at one point reaching a high of $7,201. However, a rapid decrease ensued by the end of the day, and BTC fell to a low of $6,542 in a matter of hours.
It is possible that this decrease caused a breakdown from a bearish pattern, confirming that the price will continue heading lower.
A bearish outlook is also given using Elliott wave theory. Cryptocurrency and altcoin trader @SmartContracter tweeted a Bitcoin chart that shows a completed W-X-Y wave count.
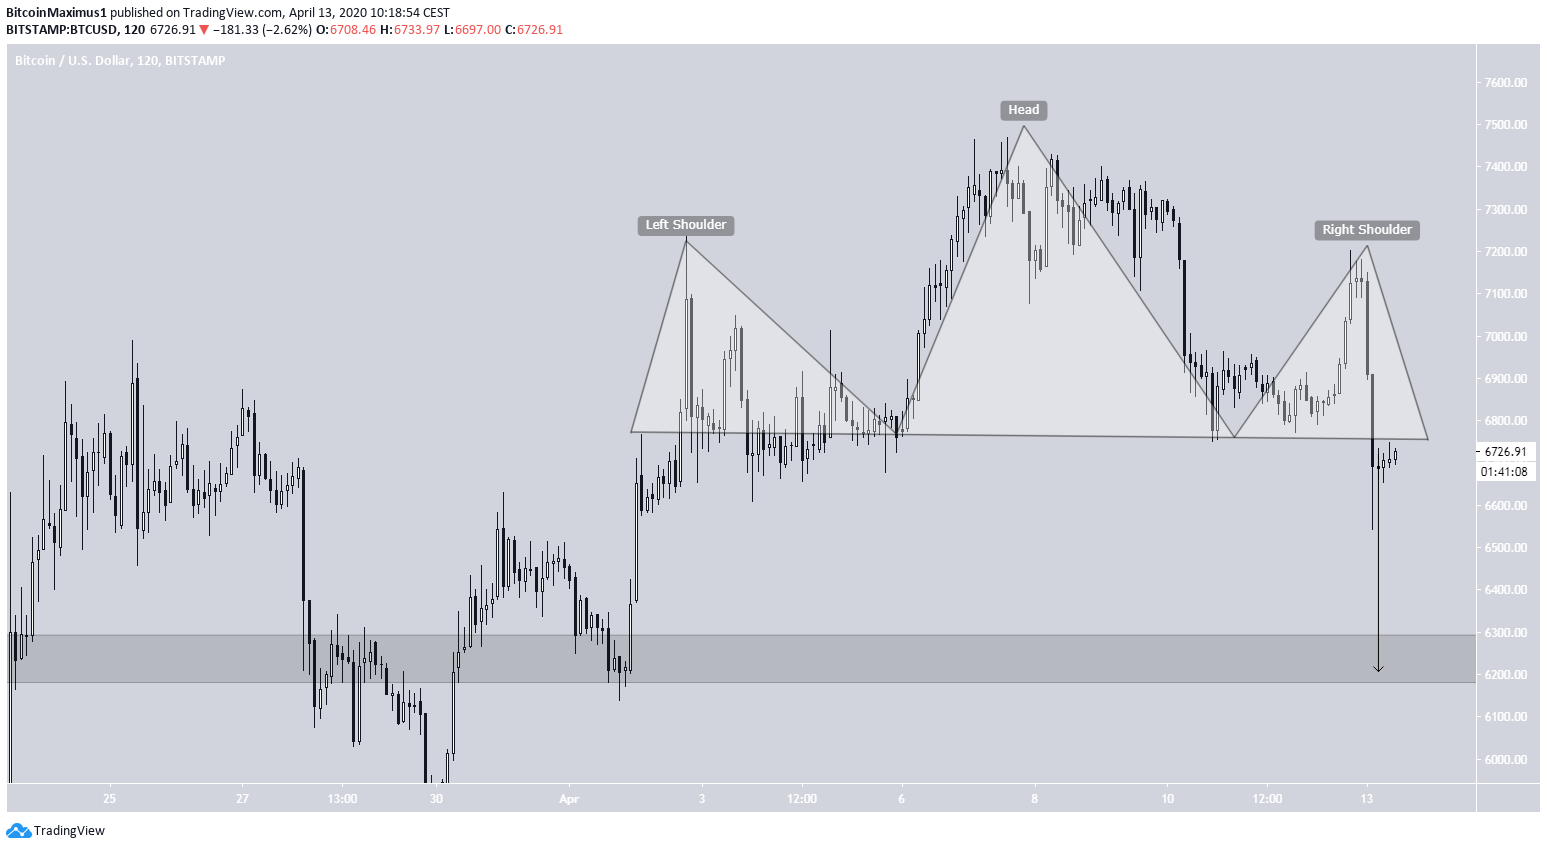
This is a bearish count that suggests the price will head lower. In addition, he has outlined a short-term head and shoulders, also indicating that the price will see further downsides.
alotta btc bullas confident bottom is in, but for me its very hard to argue that rise from lows is impulsive 🤷♀️ pic.twitter.com/SGZ2HXye86
— Bluntz (@Bluntz_Capital) April 13, 2020
Bitcoin Wave Count
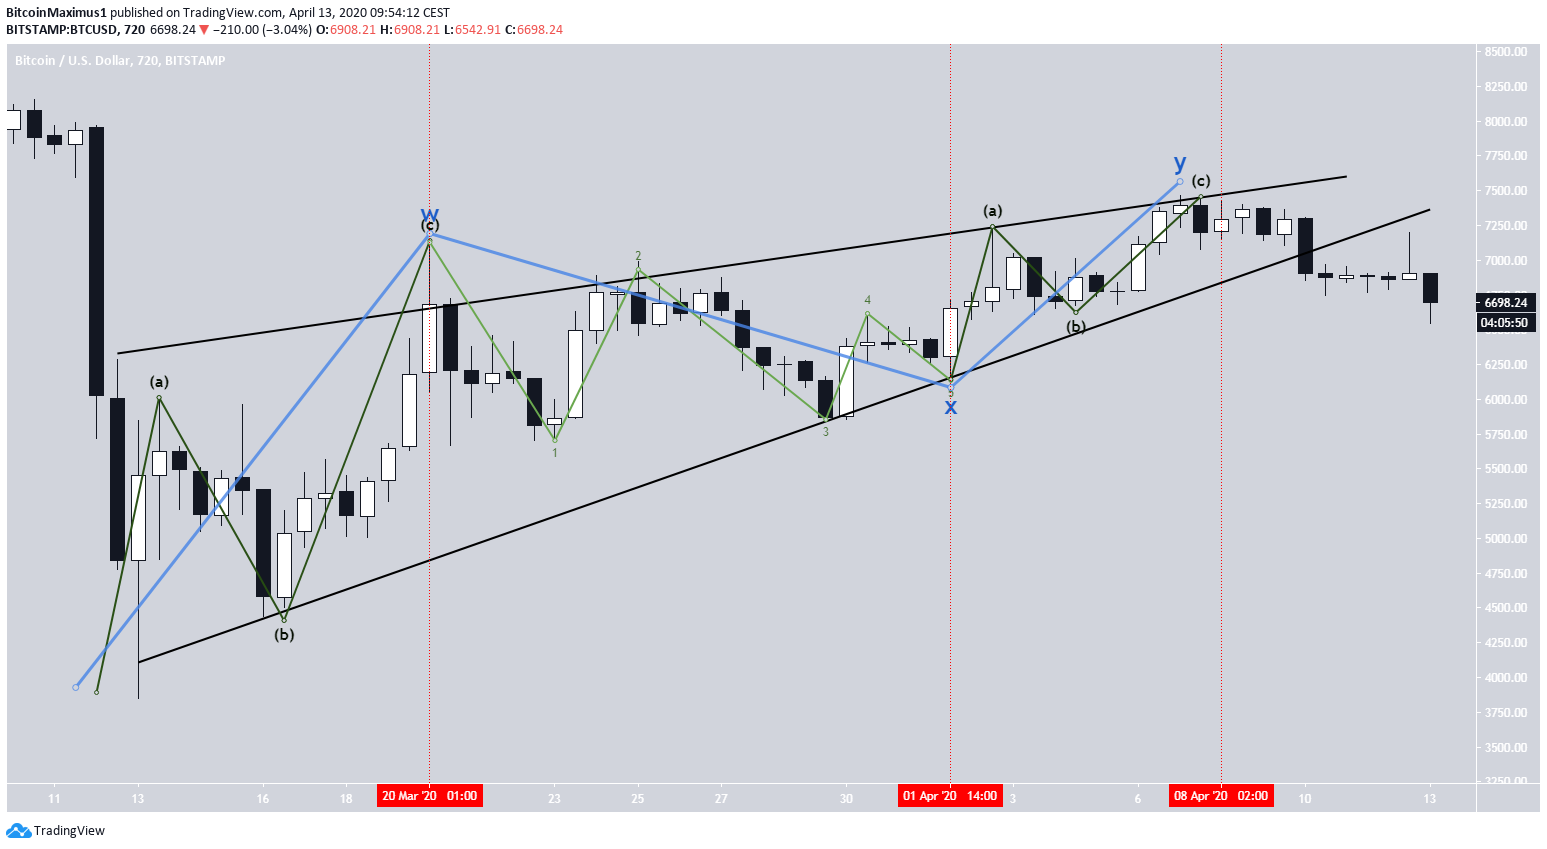
It is possible to outline a W-X-Y wave count for the BTC price since it reached a bottom on March 13, exactly a month ago. The sub-waves for the formation are as follows:
- W: A-B-C
- X: 1-2-3-4-5
- Y: A-B-C
Throughout this time period, the Bitcoin price had been trading inside an ascending wedge, which is considered a bearish pattern. The price broke down on April 10 and has been decreasing since.
Therefore, both the wave count and the type of pattern created suggest that the BTC price will likely decrease in the near future.
To add to this bearishness, the BTC price seems to have completed a short-term head and shoulders pattern. This is a bearish pattern that indicates the price will head lower, possibly towards the closest support area found at $6,300.
A Possible Bottom
There are two more characteristics that add to the bearish bias.
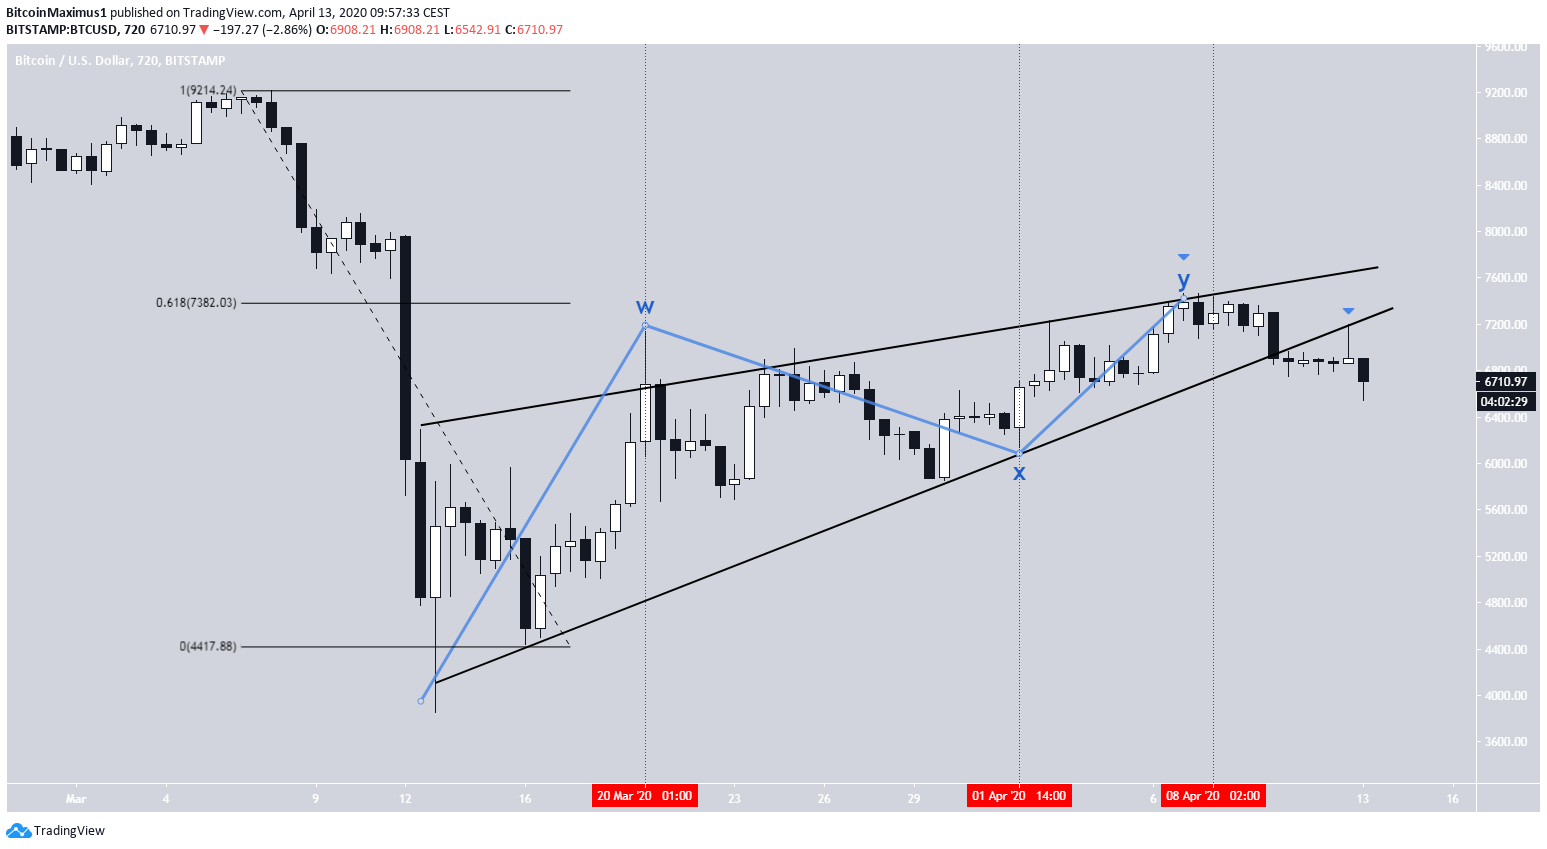
First, the rally ended once the price reached the 0.618 Fibonacci level of the entire previous decrease. This is a very common retracement level that often initiates a reversal.
Second, after the price broke down from the wedge, it validated it in the form of a long upper wick before decreasing sharply.
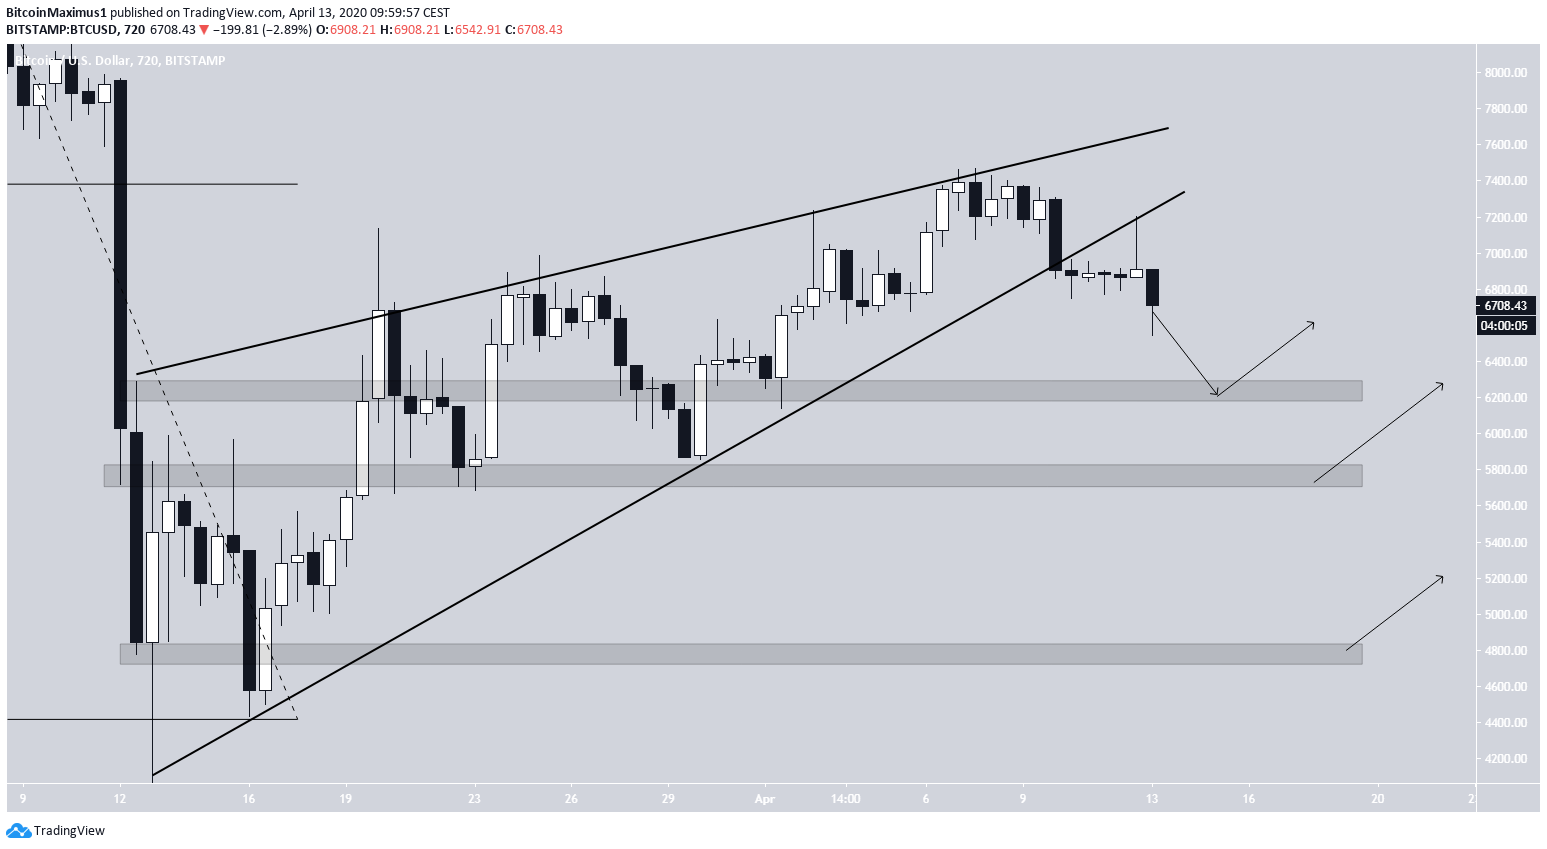
However, it seems too early to say that BTC will decrease and make a new low. While it is possible that BTC makes a low somewhere around $2,200, as BeInCrypto has outlined previously, there are three main support areas that could initiate a reversal prior to the price falling towards new bottoms.
First, there are two support areas relatively close to each other at $6,300 and $6,800.
Beyond that, there is the $4,800 support area, which would create a sort of triple bottom if the price gets there.
Even if the price were to go lower than $4,800, it is likely to bounce numerous times at the outlined support areas prior to doing so.
To conclude, the Bitcoin price has broken down from an ascending wedge and has been decreasing since. The price is likely to decrease at least until it reaches one of the support areas outlined above. At the time of writing, we cannot confidently determine if the price will fall below the lows of March 13.
