


On Aug 25, the Bitcoin (BTC) price created a bearish engulfing candlestick and dropped sharply.
This was likely the beginning of a corrective movement that is expected to take BTC back below $11,000.
Bitcoin Backs Off
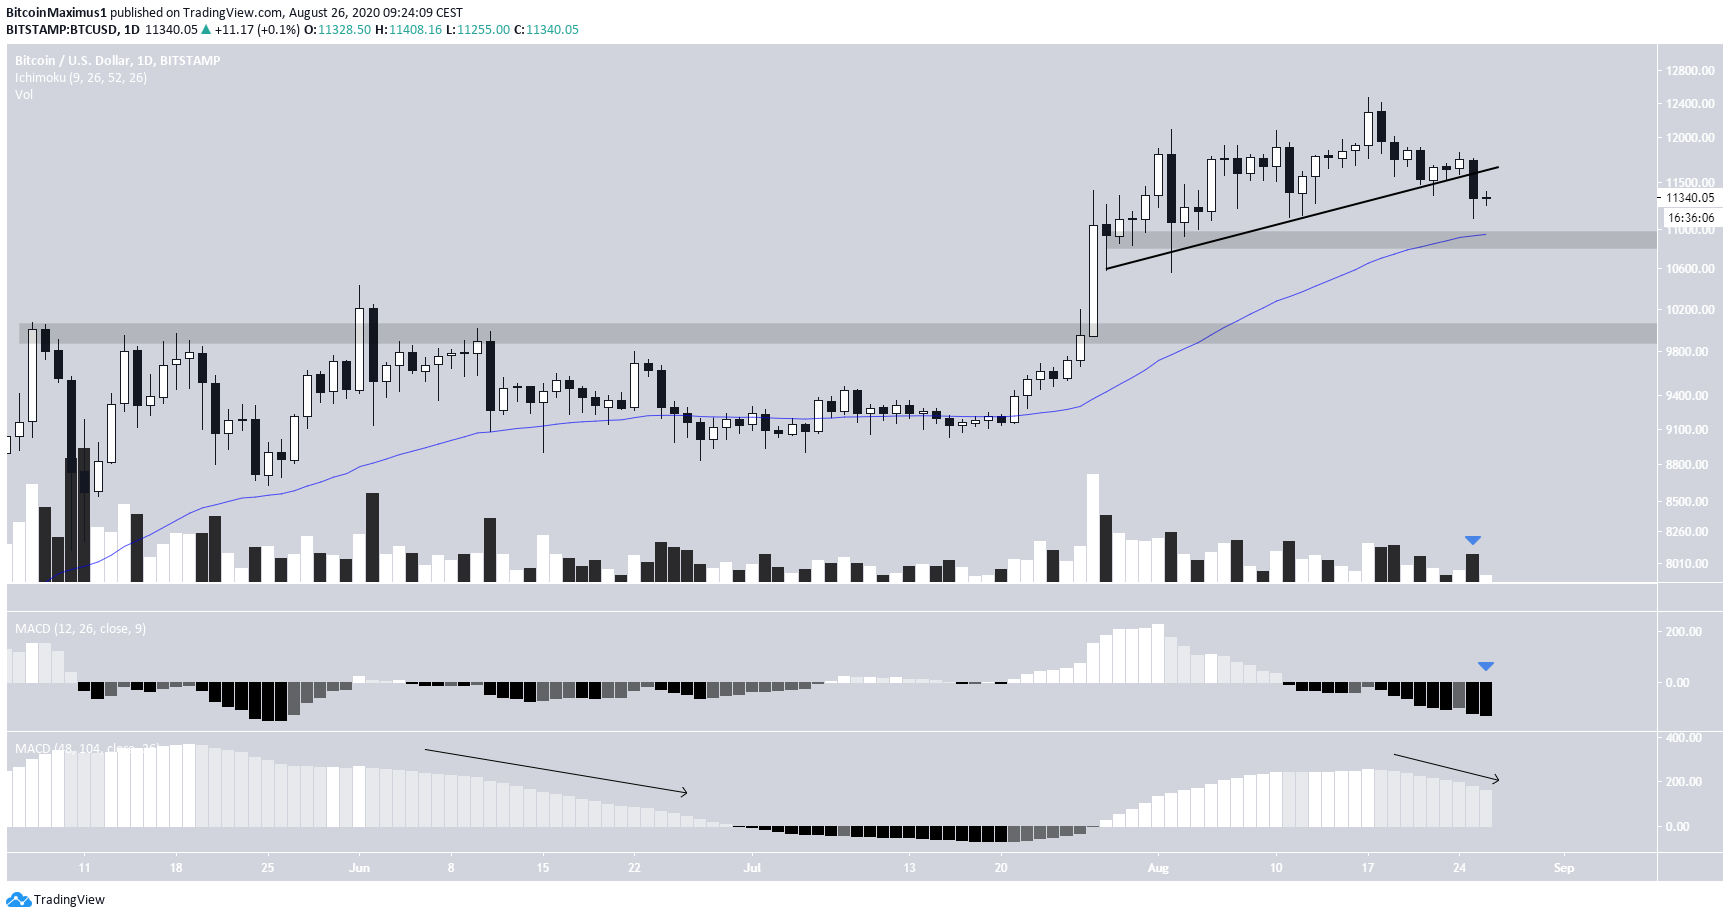
Bitcoin decreased sharply on Aug 25, creating a bearish engulfing candlestick and breaking down below an ascending support line that had been in place since July 28. The breakdown occurred with a slightly above-average volume.
The short-term MACD is negative and decreasing, while the longer-term trend has already lost its strength and is moving down. It has not moved into negative territory yet.
If the price continues decreasing, there are two main support levels below the current price:
- $10,900 – created by the wick-lows at the end of July and the 50-day moving average.
- $9,900 – created by the range high of the May-June period.
There is virtually zero support between these two levels.
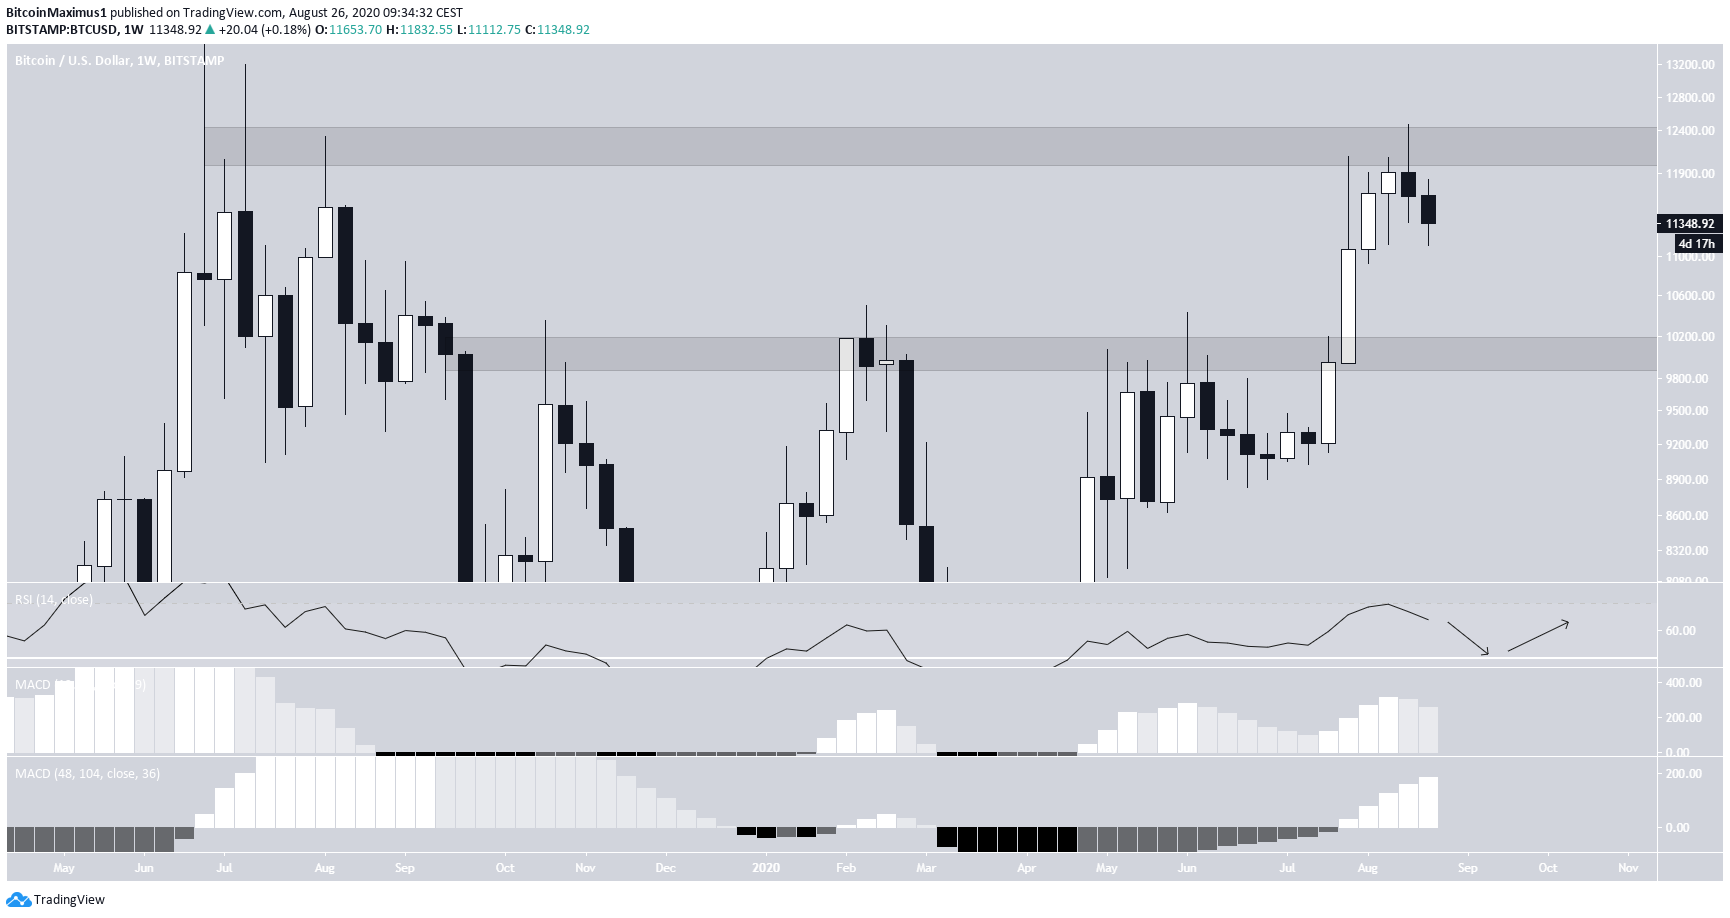
The weekly chart shows that BTC was rejected at the $12,200 area and created a shooting star candlestick, normally a bearish reversal sign when coming after an upward trend.
The closest support area in this time-frame is found at $9,900. Technical indicators suggest a decrease is likely. The RSI is moving down towards 50 and the short-term MACD is decreasing.
However, the long-term MACD is still moving up, suggesting that the forecasted downward move is likely to only be a correction that is followed by a continuation of the upward trend.
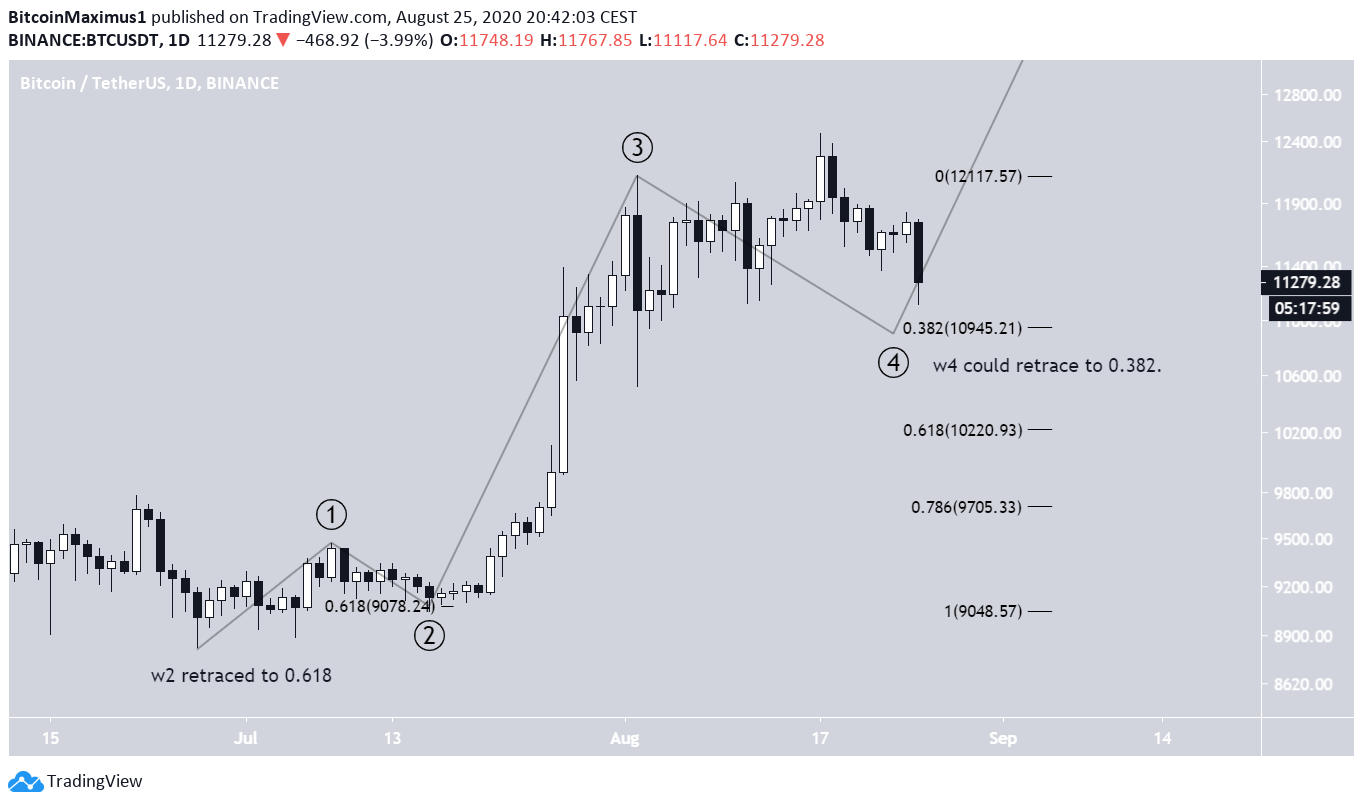
Where Will the Correction End?
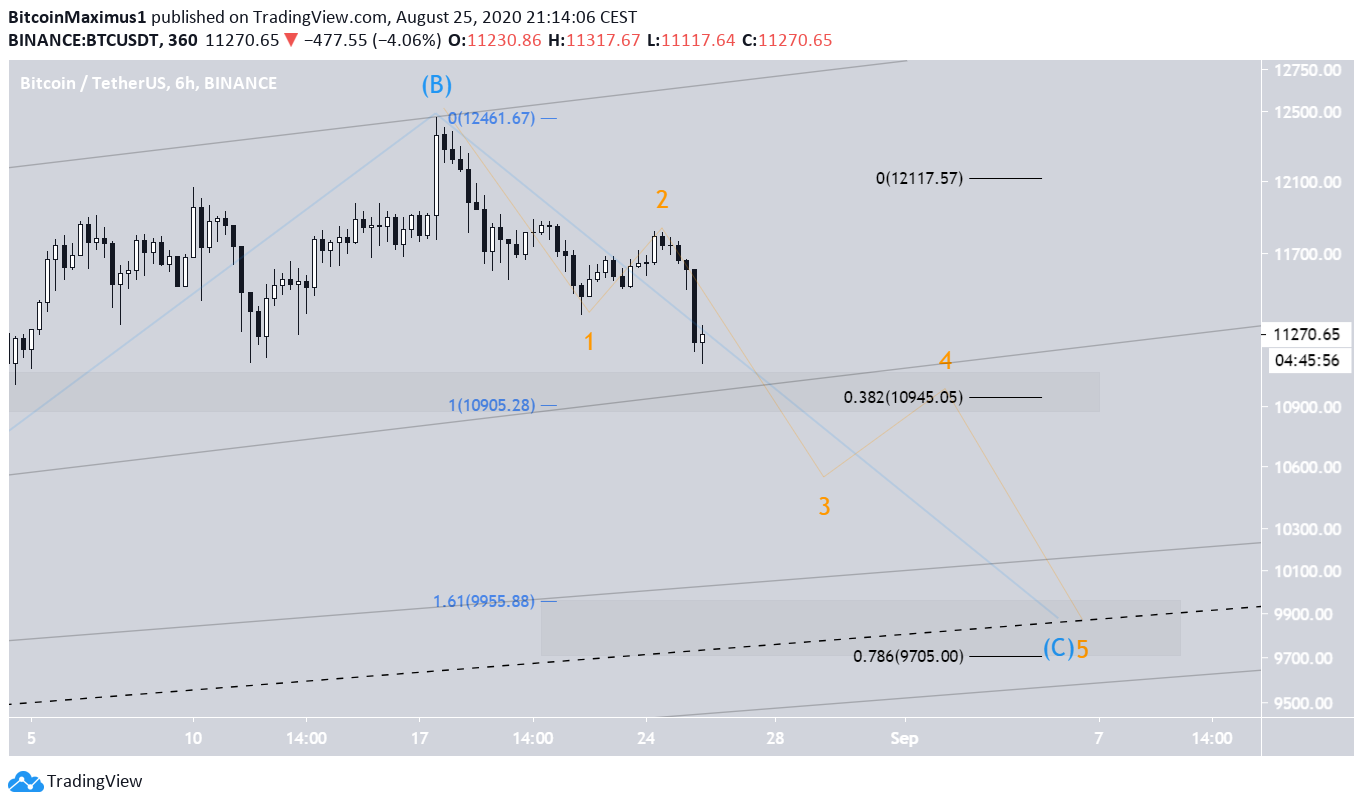
The most likely scenario is that the price is in wave 4 out of a five-wave formation (in black below). Since wave 2 ended at the 0.618 Fib level, it would make sense for wave 4 to end at the 0.382 Fib level at $10,945. This coincides with the previously mentioned support level in the daily time-frame.
The 0.618 support level at $10,220 does not coincide with any previously mentioned support areas, so we will ignore it for now.
The 0.786 Fib level sits at $9,705, relatively close to the $9,900 support in the weekly time-frame.
This further bolsters our forecast that the correction could likely end near either $10,200 or a bit further down between $9,700-$9,900.
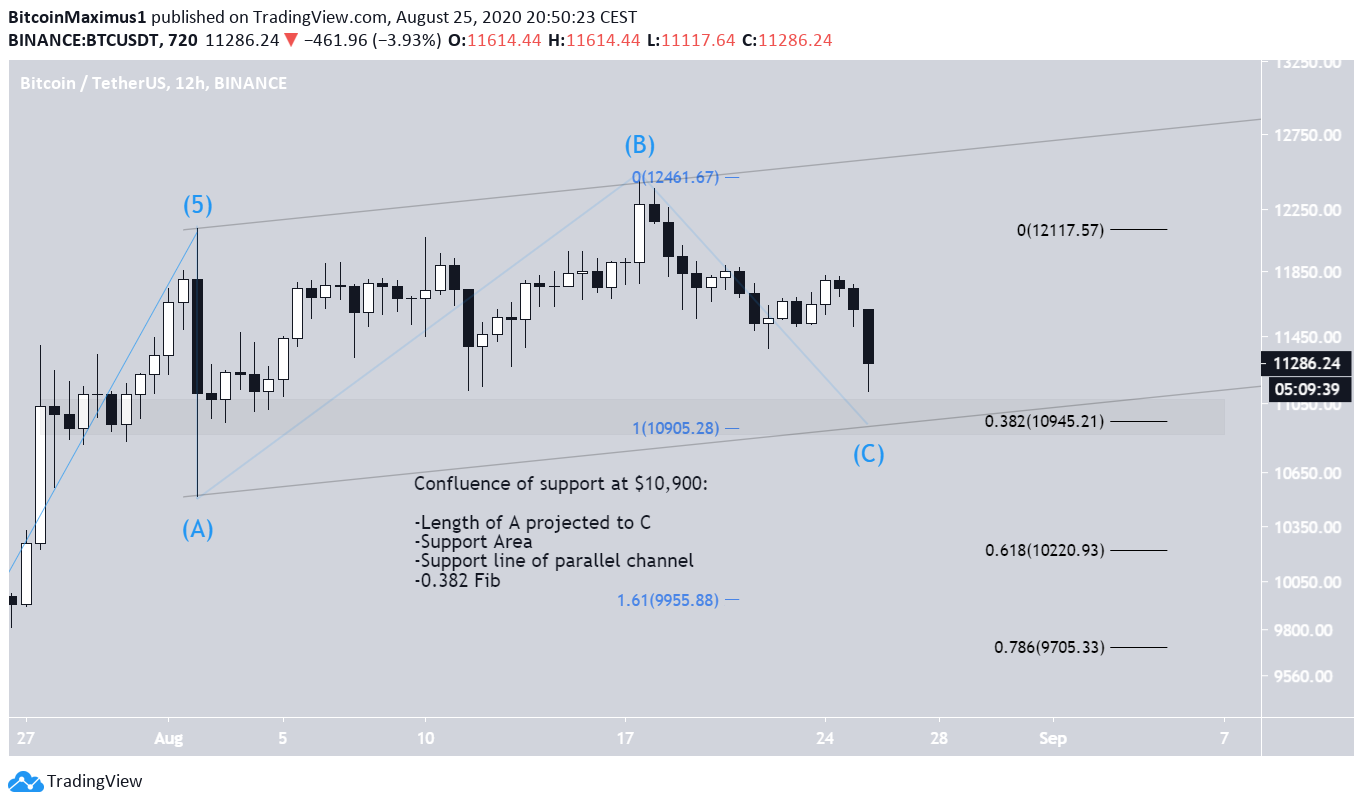
The previously-mentioned wave 4 is transpiring in an A-B-C formation (blue), in which the price is currently in the C wave. The two most likely levels for the C wave to end are at either the 1 or 1.61 Fib of the length of wave A.
These Fib levels fall at $10,900 and $9,955, further confirming that these two levels are the ones to watch for the end of this correction.
However, if we outline an ascending parallel channel connecting the tops of waves A and B and project them to the bottom, it gives us a low of exactly $10,900, expected to be reached in the next few days.
$9,900 or $10,900?
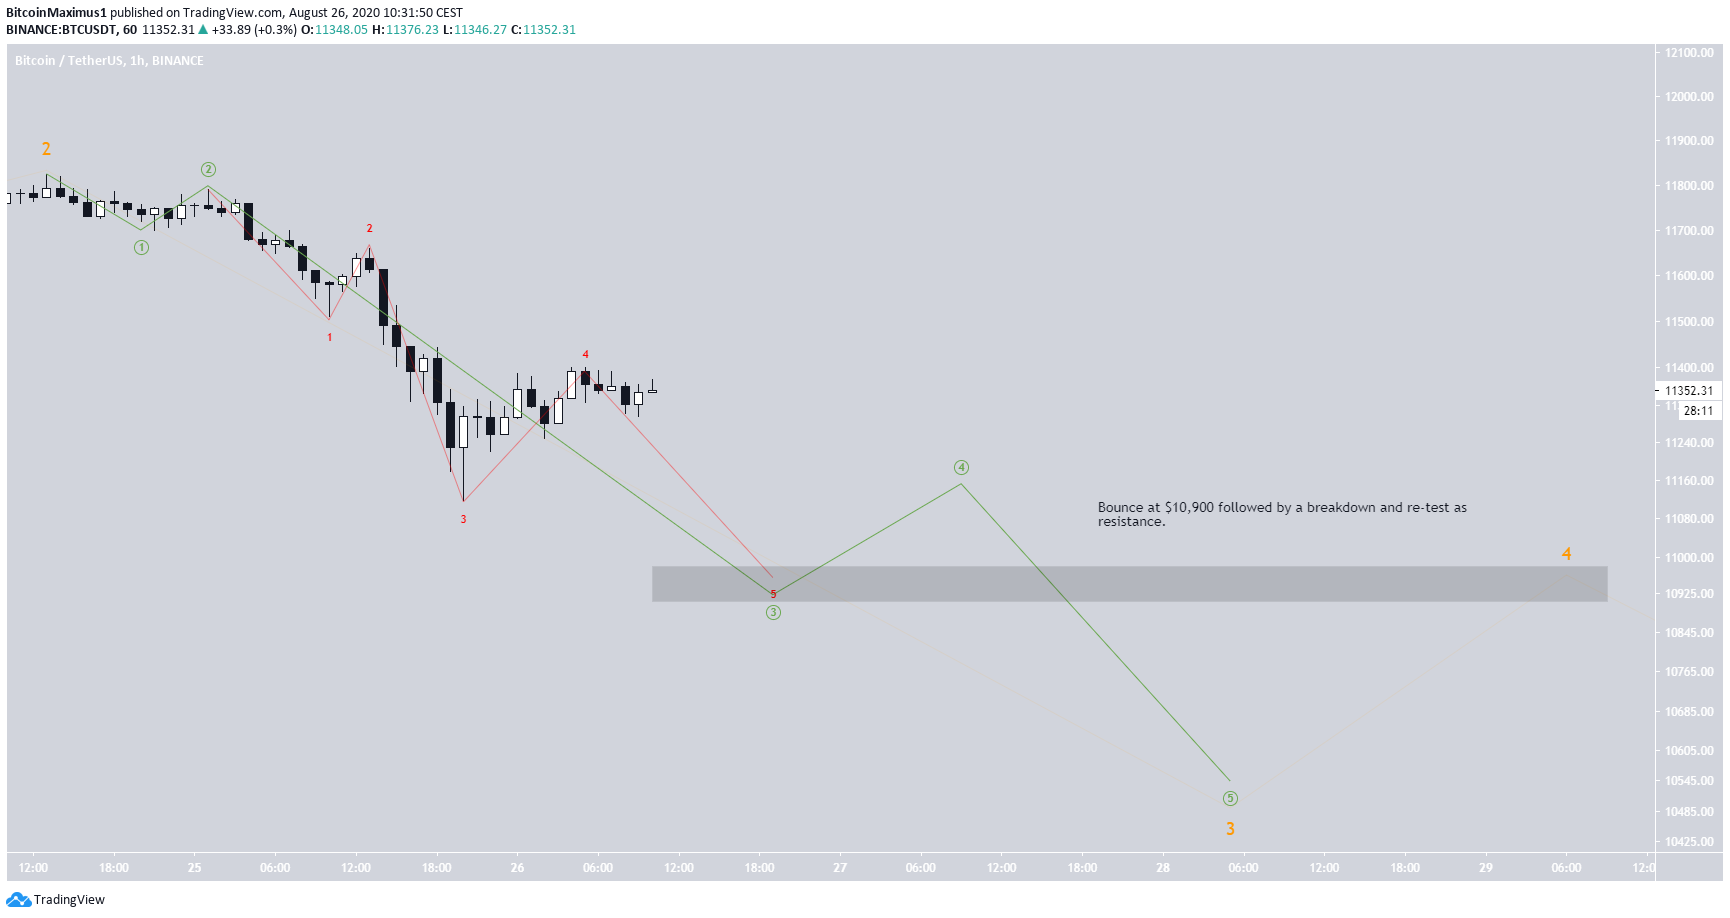
C waves mostly transpire in a five-wave formation (shown in orange below), and the price is currently in the third wave. Due to the length of the first wave and the fact that wave 3 cannot be the shortest, it seems much more likely that the formation will end at $9,900 instead of $10,900.
If so, a breakdown from the $10,900 area would be expected before it is retested as resistance (wave 4).
Furthermore, there are no reversal signals in either the RSI or the MACD that would suggest that the price is likely to reach a bottom near $10,900.
The sub-wave count for this possible formation is given below. The orange wave pattern is the same as the previous chart, while the green and red lines show the sub-wave and minor sub-wave count.
Since the third wave is extended in each sub-wave, this is a relatively common wave count.
Alternate Formation
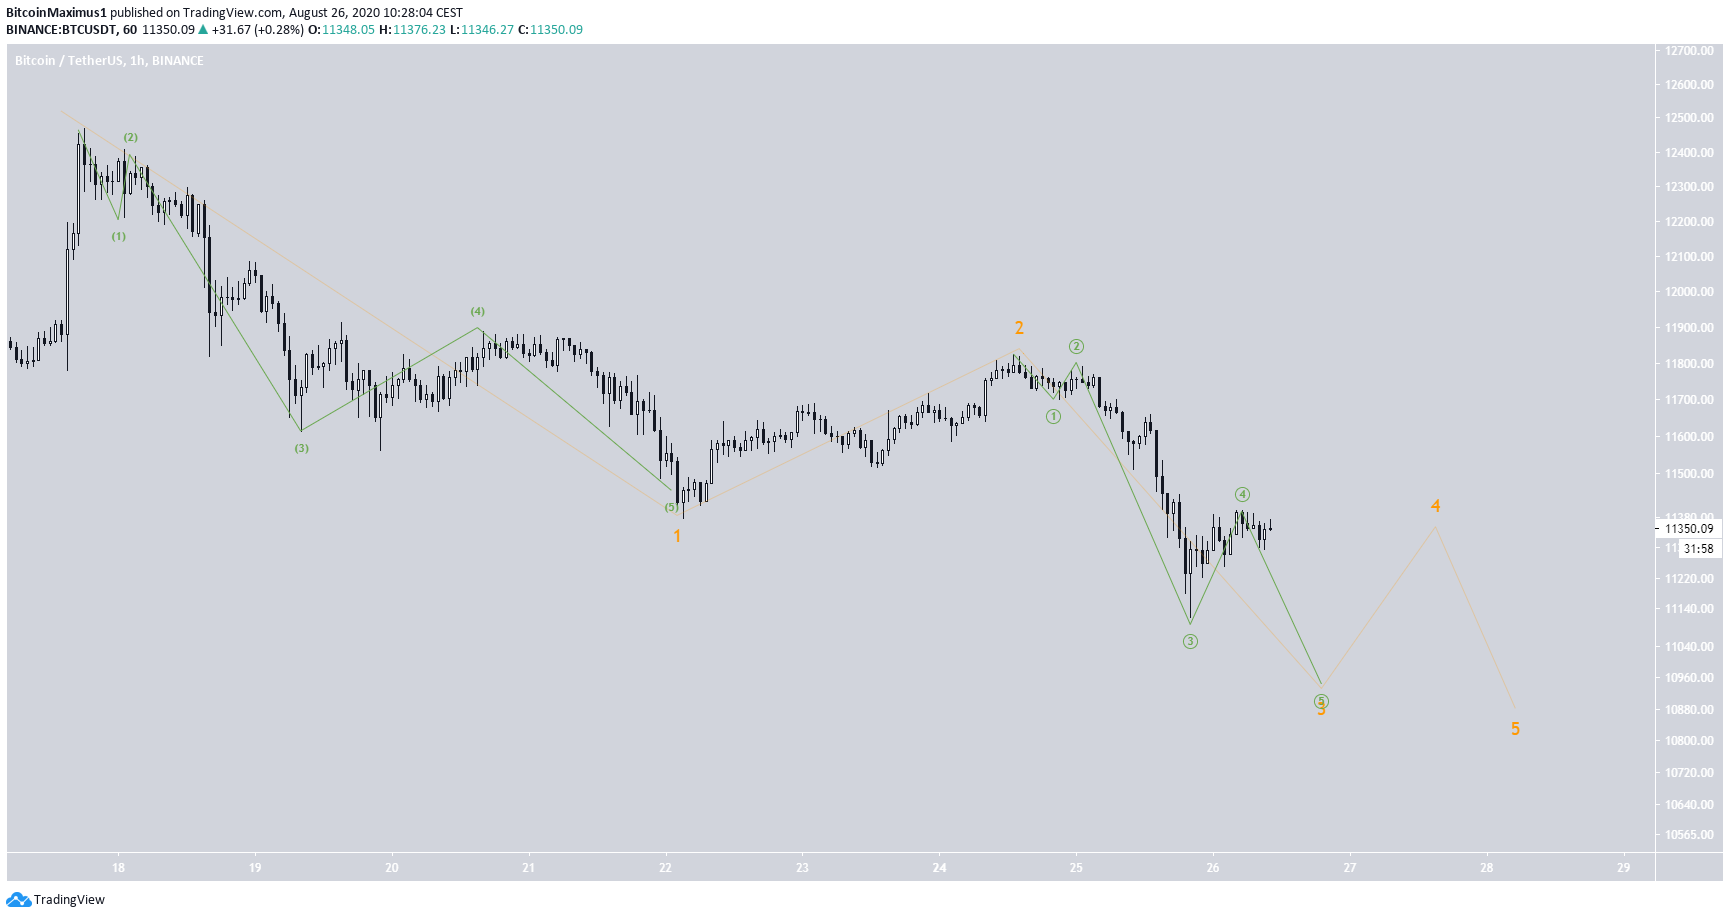
An alternate pattern in which the correction ends at $10,900 is given below. Due to the fact that wave 3 cannot be the shortest, and it would have to be shorter than wave 1 if it ends near $10,900, we would need to have some type of truncated wave 5.
Due to the length of the preceding decrease and projected waves, this would be an extremely unusual formation, even if it is valid based on EW rules.
To conclude, the Bitcoin price is correcting in a movement that is expected to end near $9,900. The other possibility is that the move ends near $10,900, but is less likely as there are no reversal signs suggesting that the price will do so.
For our previous Bitcoin analysis, click here!


