
The Bitcoin price has been increasing since reaching a low of $3,850 on March 13. The increase has been gradual but very significant. At the time of writing, the BTC price had increased by 80% since the low.
However, it is still unclear whether the current movement is a retracement in response to the prior decrease or if the price has already begun an upward movement. Cryptocurrency outlet @Cryptobuzznews tweeted two Bitcoin charts, one presenting a bullish and the other a bearish outlook for the future BTC price movement.
https://twitter.com/cryptobuzznews/status/1243123894665412608
Below, we will take a closer look at the BTC price movement and determine which scenario is more likely.
Bearish Scenario
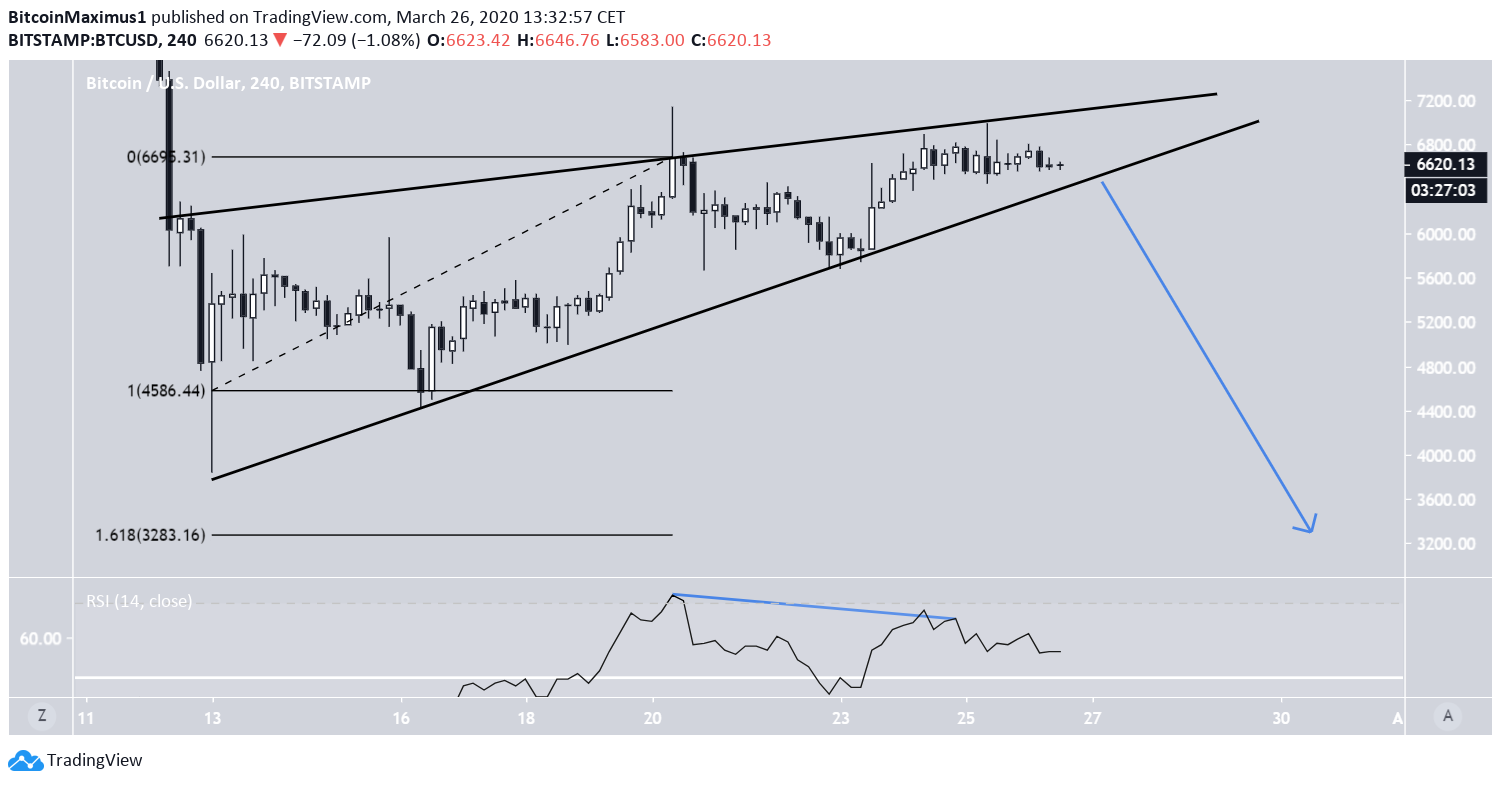
The bearish scenario suggests that the BTC price has just finished the fourth wave of a five-wave Elliott formation. Therefore, this is just a retracement in response to the previous downward move and the price will eventually settle at a lower low, completing the fifth wave.

The current BTC price movement since the low resembles an ascending wedge, the price currently being very close to the end of the pattern. Besides being a bearish pattern, the ascending wedge is combined with bearish divergence in the RSI, making a breakdown even more likely.
A breakdown from this pattern could trigger a rapid price decrease, one that confirms that the current BTC movement it still bearish.
Using a Fibonacci retracement tool on the entire upward move, but using closing prices instead of wicks, we can see that a likely target for the end of the move is found at $3,300.
Bullish Scenario
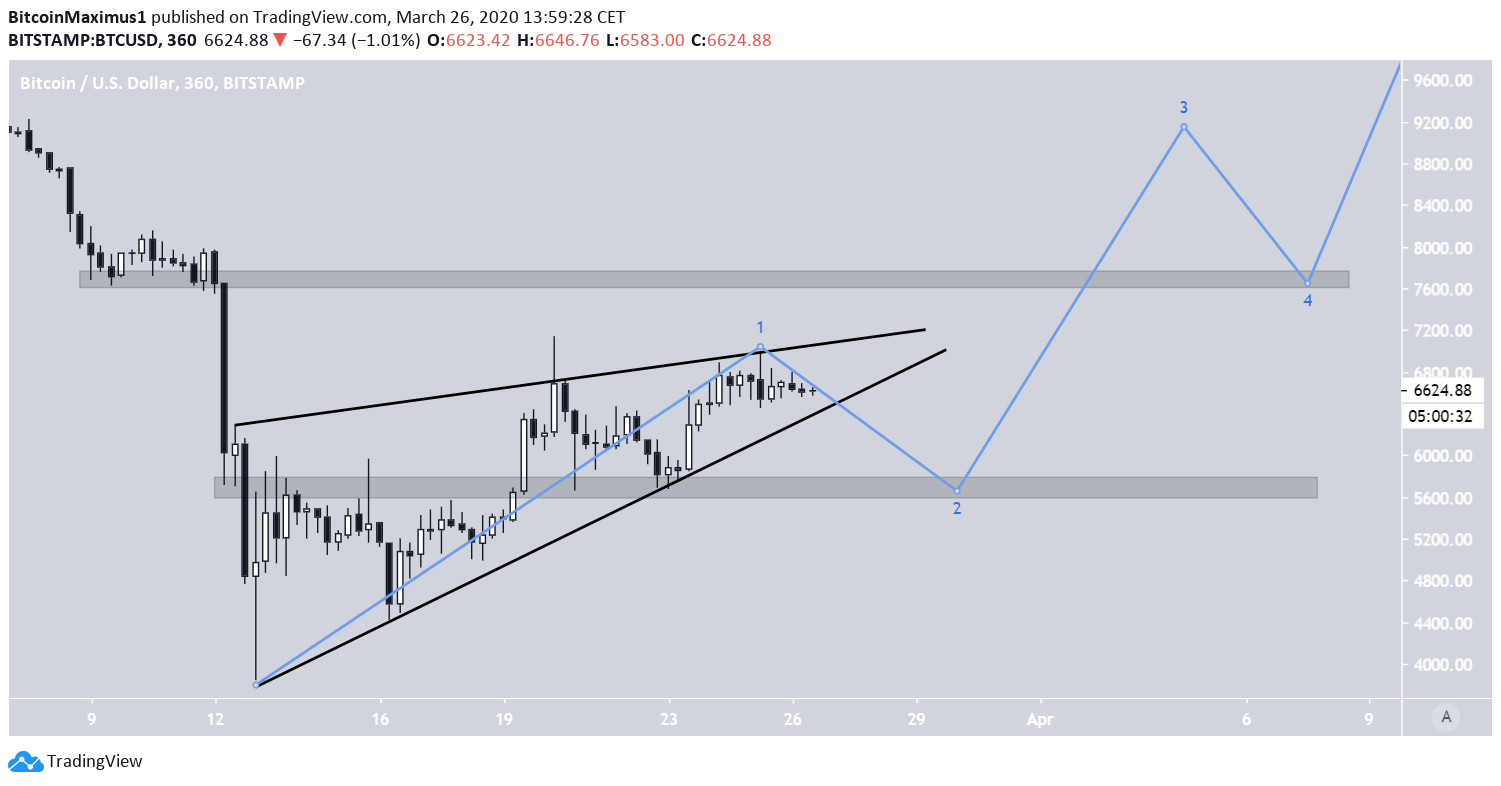
The bullish scenario suggests that the five-wave formation was completed with the low near $4,000 on March 13. According to it, the price has already begun the next upward movement and this is the first wave in said movement.
The ascending wedge and its possible breakdown do not invalidate this scenario. However, once the breakdown commences, the price is expected to bounce at the $5,700 level as outlined in the image below. Afterward, the ensuing third wave causes a breakout above the $7,700 resistance area and solidifies it as support afterward.
Conclusion
The Bitcoin price has been increasing since the low on March 13, albeit trading inside an ascending wedge, which is considered a bearish pattern. The price is expected to break down from this pattern. The ensuing movement will determine if a low has already been reached.
A price decrease below $5,700 would confirm that the price movement is bearish and the BTC price has yet to reach a bottom. On the other hand, if the $5,700 area initiates a bounce strong enough to cause the price to move above the resistance at $7,700, the price movement would be considered bullish.
