The Ontology (ONT) price is approaching a long-term resistance line that has been in place since Sept 2018.
However, neither the price move nor technical indicators confirm the possibility of a breakout.
Long-Term Levels
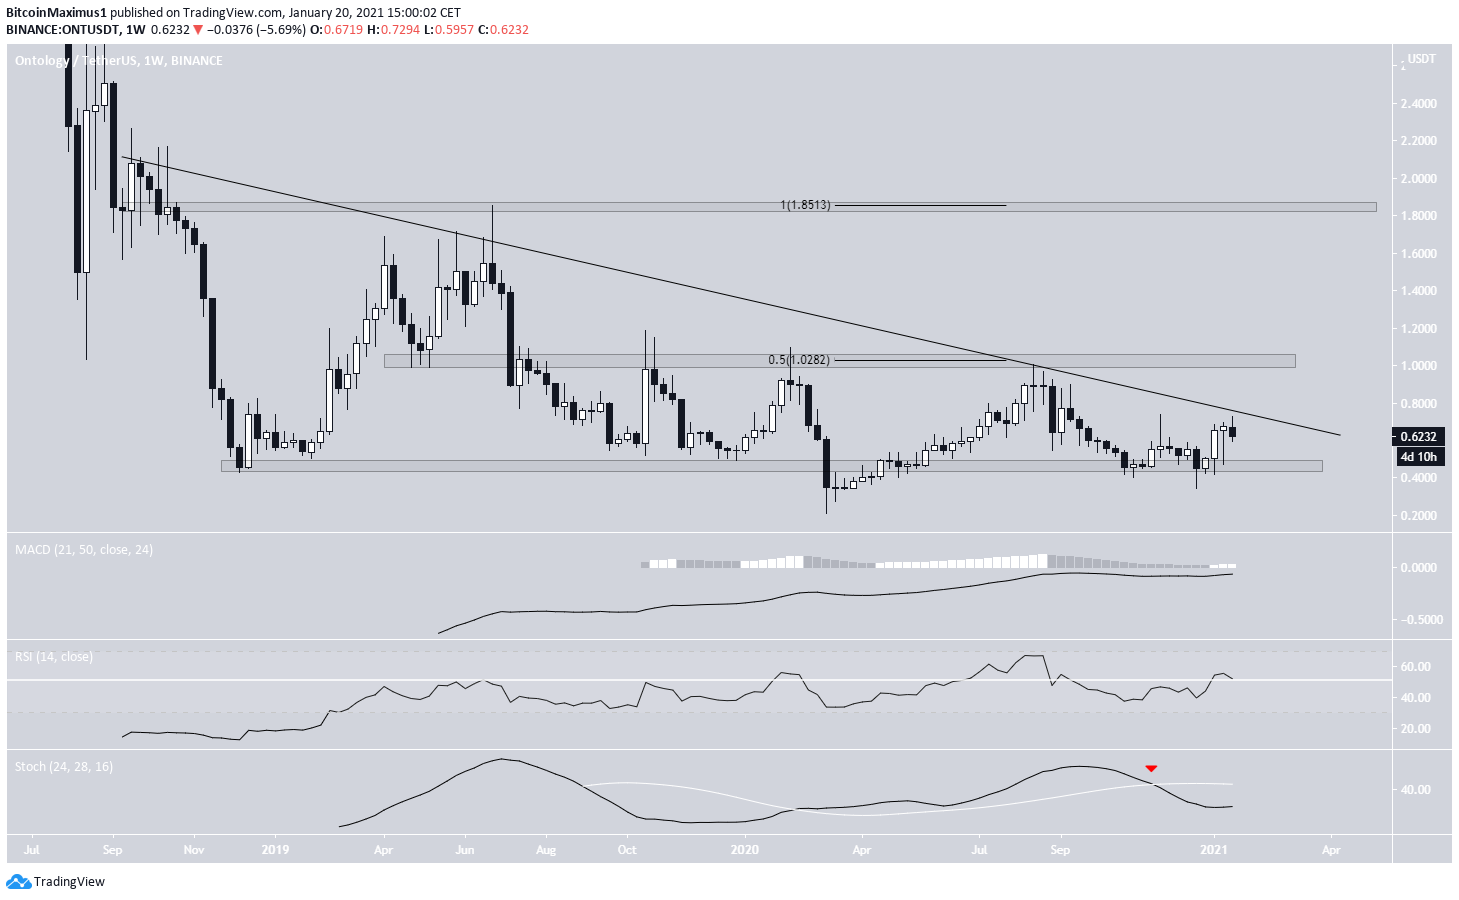
ONT has been following a descending resistance line since Sept. 2018, when it was trading at a high of $2.26. Since then, it has made three unsuccessful breakout attempts and is currently in the process of attempting the fourth one.
The main support area is at $0.45. ONT has been trading above this level since Dec. 2018, except when it reached an all-time low price of $0.217 in March, which quickly reclaimed this support level.
If ONT were to break out, the next closest resistance area would be at $1.03, the 0.5 Fib retracement level of the most recent downward movement.
However, technical indicators are neutral, failing to confirm the possibility of a breakout.

Short-Term Breakout
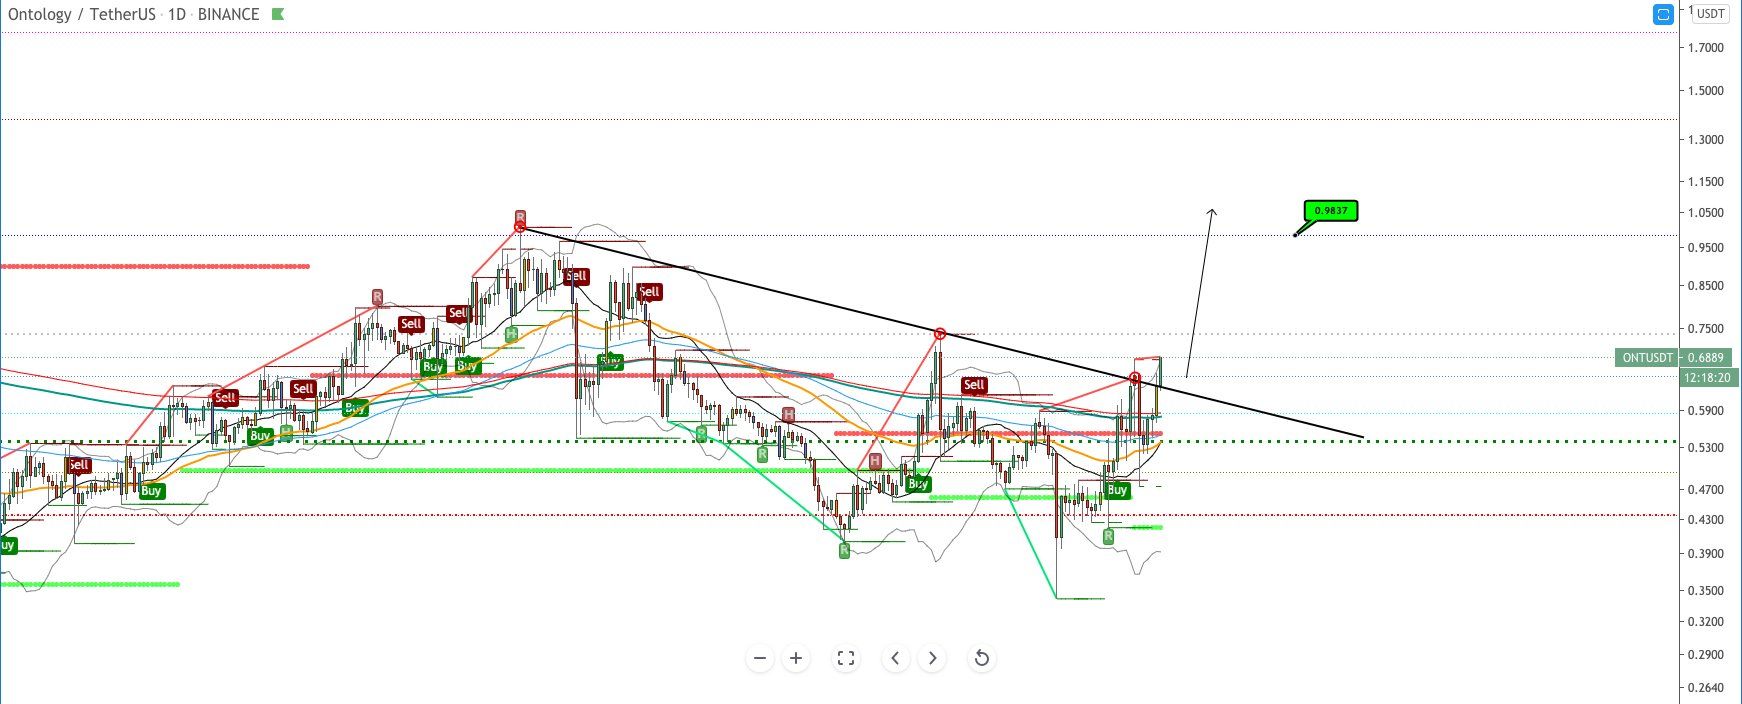
Cryptocurrency trader @CryptoNewton outlined an ONT chart, suggesting that an eventual breakout from the current descending resistance line is expected.

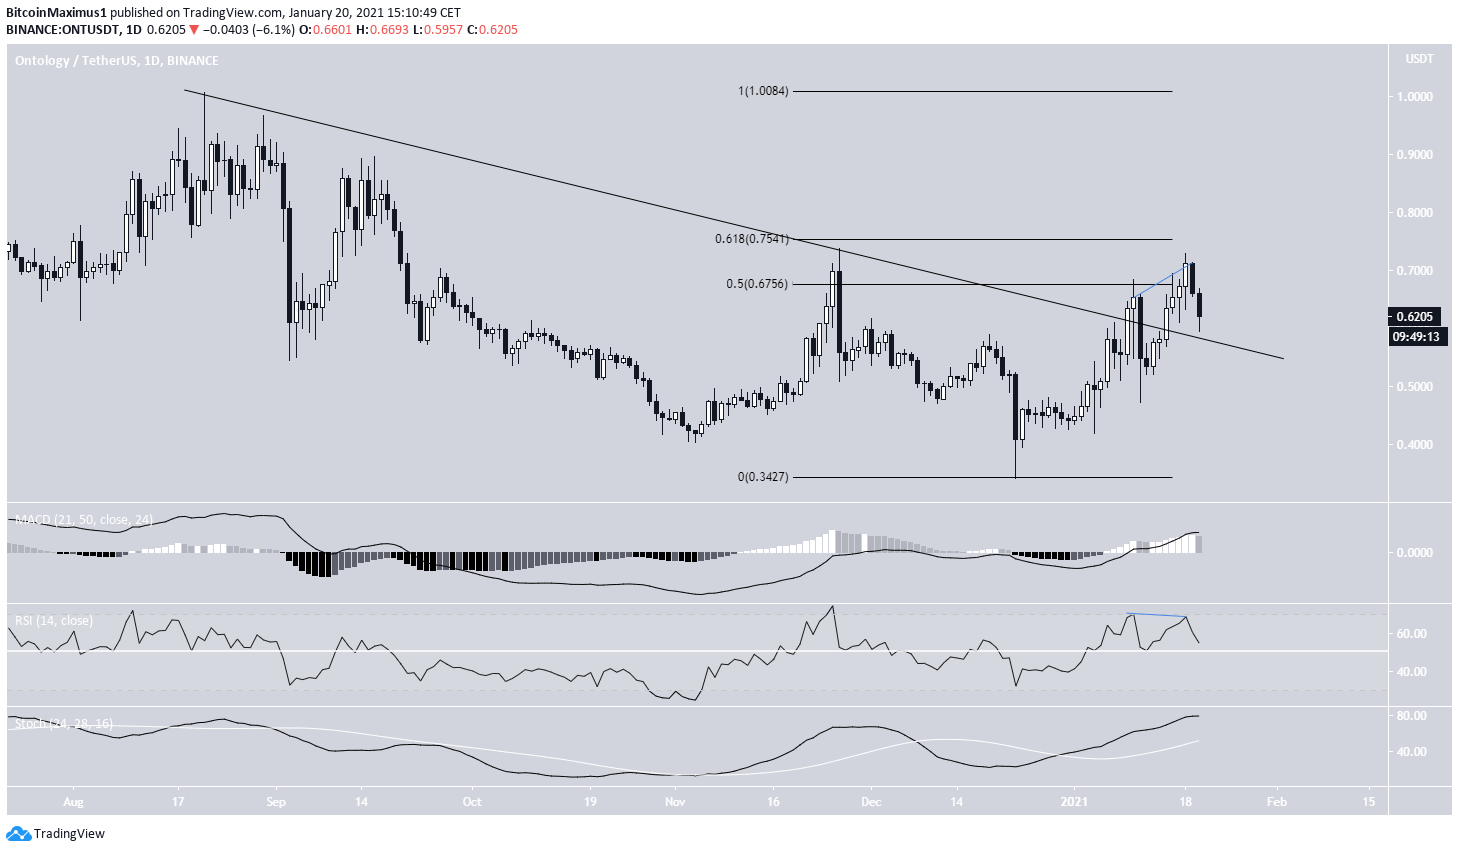
Since the tweet, ONT has broken this line and is currently in the process of validating it as resistance. The move was preceded by bearish divergence in the RSI.
Since a decline has already occurred as a result of the divergence, and the MACD and the RSI are moving upwards, we can state that technical indicators provide a bullish outline.
However, ONT has yet to move above the 0.5-0.618 Fib retracement levels between $0.675-$0.754. Until it does, we cannot consider the trend bullish.

Future Movement
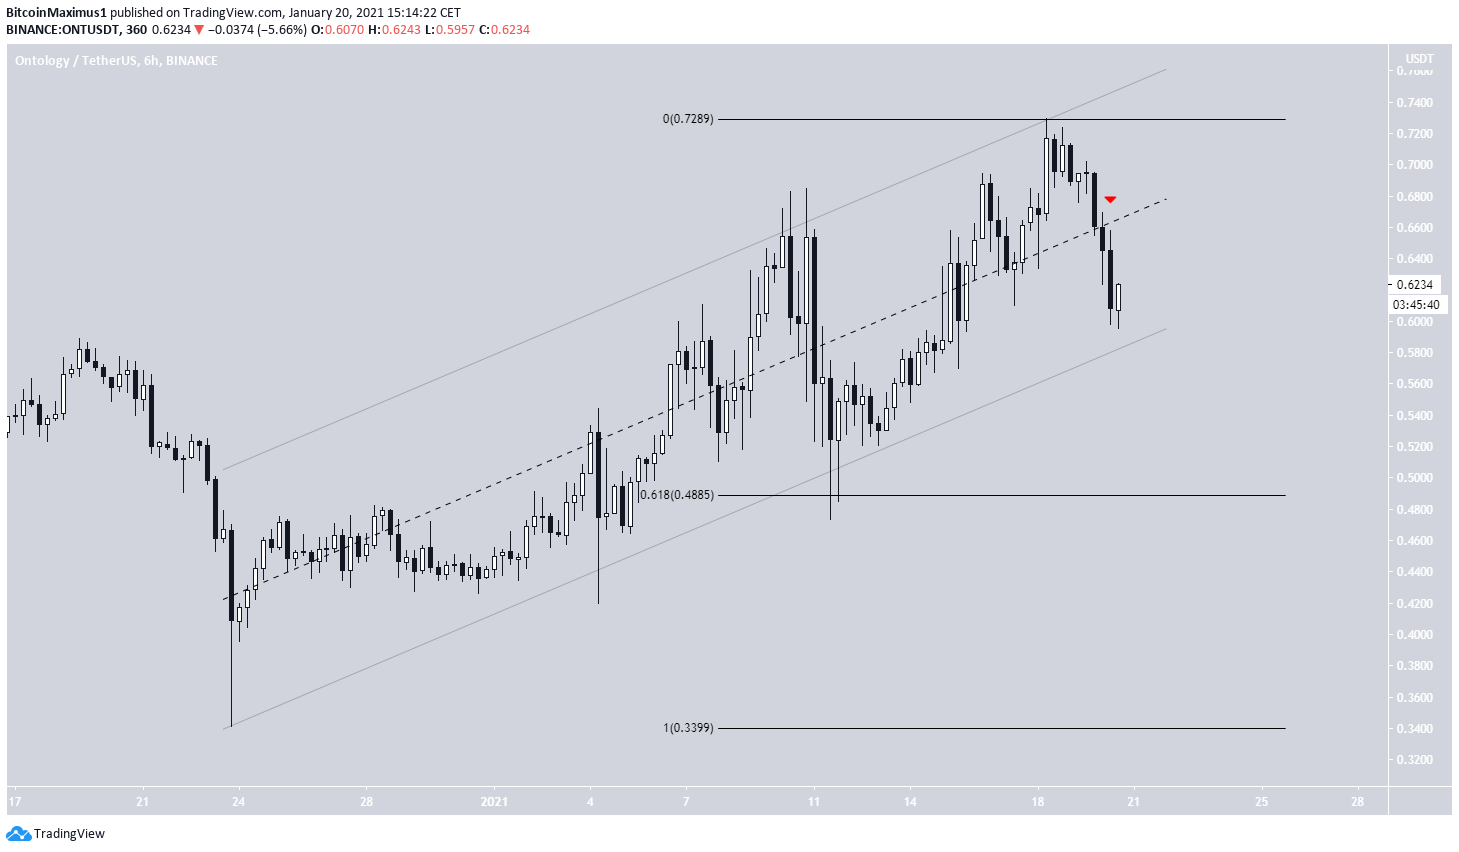
The shorter-term six-hour chart shows that ONT is trading inside a parallel ascending channel, indicating that the movement is corrective.
The breakdown from the middle of the channel (red arrow) further supports this possibility.
Nevertheless, even if ONT were to break down from the channel, it would likely find support at $0.48, the 0.618 Fib retracement level of the entire upward movement.
This minor support area is above the long-term support area of $0.45, so the possibility of a breakout remains as long as ONT is trading above this level.

Conclusion
To conclude, while there are no definite signs that ONT will break out from the long-term resistance line, the long-term trend remains bullish as long as it’s trading above $0.45.
For BeInCrypto’s latest Bitcoin (BTC) and altcoin analyses, click here!
Disclaimer
In line with the Trust Project guidelines, this price analysis article is for informational purposes only and should not be considered financial or investment advice. BeInCrypto is committed to accurate, unbiased reporting, but market conditions are subject to change without notice. Always conduct your own research and consult with a professional before making any financial decisions. Please note that our Terms and Conditions, Privacy Policy, and Disclaimers have been updated.

