


A look at on-chain indicators, more specifically the Stablecoin Supply Ratio (SSR) and tether (USDT) supply on exchanges, in order to determine the buying power of stablecoins over bitcoin (BTC).
The SSR has fallen to a record low, while USDT supply is close to a record high. Binance USD (BUSD) supply is at a new all-tme high.
SSR
SSR is the ratio between the BTC and stablecoin supply. It moves by a change in either the BTC price or the stablecoin supply.
A low value suggests that stablecoins can buy a significant supply of BTC. For example, a value of 10 indicates that 10% of the supply can be bought by stablecoins (1/10).
SSR falls to record low
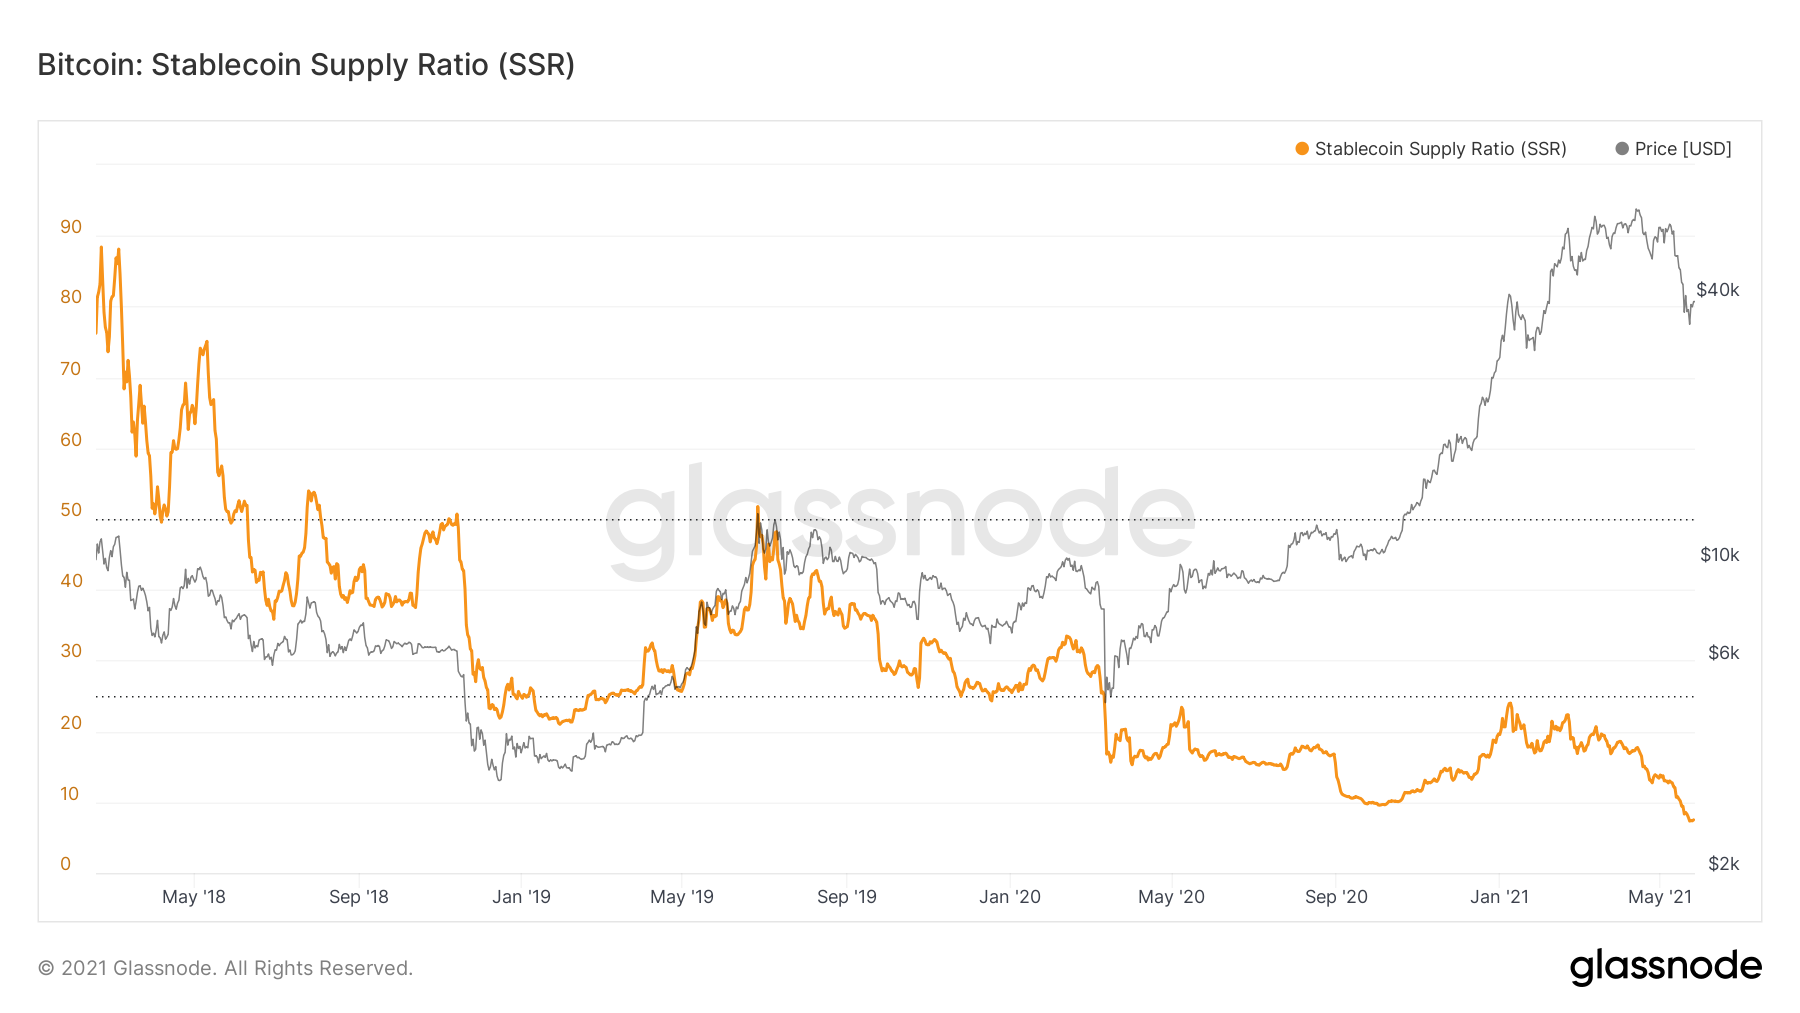
The SSR data starts in March 2018. The indicator value initially hovered between 50 and 80, before falling in the December 2018. Afterwards, it mirrored the BTC price movement, until the March 2020 correction. However, they have diverged since.
While the BTC price has been increasing, it would have been conventional to expect a similar increase in SSR. However, the increase in the stablecoin supply has offset the BTC price increase.
In fact, on May 23, SSR fell to an all-time low of 7.33. This occurred, since the BTC price dropped, while the stablecoin supply remained constant.
A SSR of 7.33 indicates that stablecoins can purchase up to 13.6% of the BTC supply (1/7.33). On May 23, it fell to an all-time low of 7.33.
USDT balance close to record highs
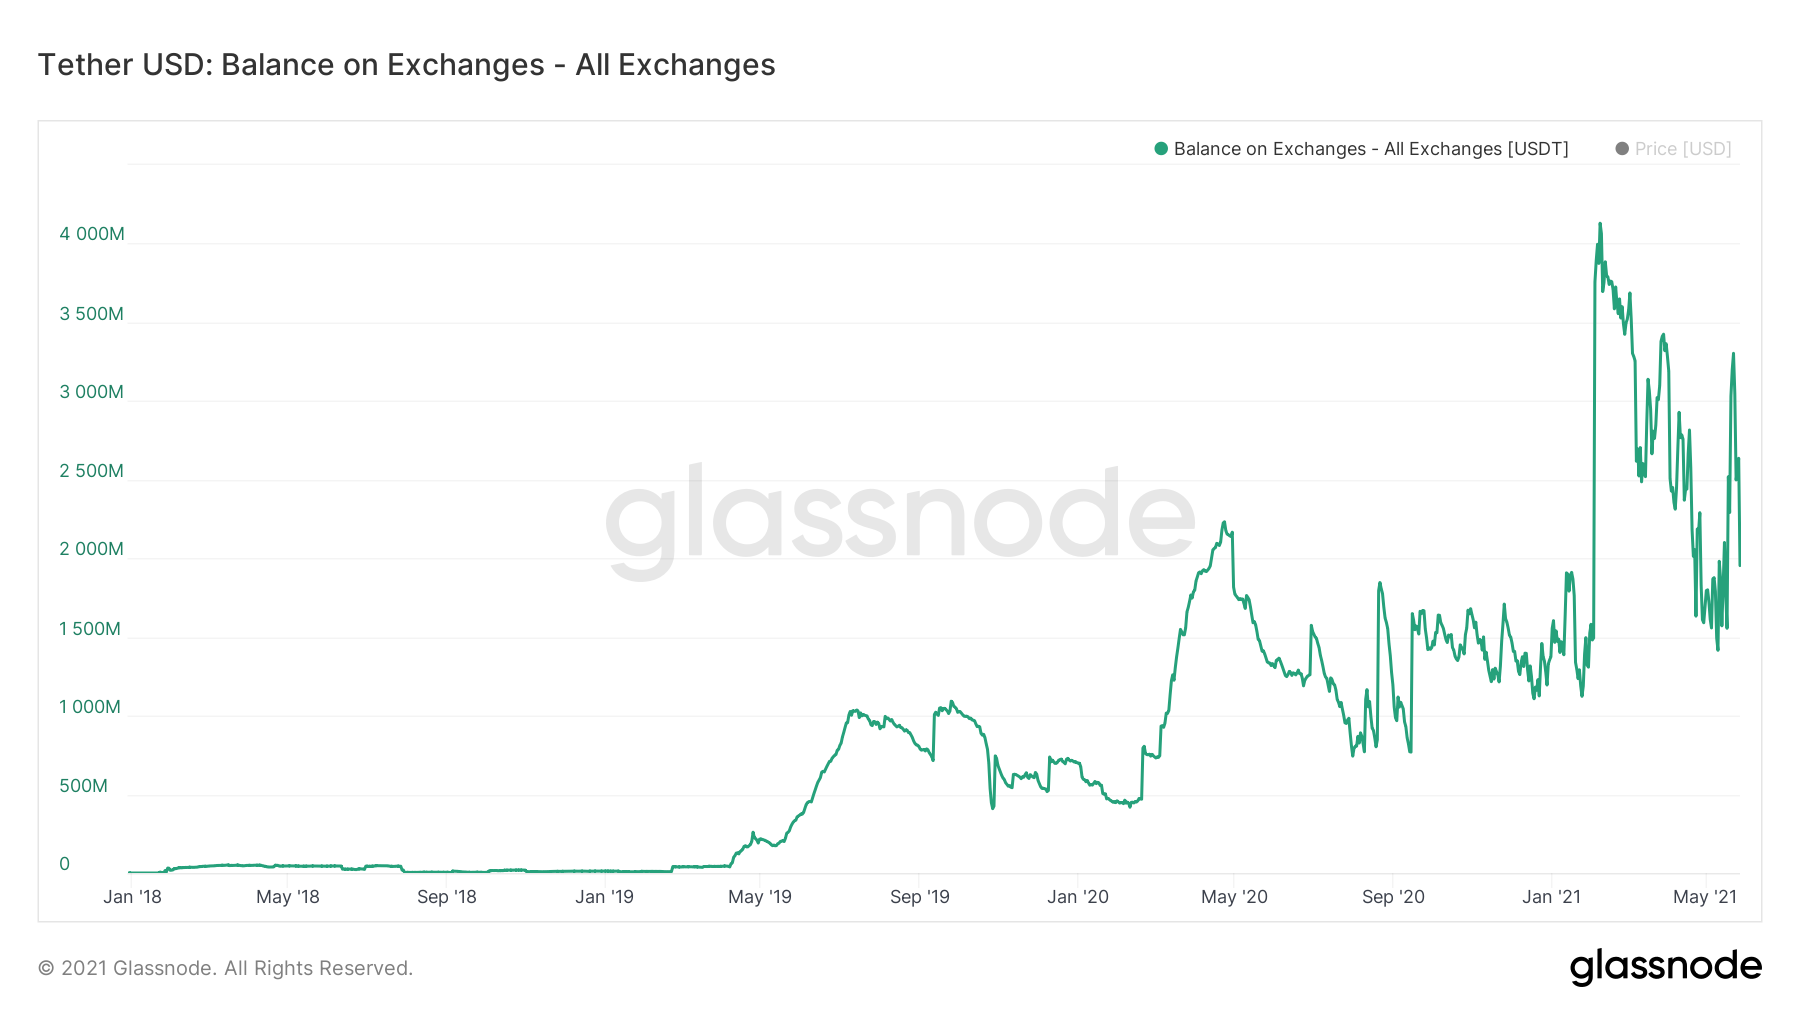
The USDT supply held on exchanges has been increasing throughout the year. It reached an all-time high of $4.1 billion on Feb. 7, before falling sharply. However, it is still considerably above its January levels.
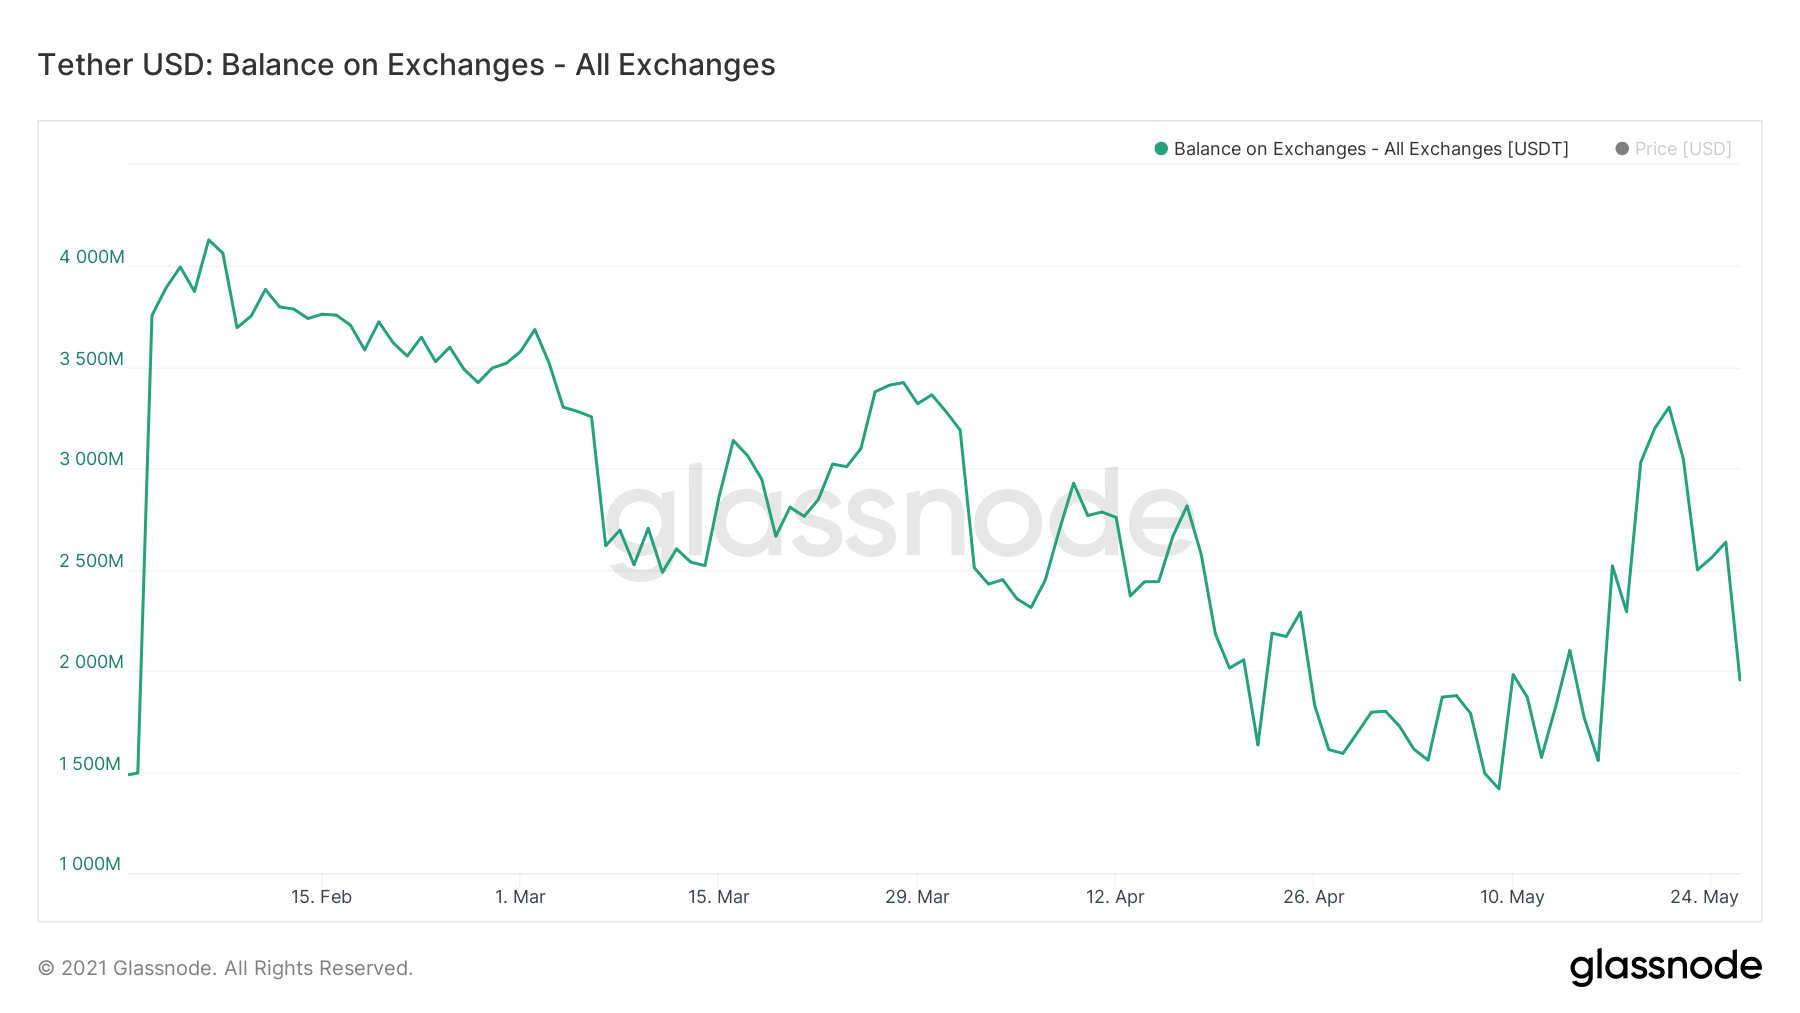
An interesting development is the spike to $3.3 billion on May 21 and its subsequent decrease. This indicates that an inflow of USDT on exchanges preceded the drop and was then used to buy the dip.
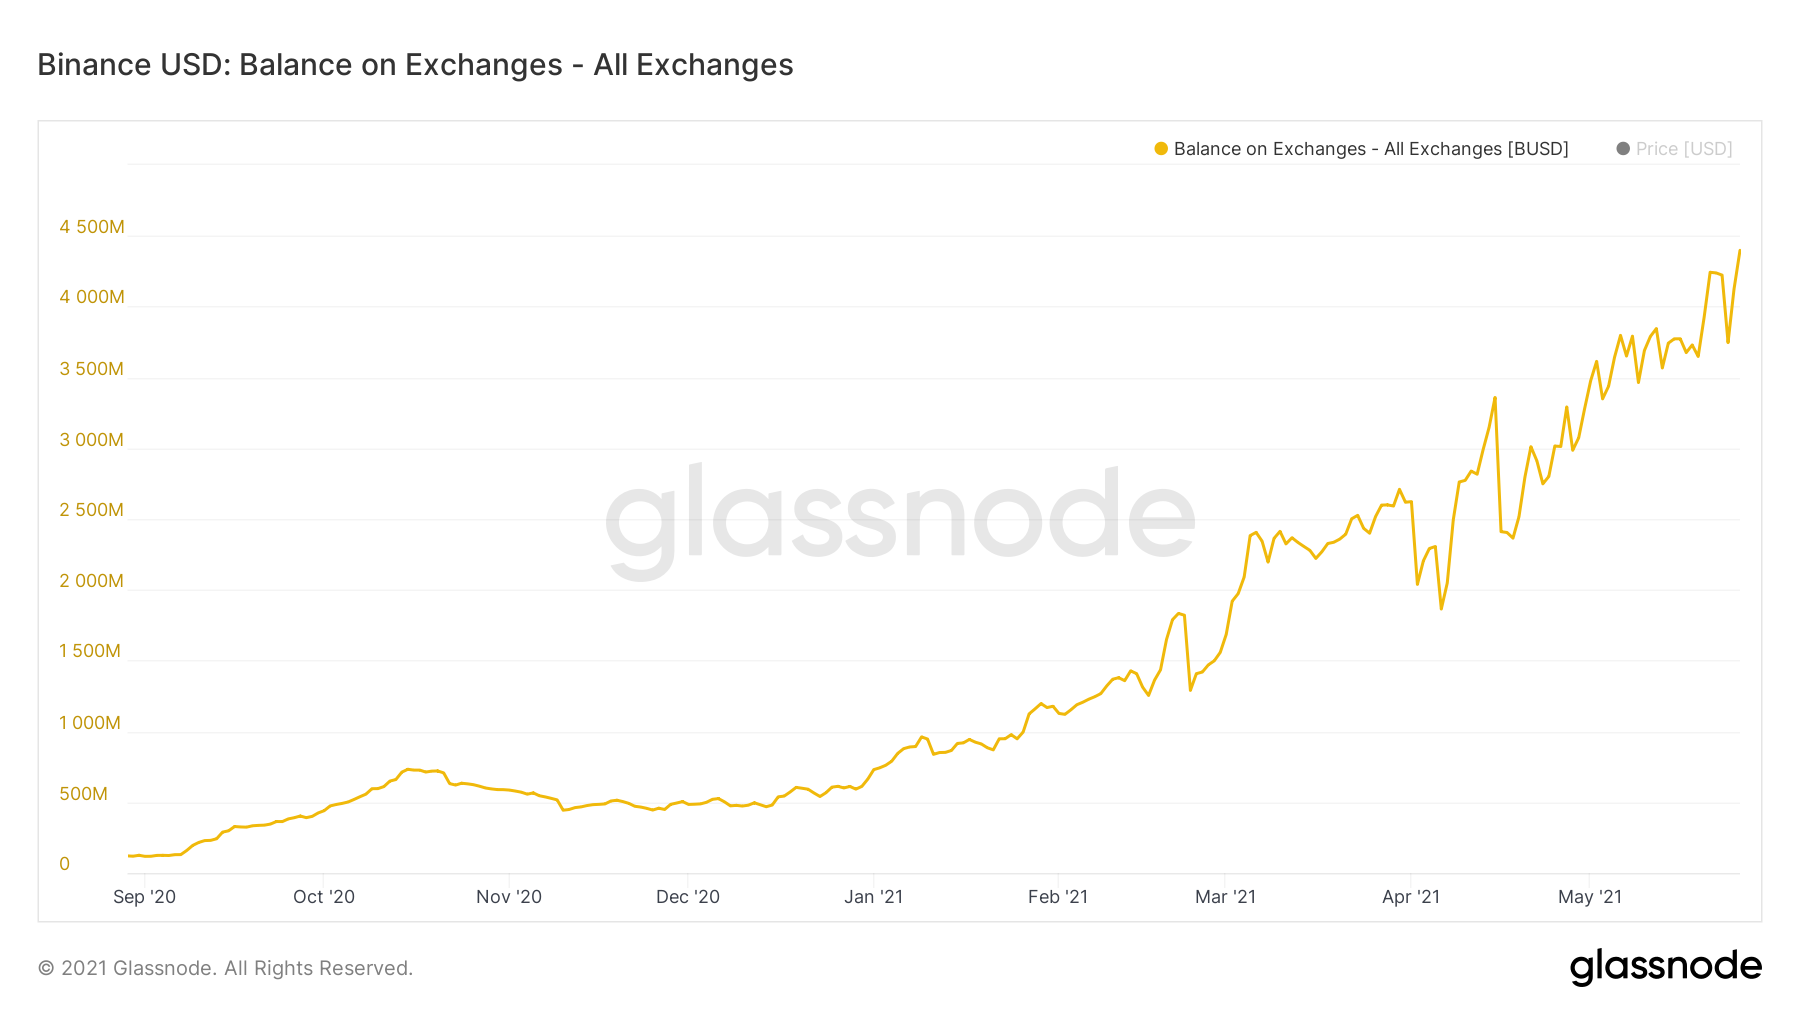
The BUSD supply has been increasing constantly since September 2020. Unlike USDT, it has not decreased at all this year and managed to reach a new all-time high $4.3 billion, on May 26.
BUSD is one of the stablecoins which is used to calculate the SSR ratio, so the increase in the BUSD supply helps explain the SSR drop.
For BeInCrypto’s latest bitcoin (BTC) analysis, click here.



