


OMG Network (OMG) has broken out from a long-term horizontal resistance area.
Polkadot (DOT) has reclaimed the $41.50 resistance area and is heading for a new all-time high (ATH) price.
Ardor (ARDR) has broken out from the long-term $4.35 resistance area.
OMG network (OMG)
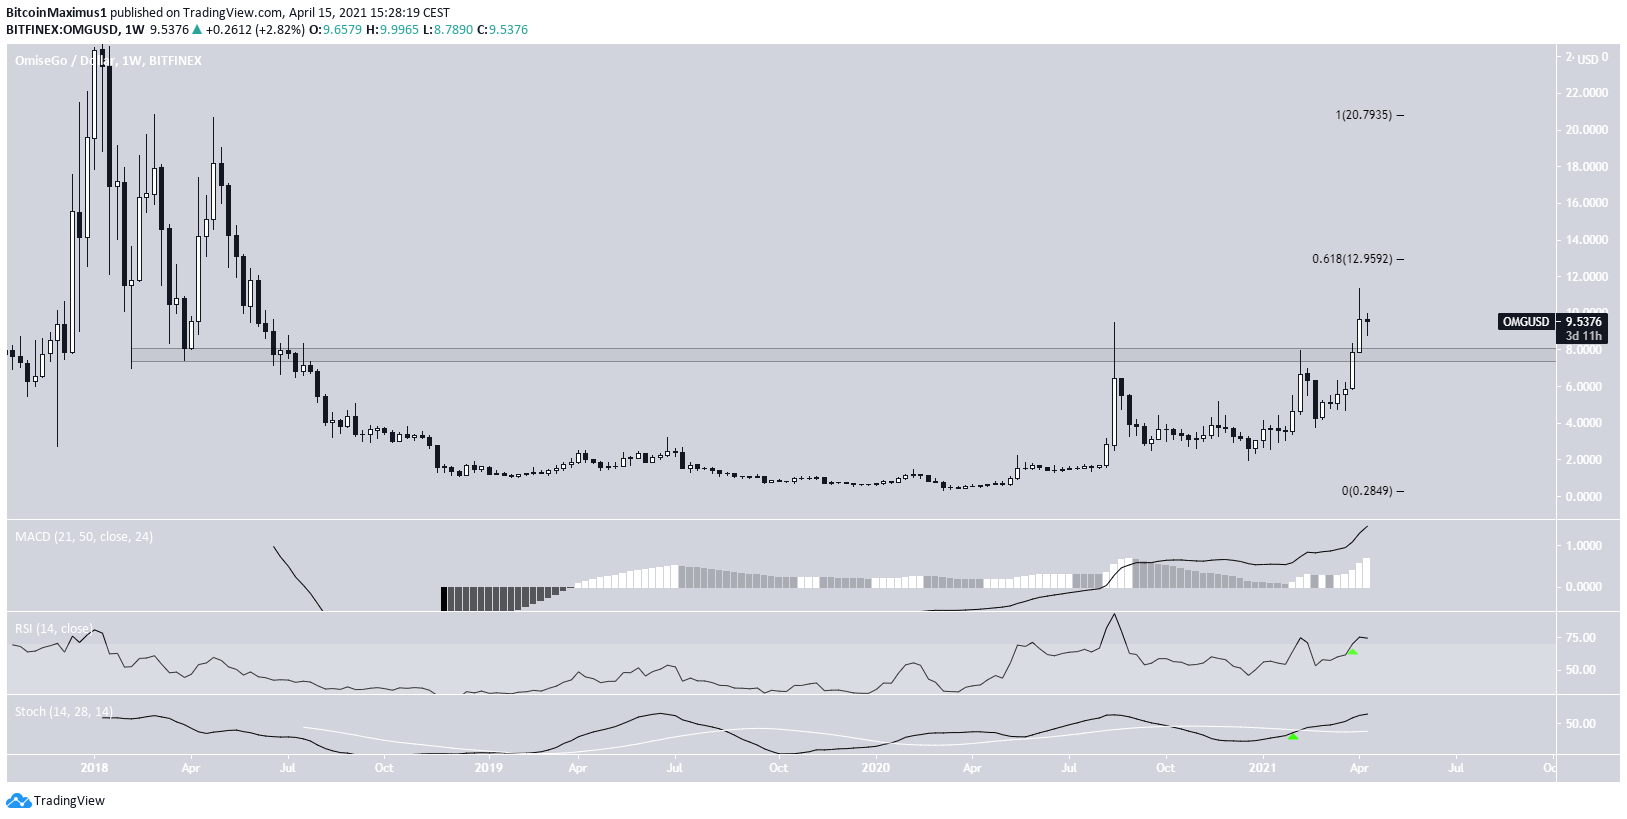
After numerous unsuccessful attempts, OMG managed to finally break out above the long-term $7.80 area in the beginning of April.
It managed to reach a high of $11.33, before decreasing slightly.
There is resistance at $12.95, in the form of the 0.618 Fib retracement level. However, the main resistance area is found at $20.80.
Technical indicators are bullish, supporting the continuation of the upward movement.
This is especially visible from the RSI cross above 70 and the bullish cross in the Stochastic Oscillator.
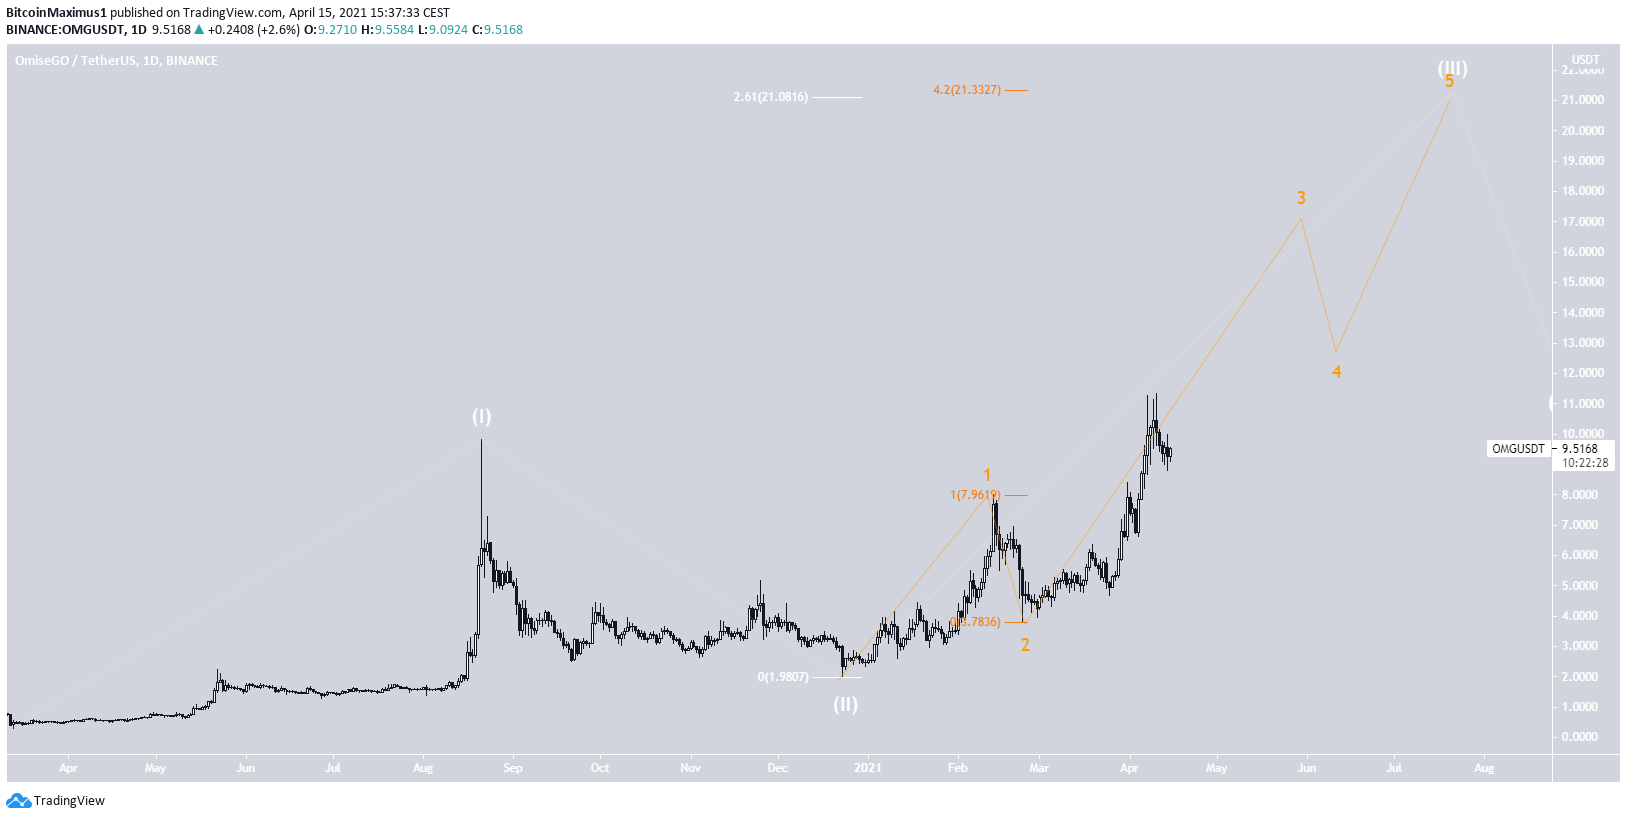
The wave count also supports this assessment.
OMG seems to be in an extended wave three (white), which has a potential target near $21, fitting with the previously outlined long-term resistance area.
The sub-wave count is given in orange, also providing more confluence near the same resistance level.
On April 15, the OMG/TRY pair was listed on the biggest Turkish cryptocurrency exchange, BtcTurk.
Highlights
- OMG has broken out from the long-term $7.80 resistance area.
- It is in an extended long-term wave three.
Polkadot (DOT)
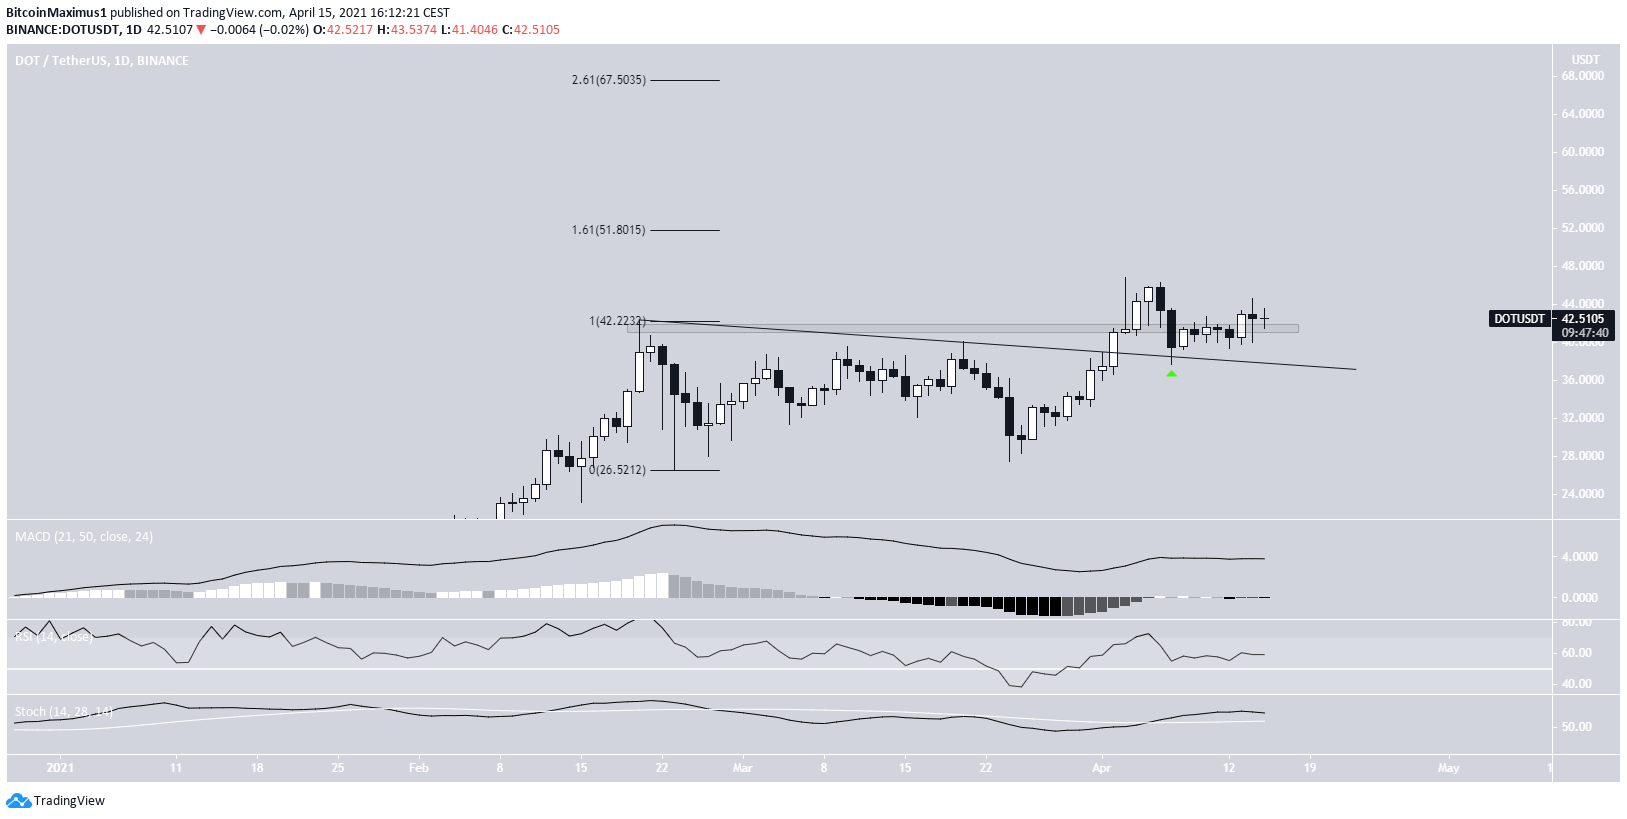
DOT had been following a descending resistance line since reaching a then all-time high price of $42.28.
On April 2, it broke out from this line and reached a new all-time high price of $46.80, the next day.
After returning to validate the line as support, DOT began the current upward movement. It has now reclaimed the $41.50 area and validated it as support.
Technical indicators support the continuation of the upward movement. The next resistance areas are found at $51.80 and $67.50.
Highlights
- DOT has broken out from a descending resistance line.
- It has reclaimed the $41.50 resistance area.
Ardor (ARDR)
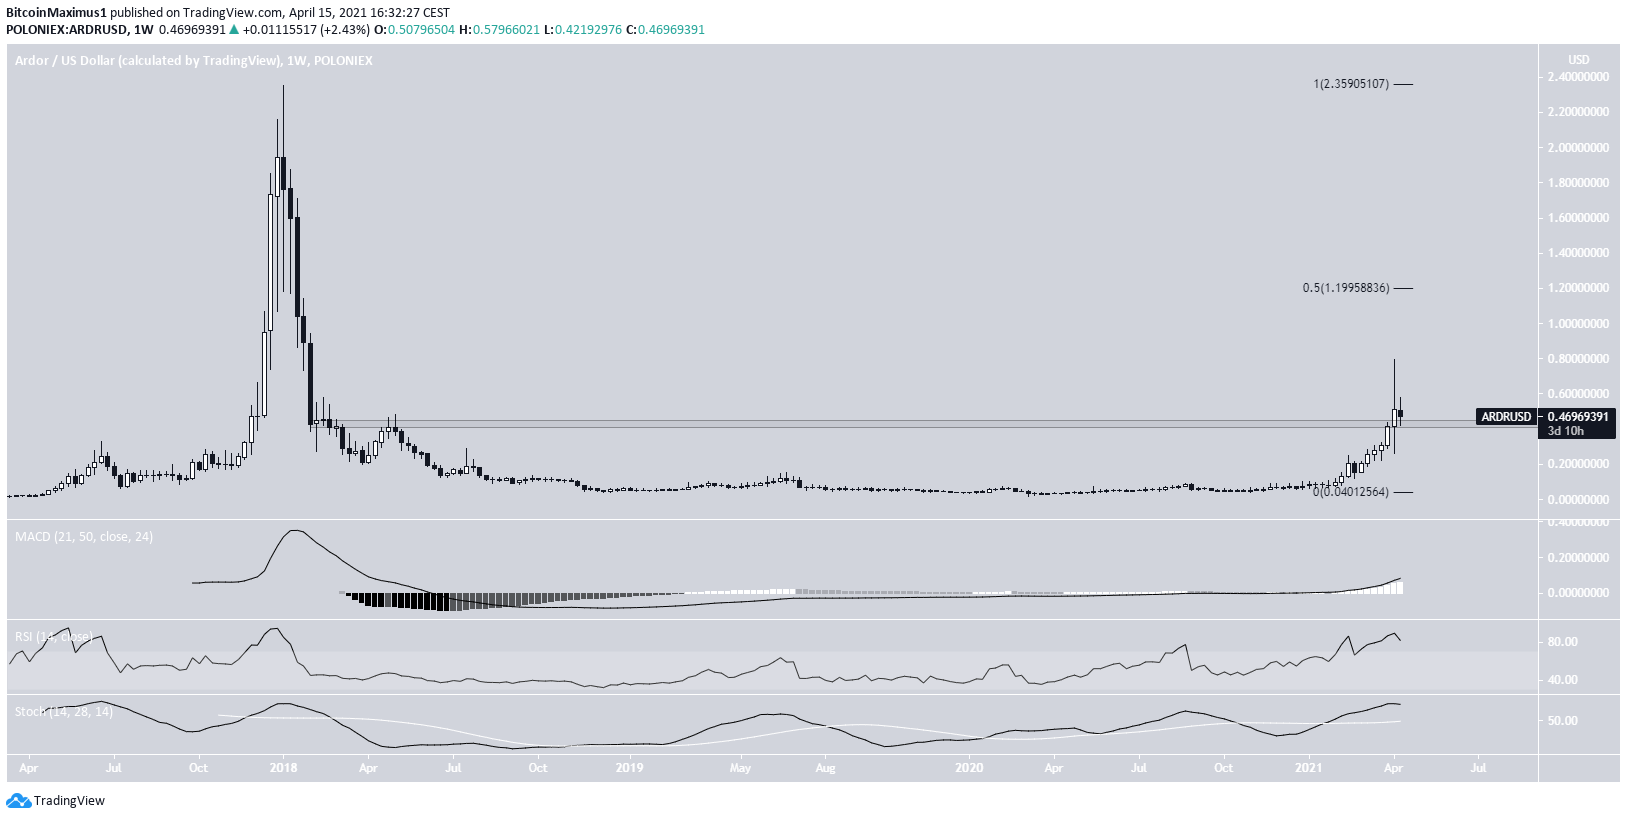
During the first week of April, ARDR broke out above the $0.435 resistance area. It had been trading below this level since April 2018.
It proceeded to reach a high of $0.798 before dropping.
Currently, it is in the process of validating the aforementioned area as support. If successful, the next resistance area would be found at $1.20.
Technical indicators are bullish, supporting the continuation of the upward movement.
Highlights
- ARDR has broken out from the long-term $0.435 resistance area.
- Long-Term indicators are bullish.
For BeInCrypto’s latest bitcoin (BTC) analysis, click here.


