
The OmiseGo (OMG) price has tripled in value during August. The trend has yet to show any weakness, so the price could increase towards the resistance levels outlined in the article.
The movement is similar for both the USD and BTC pairs.
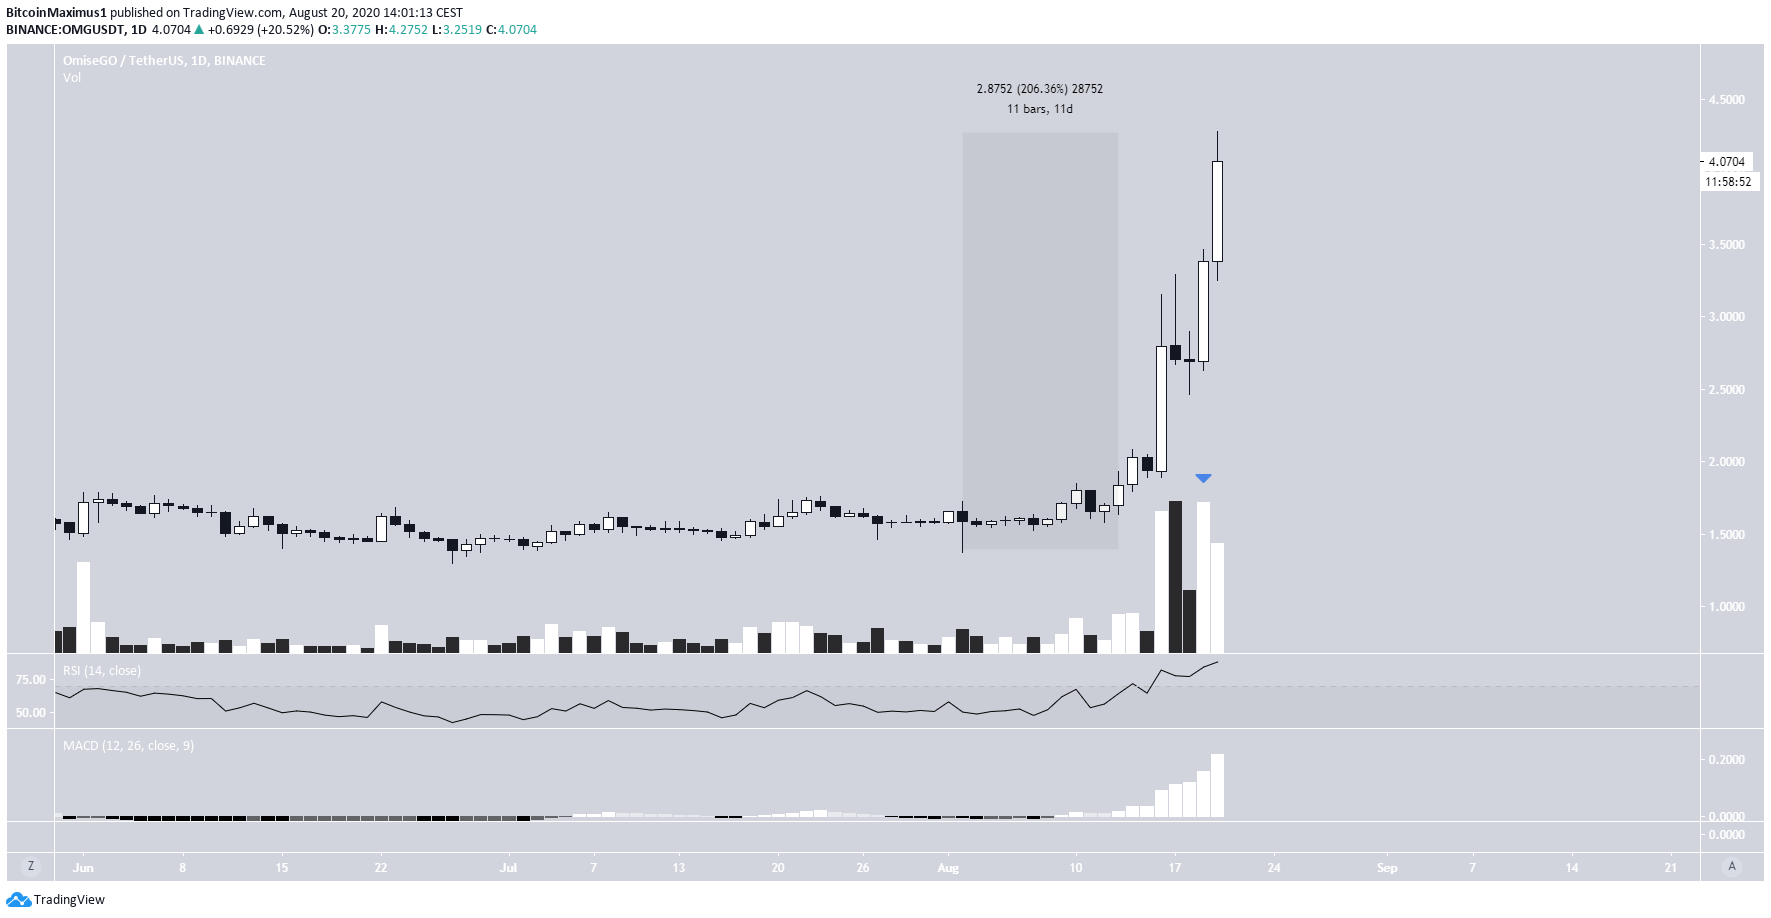
OMG Triples in Value
Since a significant drop on August 2, which created a hammer candlestick, the OMG price has increased by a massive 200%, reaching a high of $4.4 today.
Even though the rise has been almost vertical, technical indicators have yet to show any weakness. Volume has been increasing throughout the upward move, and while the RSI is overbought, it has not formed any bearish divergence. The same can be said about the MACD.
Therefore, it’s possible that the upward move will continue.
Long-Term Targets
Cryptocurrency trader @mesawine1 stated that OMG could increase all the way to $6.2, due to the lack of resistance from the current price to the target.
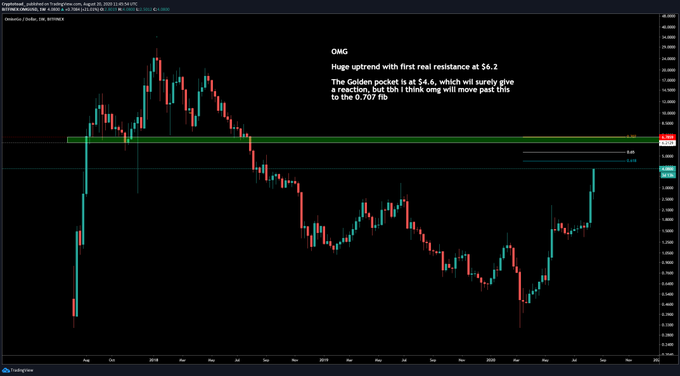
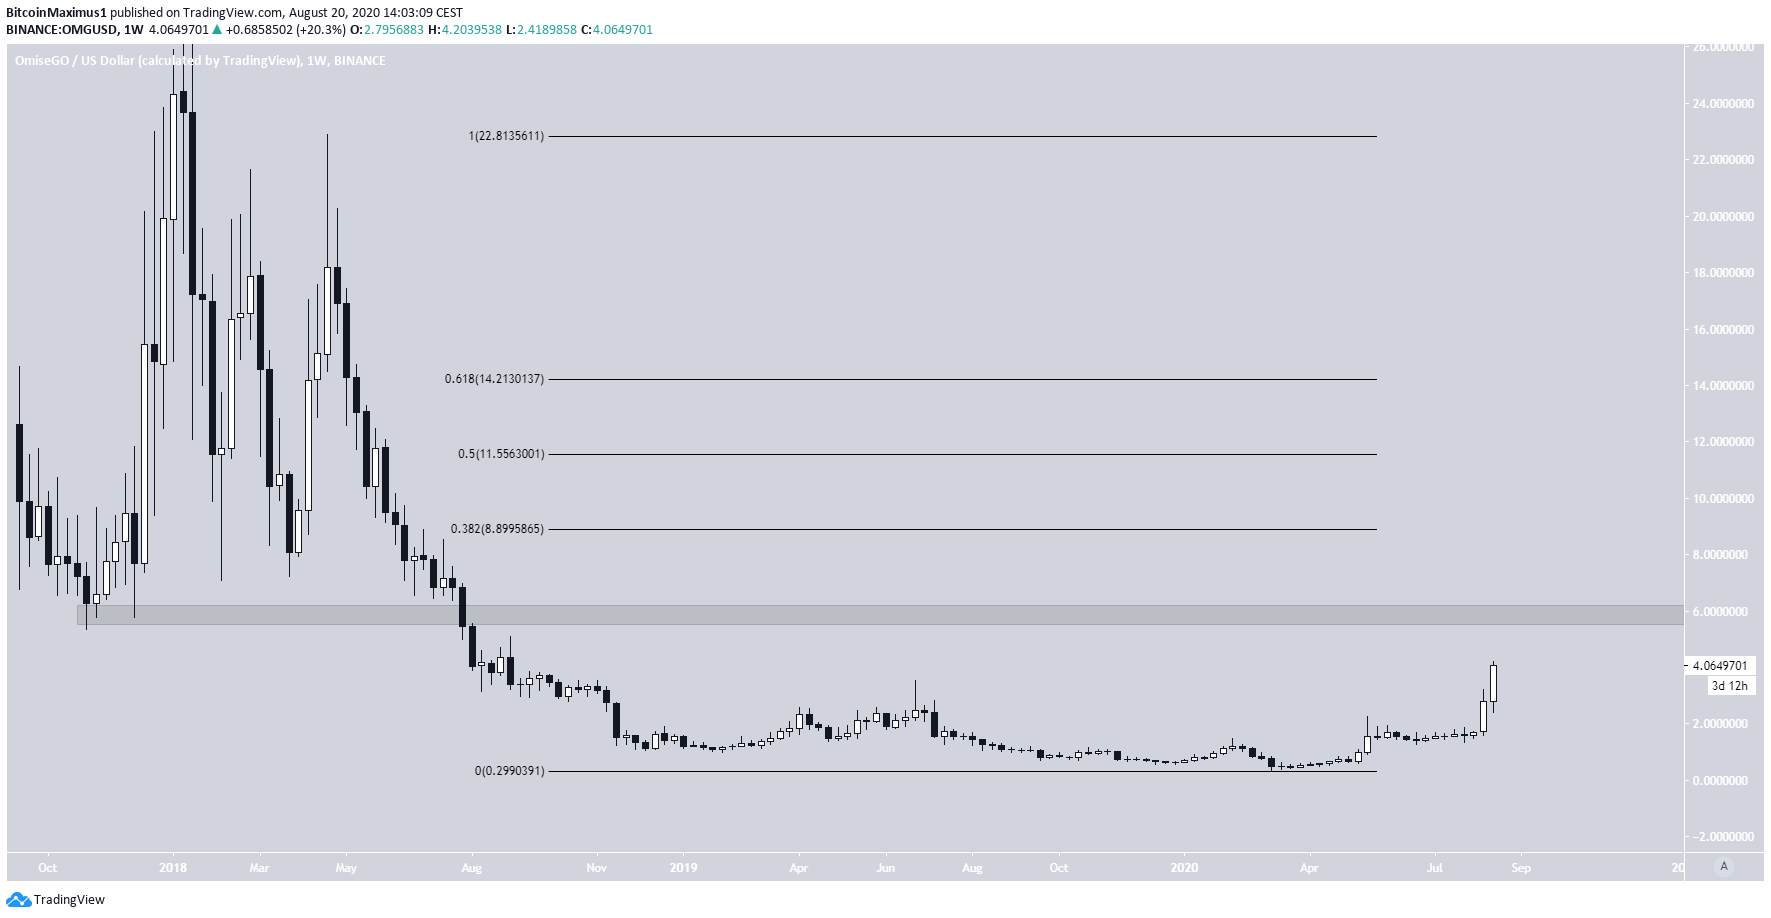
Indeed, the closest resistance area is found near $6, a level that provided support in October 2017. Once the price broke down from this level in July 2018, it caused a rapid decline that saw the price reach a low of $0.29 on March 9.
On the upside, the $6 level should act as resistance if the price reaches there.
It’s interesting to note that the price has yet to reach any important Fib levels from the most recent fall. The 0.382, 0.5, and 0.618 levels are found at $9, $11.5 and $14.20, respectively, and should provide resistance if the price successfully breaks out above $6.
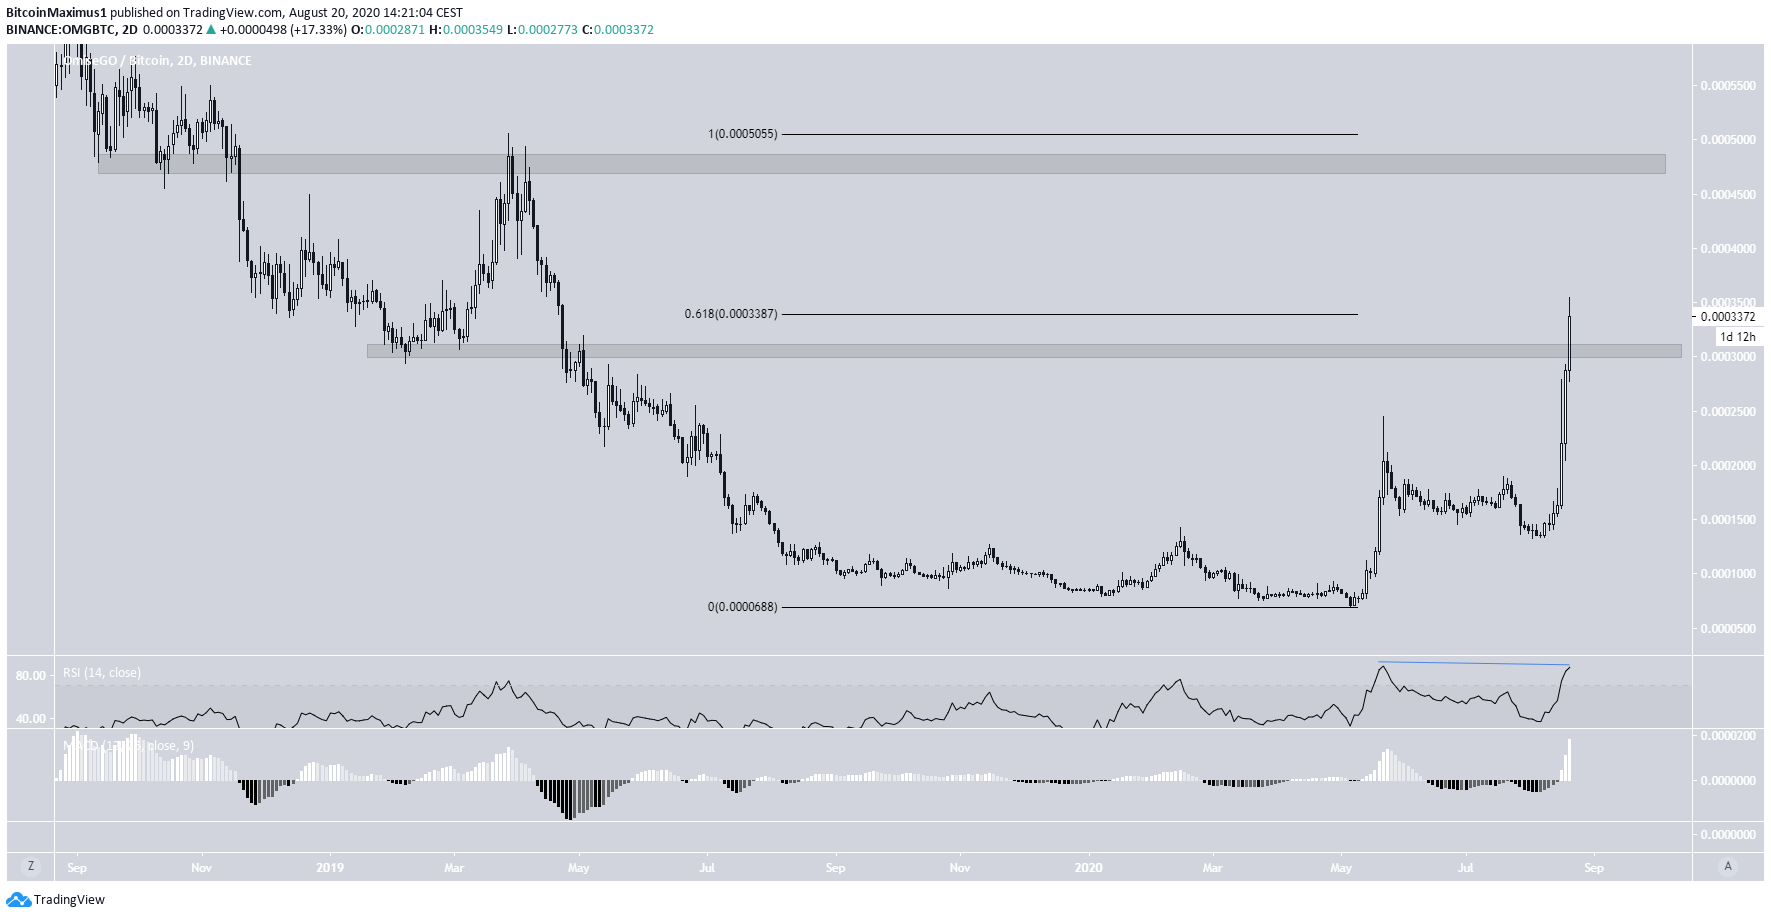
OMG/BTC
The OMG/BTC pair shows a similar chart based on the rate of increase. However, the main difference is the numerous resistance levels above the current price.
Currently, OMG has broken out from the 30,000 satoshi level but has yet to validate this as support. OMG is trading right at the 0.618 Fib level of the previous downward move, which is a likely reversal level.
If it successfully moves above it, the next resistance area would be found at 47,000 satoshis. The price has to hold above the 30,000 satoshi area in order for the trend to be considered bullish.
There is a slight bearish divergence on the RSI, which is overbought. There is none yet on the MACD.
To conclude, while both OMG/USD and OMG/BTC look bullish, the trend for the latter is not nearly as strong as it is for the former.
